
|
市場調査レポート
商品コード
1627130
ナノチューブ:市場シェア分析、産業動向、成長予測(2025~2030年)Nanotubes - Market Share Analysis, Industry Trends & Statistics, Growth Forecasts (2025 - 2030) |
||||||
カスタマイズ可能
適宜更新あり
|
|||||||
| ナノチューブ:市場シェア分析、産業動向、成長予測(2025~2030年) |
|
出版日: 2025年01月05日
発行: Mordor Intelligence
ページ情報: 英文 120 Pages
納期: 2~3営業日
|

全表示
- 概要
- 目次
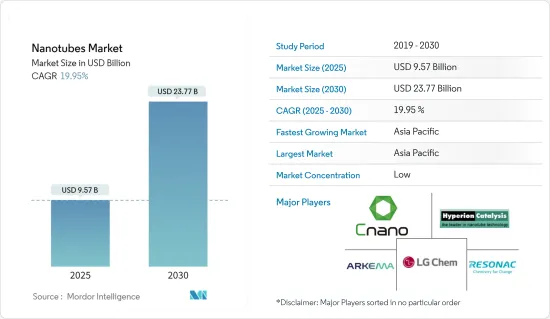
ナノチューブ市場規模は2025年に95億7,000万米ドルと推計され、2030年には237億7,000万米ドルに達すると予測され、予測期間(2025-2030年)のCAGRは19.95%です。
ナノチューブ市場は、COVID-19の大流行によって生産と移動が減速し、半導体が不足したため、ナノチューブ市場にマイナスの影響を与えました。また、エレクトロニクス、エネルギー、航空宇宙などの産業も、封じ込め対策や経済的混乱により生産の遅れを余儀なくされました。現在、市場はパンデミックから回復しています。市場は2022年にはパンデミック以前の水準に達し、今後も安定した成長が見込まれます。
調査した市場の成長を促す主な要因は、ナノチューブ技術の進歩とカーボンナノチューブの採用拡大です。
その反面、高い製造コストと研究開発コストが、調査対象市場の成長における主要な障害となっています。
電子機器や記憶装置における潜在的用途の増加は、予測期間中、調査対象市場に機会を提供する可能性が高いです。
エレクトロニクス、エネルギー、航空宇宙、防衛などの産業からの用途と需要の増加がナノチューブの需要を大きく牽引しているため、アジア太平洋が世界市場を独占しています。
ナノチューブ市場動向
電子・半導体セグメントが市場需要を独占
- ナノチューブは、より高速で、より効率的で、より耐久性のある電子デバイスの開発のために、エレクトロニクス産業で広範な用途を見出しています。
- あらゆる種類のナノチューブの中でも、カーボンナノチューブはエレクトロニクス産業での応用により、市場の需要をリードしています。カーボンナノチューブ以外にも、シリコンナノチューブや無機ナノチューブもエレクトロニクス産業で使用されています。
- カーボン・ナノチューブは、ディスプレー、大面積表面伝導、カラー電界発光ディスプレー、センサー、ディスプレー用バックライト、進行波管、トランジスター、光起電力、ディスプレー以外の用途の導電性添加剤、フォトニクス、無線周波数識別(RFID)タグ、中性子線源、ガンマ線源、照明装置などに応用されています。
- シリコンナノチューブは水素分子を含み、金属燃料のような働きをします。そのため、エレクトロニクス産業における半導体用途に広く使用されています。
- 無機ナノチューブもまた、半導体デバイス、センサー、バイオセンサー、ナノモーター、フラットパネルディスプレイへの応用のためにエレクトロニクス産業で使用されています。したがって、いくつかの電子部品におけるナノチューブの多様な応用のおかげで、ナノチューブの需要は増加すると予想されます。
- 電気・電子産業における使用量の増加と応用分野の拡大は、市場の成長を促進すると予想されます。
- 例えば、日本電子情報技術産業協会(JEITA)によると、世界の電子・IT産業の生産額は、2021年の3兆4,159億米ドルに対し、2022年には3兆4,368億米ドルと推定され、前年比1%の成長率を記録しました。さらに、2023年には前年比3%の成長率で3兆5,266億米ドルに達すると予想されています。
- 半導体産業協会(SIA)によると、2022年の世界の半導体産業売上高は5,741億米ドルとなり、2021年の5,559億米ドルに比べ3.3%の増加を記録しました。
- さらに地域別では、2022年の南北アメリカ市場の売上高が最大の増加(16.2%)を記録しました。中国は引き続き半導体の最大の個別市場であり、2022年の売上高は2021年比6.2%減の1,804億米ドルとなった。さらに、欧州(12.8%)と日本(10.2%)でも2022年の年間売上高が増加しました。
- この成長により、予測期間中に同地域の電子用途向けナノチューブの需要が増加すると予想されます。
市場を独占するアジア太平洋地域
- アジア太平洋地域は、エレクトロニクス、エネルギー、ヘルスケア、航空宇宙・防衛、自動車などの産業からの需要増加により、世界市場シェアを独占しています。
- 電子情報技術産業協会(JEITA)によると、日本のエレクトロニクス産業の国内生産額は2022年に11兆1,243億円(851億9,000万米ドル)と推定され、前年比2%の成長率を示しています。日本のエレクトロニクス産業による国内生産は、2023年には11兆4,029億円(873億2,000万米ドル)に達する可能性が高く、前年比3%の成長率を記録します。
- さらに、電子情報技術省によると、インド全土の消費者向け電子機器(テレビ、アクセサリー、オーディオ)の生産額は、2022年度には7,450億インドルピー(94億6,000万米ドル)を超えています。こうして市場の成長を支えています。
- さらに、中国民用航空局(CAAC)は、航空セクターの国内交通量がパンデミック前の85%程度まで回復すると見積もっています。ボーイングのコマーシャル・アウトルック2023-2042によると、中国では2042年までに約8,560機が新たに納入され、市場サービス額は2042年までに6,750億米ドルに達します。このような新規納入により、航空機分野でのナノチューブの需要は増加すると思われます。
- さらに、アジア太平洋地域における自動車産業の成長によって、市場の成長はさらに後押しされます。中国、インド、日本、韓国などの新興諸国は、自動車製造の収益性を高めるため、製造基盤の強化と効率的なサプライチェーンの開発に力を入れています。
- 中国政府の政策展開には、新たな内燃機関車製造工場への投資制限や、2025年までに小型乗用車の平均燃費を引き締めるという提案が含まれます。
- また、インド自動車工業会(SIAM)によると、2022年にインドで販売された乗用車は379万台で、2021年に販売された乗用車と比較して約23%の成長率を記録しました。
- さらに、中国民用航空局(CAAC)は、航空部門の国内交通量がパンデミック前の85%程度まで回復すると見積もっています。ボーイング商業アウトルック2023-2042によると、中国では2042年までに約8,560機が新たに納入され、市場サービス額は2042年までに6,750億米ドルに達します。
- したがって、上記の動向は、予測期間中、同地域のナノチューブ需要を促進すると予想されます。
ナノチューブ産業の概要
ナノチューブ市場は細分化されています。調査対象市場の主要企業(順不同)には、Arkema、Hyperion Catalysis International、Jiangsu Cnano Technology、Resonac Holdings Corporation、LG Chemなどが含まれます。
その他の特典:
- エクセル形式の市場予測(ME)シート
- 3ヶ月間のアナリスト・サポート
目次
第1章 イントロダクション
- 調査の前提条件
- 調査範囲
第2章 調査手法
第3章 エグゼクティブサマリー
第4章 市場力学
- 促進要因
- ナノチューブ技術の進歩
- カーボンナノチューブの採用拡大
- その他の促進要因
- 抑制要因
- 高い製造コストと研究開発コスト
- その他の阻害要因
- 産業バリューチェーン分析
- ポーターのファイブフォース分析
- 供給企業の交渉力
- 買い手の交渉力
- 代替品の脅威
- 新規参入業者の脅威
- 競合の程度
第5章 市場セグメンテーション(金額ベース市場規模)
- 種類別
- カーボンナノチューブ
- シリコンナノチューブ
- 無機ナノチューブ
- その他のタイプ(メンブレンナノチューブなど)
- 構造タイプ別
- 非ポリマー有機ナノ材料
- 高分子ナノ材料
- 用途別
- 水素貯蔵デバイス
- センサー
- 高分子生体材料
- リチウムイオン電池
- 発光表示デバイス
- バイオセンサー
- ナノ電極
- 浄水フィルター
- 半導体デバイス
- 導電性プラスチック
- エンドユーザー産業別
- ヘルスケア
- エレクトロニクス
- エネルギー
- 自動車
- 航空宇宙・防衛
- 繊維
- その他のエンドユーザー産業(化学材料など)
- 地域別
- アジア太平洋
- 中国
- インド
- 日本
- 韓国
- その他アジア太平洋地域
- 北米
- 米国
- カナダ
- メキシコ
- 欧州
- ドイツ
- 英国
- フランス
- イタリア
- その他欧州
- 南米
- ブラジル
- アルゼンチン
- その他南米
- 中東・アフリカ
- サウジアラビア
- 南アフリカ
- その他中東とアフリカ
- アジア太平洋
第6章 競合情勢
- M&A、合弁事業、提携、協定
- 市場シェア(%)**/ランキング分析
- 主要企業の戦略
- 企業プロファイル
- Arkema
- Carbon Solutions Inc.
- Cheap Tubes
- Hyperion Catalysis International
- Jiangsu Cnano Technology Co., Ltd.
- Nano-C
- Nanocyl SA(Birla Carbon)
- NanoIntegris Inc.
- Nanoshel LLC
- Resonac Holdings Corporation
- Thomas Swan & Co. Ltd
- LG Chem
第7章 市場機会と今後の動向
- 電子機器やストレージ機器における潜在的用途の増加
- その他の機会
The Nanotubes Market size is estimated at USD 9.57 billion in 2025, and is expected to reach USD 23.77 billion by 2030, at a CAGR of 19.95% during the forecast period (2025-2030).
The nanotubes market was negatively impacted by the COVID-19 pandemic as there was a slowdown in production and mobility, which caused a shortage of semiconductors, which negatively impacted the market for nanotubes. Also, industries such as electronics, energy, and aerospace were forced to delay their production due to containment measures and economic disruptions. Currently, the market has recovered from the pandemic. The market reached pre-pandemic levels in 2022 and is expected to grow steadily in the future.
The major factors driving the growth of the market studied are an advancement in nanotube technologies and the growing adoption of carbon nanotubes.
On the flip side, high manufacturing and R&D costs serve as one of the major stumbling blocks in the growth of the market studied.
Rising potential uses in electronic and storage devices are likely to provide opportunities for the market studied during the forecast period.
Asia-Pacific dominated the global market, as the increasing application and demand from industries such as electronics, energy, aerospace, and defense majorly drive the demand for nanotubes.
Nanotubes Market Trends
Electronics and Semiconductor Segment to Dominate the Market Demand
- Nanotubes find extensive application in the electronics industry, for the development of faster, more efficient, and more durable electronic devices.
- Among all the types of nanotubes, carbon nanotubes lead the market demand due to their applications in the electronics industry. Apart from carbon nanotubes, silicon nanotubes, and inorganic nanotubes are also used in the electronics industry.
- Carbon nanotubes find application in displays, large area surface conduction, color field emission displays, sensors, backlights for displays, traveling wave tubes, transistors, photovoltaics, conductive additives for non-display applications, photonics, radio-frequency identification (RFID) tags, neutron, and gamma-ray sources, and lighting devices.
- Silicon nanotubes contain hydrogen molecules and act like metal fuels. Thus, they are widely used for semiconductor applications in the electronics industry.
- Inorganic nanotubes are also used in the electronics industry for application in semiconductor devices, sensors, biosensors, nano-motors, and flat panel displays. Hence, owing to the diversified application of nanotubes in several electronic components, the demand for nanotubes is expected to increase.
- The increasing usage and widening arena of application in the electrical and electronics industry is expected to drive market growth.
- For instance, according to the Japan Electronics and Information Technology Industries Association (JEITA), the production by the global electronics and IT industry was estimated at USD 3,436.8 billion in 2022, registering a growth rate of 1% year on year, compared to USD 3,415.9 billion in 2021. Moreover, the industry is expected to reach USD 3,526.6 billion, with a growth rate of 3% year on year in 2023.
- According to the Semiconductor Industry Association (SIA), the global semiconductor industry sales totaled USD 574.1 billion in 2022, registering an increase of 3.3% compared to 2021 with USD 555.9 billion.
- Furthermore, on a regional basis, sales into the Americas market saw the largest increase (16.2%) in 2022. China remained the largest individual market for semiconductors, with sales there totaling USD 180.4 billion in 2022, a decrease of 6.2% compared to 2021. Moreover, annual sales also increased in 2022 in Europe (12.8%) and Japan (10.2%).
- This growth is expected to increase the demand for nanotubes for electronic applications in the region during the forecast period.
Asia-Pacific Region to Dominate the Market
- Asia-Pacific region dominated the global market share due to the increasing demand from industries such as electronics, energy, healthcare, aerospace and defense, and automotive.
- Japan is one of the largest producers of electronics; as per the Japan Electronics and Information Technology Industries Association (JEITA), the domestic production by the Japanese electronics industry was estimated at JPY 11,124.3 billion (USD 85.19 billion) in 2022, witnessing a growth rate of 2% compared to the previous year. The domestic production by the Japanese electronics industry is likely to reach JPY 11,402.9 billion (USD 87.32 billion) by 2023, registering a growth rate of 3% year-on-year.
- Moreover, according to the Ministry of Electronics and Information Technology, the production value of consumer electronics (TV, accessories, and audio) across India was above INR 745 billion (USD 9.46 billion) in fiscal year 2022. Thus supporting the growth of the market.
- Additionally, The Civil Aviation Administration of China (CAAC) has estimated the aviation sector to recover domestic traffic to around 85% of pre-pandemic levels. According to the Boeing Commercial Outlook 2023-2042, in China, around 8,560 new deliveries will be made by 2042, and the market service value will account for USD 675 billion by 2042. Owing to such new deliveries in the country, the demand for nanotubes in the aircraft sector will likely rise.
- Moreover, the market growth is further boosted by the growing automotive industry in the Asia-Pacific region. Developing countries such as China, India, Japan, and South Korea have been working hard to strengthen the manufacturing base and develop efficient supply chains for greater profitability in vehicle manufacturing.
- The Chinese government policy developments include the restriction of investments in new ICE-vehicle manufacturing plants and a proposal to tighten the average fuel economy of its light-duty passenger vehicle fleet by 2025.
- In addition, according to the Society of Indian Automobile Manufacturers (SIAM), a total of 3.79 million passenger vehicles were sold in India in 2022, witnessing a growth rate of around 23% compared to the passenger vehicles sold in the year 2021.
- Additionally, The Civil Aviation Administration of China (CAAC) has estimated the aviation sector to recover domestic traffic to around 85% of pre-pandemic levels. According to the Boeing Commercial Outlook 2023-2042, in China, around 8,560 new deliveries will be made by 2042, and the market service value will account for USD 675 billion by 2042.
- Hence, the trends above are expected to drive the demand for nanotubes in the region during the forecast period.
Nanotubes Industry Overview
The nanotubes market is fragmented in nature. The major players in the studied market (not in any particular order) include Arkema, Hyperion Catalysis International, Jiangsu Cnano Technology Co., Ltd, Resonac Holdings Corporation, and LG Chem, among others.
Additional Benefits:
- The market estimate (ME) sheet in Excel format
- 3 months of analyst support
TABLE OF CONTENTS
1 INTRODUCTION
- 1.1 Study Assumptions
- 1.2 Scope of the Study
2 RESEARCH METHODOLOGY
3 EXECUTIVE SUMMARY
4 MARKET DYNAMICS
- 4.1 Drivers
- 4.1.1 Advancement in Nanotubes Technologies
- 4.1.2 Growing Adoption of Carbon Nanotubes
- 4.1.3 Other Drivers
- 4.2 Restraints
- 4.2.1 High Manufacturing and R&D Cost
- 4.2.2 Other Restraints
- 4.3 Industry Value Chain Analysis
- 4.4 Porter's Five Forces Analysis
- 4.4.1 Bargaining Power of Suppliers
- 4.4.2 Bargaining Power of Buyers
- 4.4.3 Threat of Substitute Products and Services
- 4.4.4 Threat of New Entrants
- 4.4.5 Degree of Competition
5 MARKET SEGMENTATION (Market Size in Value)
- 5.1 Type
- 5.1.1 Carbon Nanotubes
- 5.1.2 Silicon Nanotubes
- 5.1.3 Inorganic Nanotubes
- 5.1.4 Other Types (Membrane Nanotubes, Etc.)
- 5.2 Structure Type
- 5.2.1 Non-polymer Organic Nanomaterials
- 5.2.2 Polymeric Nanomaterials
- 5.3 Application
- 5.3.1 Hydrogen Storage Devices
- 5.3.2 Sensors
- 5.3.3 Polymeric Biomaterials
- 5.3.4 Li-ion Batteries
- 5.3.5 Luminescent Display Devices
- 5.3.6 Biosensors
- 5.3.7 Nanoelectrodes
- 5.3.8 Water Purification Filters
- 5.3.9 Semiconductor Devices
- 5.3.10 Conductive Plastics
- 5.4 End-user Industry
- 5.4.1 Healthcare
- 5.4.2 Electronics
- 5.4.3 Energy
- 5.4.4 Automotive
- 5.4.5 Aerospace and Defense
- 5.4.6 Textile
- 5.4.7 Other End-user Industries (Chemical Materials, Etc.)
- 5.5 Geography
- 5.5.1 Asia-Pacific
- 5.5.1.1 China
- 5.5.1.2 India
- 5.5.1.3 Japan
- 5.5.1.4 South Korea
- 5.5.1.5 Rest of Asia-Pacific
- 5.5.2 North America
- 5.5.2.1 United States
- 5.5.2.2 Canada
- 5.5.2.3 Mexico
- 5.5.3 Europe
- 5.5.3.1 Germany
- 5.5.3.2 United Kingdom
- 5.5.3.3 France
- 5.5.3.4 Italy
- 5.5.3.5 Rest of Europe
- 5.5.4 South America
- 5.5.4.1 Brazil
- 5.5.4.2 Argentina
- 5.5.4.3 Rest of South America
- 5.5.5 Middle-East and Africa
- 5.5.5.1 Saudi Arabia
- 5.5.5.2 South Africa
- 5.5.5.3 Rest of Middle-East and Africa
- 5.5.1 Asia-Pacific
6 COMPETITIVE LANDSCAPE
- 6.1 Mergers and Acquisitions, Joint Ventures, Collaborations, and Agreements
- 6.2 Market Share (%)**/Ranking Analysis
- 6.3 Strategies Adopted by Leading Players
- 6.4 Company Profiles
- 6.4.1 Arkema
- 6.4.2 Carbon Solutions Inc.
- 6.4.3 Cheap Tubes
- 6.4.4 Hyperion Catalysis International
- 6.4.5 Jiangsu Cnano Technology Co., Ltd.
- 6.4.6 Nano-C
- 6.4.7 Nanocyl SA (Birla Carbon)
- 6.4.8 NanoIntegris Inc.
- 6.4.9 Nanoshel LLC
- 6.4.10 Resonac Holdings Corporation
- 6.4.11 Thomas Swan & Co. Ltd
- 6.4.12 LG Chem
7 MARKET OPPORTUNITIES AND FUTURE TRENDS
- 7.1 Rising Potential Uses in Electronic and Storage Devices
- 7.2 Other Opportunities
