|
|
市場調査レポート
商品コード
1801590
コロンにおけるAIの世界市場、2025年~2029年Global AI in Cologne Market 2025-2029 |
||||||

|
|||||||
カスタマイズ可能
|
|||||||

| コロンにおけるAIの世界市場、2025年~2029年 |
|
出版日: 2025年08月23日
発行: TechNavio
ページ情報: 英文 245 Pages
納期: 即納可能
|

全表示
- 概要
- 図表
- 目次
コロンにおけるAI市場は2024年から2029年に1,812億9,670万米ドルとなり、予測期間中のCAGRは44.1%で成長すると予測されます。
当レポートでは、コロンにおけるAI市場の全体的な分析、市場規模・予測、動向、成長促進要因、課題、約25のベンダーを網羅したベンダー分析などを掲載しています。
現在の市場シナリオ、最新動向と促進要因、市場環境全体に関する最新分析を提供しています。市場は、超パーソナライゼーションとカスタマイズに対する消費者需要の急増、AI技術とデータ分析機能の進歩、研究開発の効率化と持続可能性への要請によって牽引されています。
| 市場範囲 | |
|---|---|
| 基準年 | 2025年 |
| 終了年 | 2029年 |
| 予測期間 | 2025年~2029年 |
| 成長モメンタム | 加速 |
| 前年比 | 33.9% |
| CAGR | 44.1% |
| 増分額 | 1,812億9,670万米ドル |
本調査は、業界の主要参加者からのインプットを含め、一次情報と二次情報を客観的に組み合わせて実施しました。レポートには、主要企業の分析に加え、包括的な市場規模データ、地域分析によるセグメント、ベンダー情勢が含まれています。レポートには実績データと予測データがあります。
本調査では、今後数年間のコロンにおけるAI市場の成長を促進する主な理由の1つとして、機能性フレグランスと「香りとしての健康」の台頭を挙げています。また、クリエイティブおよびマーケティングプロセスにおけるジェネレーティブAIの普及、デジタル嗅覚および香りのデジタル化プラットフォームの出現は、市場の大きな需要につながります。
目次
第1章 エグゼクティブサマリー
- 市場概要
第2章 Technavio分析
- 価格感度・ライフサイクル・顧客購入バスケット・採用率・購入基準の分析
- インプットの重要性と差別化の要因
- 混乱の要因
- 促進要因と課題の影響
第3章 市場情勢
- 市場エコシステム
- 市場の特徴
- バリューチェーン分析
第4章 市場規模
- 市場の定義
- 市場セグメント分析
- 市場規模、2024年
- 市場の見通し、2024年~2029年
第5章 市場規模実績
- コロンにおけるAIの世界市場、2019年~2023年
- 技術セグメント分析、2019年~2023年
- エンドユーザーセグメント分析、2019年~2023年
- セクターセグメント分析、2019年~2023年
- 地域別セグメント分析、2019年~2023年
- 国別セグメント分析、2019年~2023年
第6章 ファイブフォース分析
- ファイブフォースの要約
- 買い手の交渉力
- 供給企業の交渉力
- 新規参入業者の脅威
- 代替品の脅威
- 競争の脅威
- 市況
第7章 市場セグメンテーション:技術別
- 市場セグメント
- 比較:技術別
- 機械学習:市場規模と予測、2024年~2029年
- コンピュータービジョン:市場規模と予測、2024年~2029年
- 自然言語処理:市場規模と予測、2024年~2029年
- 自律・センサー技術:市場規模と予測、2024年~2029年
- その他:市場規模と予測、2024年~2029年
- 市場機会:技術別
第8章 市場セグメンテーション:エンドユーザー別
- 市場セグメント
- 比較:エンドユーザー別
- 製造業:市場規模と予測、2024年~2029年
- ヘルスケア:市場規模と予測、2024年~2029年
- 自動車:市場規模と予測、2024年~2029年
- 小売り:市場規模と予測、2024年~2029年
- その他:市場規模と予測、2024年~2029年
- 市場機会:エンドユーザー別
第9章 市場セグメンテーション:セクター別
- 市場セグメント
- 比較:セクター別
- 大企業:市場規模と予測、2024年~2029年
- 中小企業:市場規模と予測、2024年~2029年
- 市場機会:セクター別
第10章 顧客情勢
- 顧客情勢の概要
第11章 地域別情勢
- 地域別セグメンテーション
- 地域別比較
- アジア太平洋:市場規模と予測、2024年~2029年
- 北米:市場規模と予測、2024年~2029年
- 欧州:市場規模と予測、2024年~2029年
- 中東・アフリカ:市場規模と予測、2024年~2029年
- 南米:市場規模と予測、2024年~2029年
- 米国:市場規模と予測、2024年~2029年
- 中国:市場規模と予測、2024年~2029年
- 日本:市場規模と予測、2024年~2029年
- インド:市場規模と予測、2024年~2029年
- ドイツ:市場規模と予測、2024年~2029年
- 韓国:市場規模と予測、2024年~2029年
- フランス:市場規模と予測、2024年~2029年
- オーストラリア:市場規模と予測、2024年~2029年
- カナダ:市場規模と予測、2024年~2029年
- 英国:市場規模と予測、2024年~2029年
- 市場機会:地域情勢別
第12章 促進要因・課題・機会・抑制要因
- 市場促進要因
- 市場の課題
- 促進要因と課題の影響
- 市場の機会・抑制要因
第13章 競合情勢
- 概要
- 競合情勢
- 混乱の状況
- 業界のリスク
第14章 競合分析
- 企業プロファイル
- 企業ランキング指数
- 企業の市場ポジショニング
- Aryballe Technologies SAS
- Coty Inc.
- DSM-Firmenich AG
- EveryHuman
- Future Society Inc.
- Givaudan SA
- International Flavors and Fragrances Inc.
- LOreal SA
- Noteworthy Scents Inc.
- O BOTICARIO FRANCHISING LtdA.
- Osmo
- Scentronix LLC
- Symrise Group
- Takasago International Corp.
- The Procter and Gamble Co.
第15章 付録
Exhibits:
- Exhibits1: Executive Summary - Chart on Market Overview
- Exhibits2: Executive Summary - Data Table on Market Overview
- Exhibits3: Executive Summary - Chart on Global Market Characteristics
- Exhibits4: Executive Summary - Chart on Market By Geographical Landscape
- Exhibits5: Executive Summary - Chart on Market Segmentation by Technology
- Exhibits6: Executive Summary - Chart on Market Segmentation by End-user
- Exhibits7: Executive Summary - Chart on Market Segmentation by Sector
- Exhibits8: Executive Summary - Chart on Incremental Growth
- Exhibits9: Executive Summary - Data Table on Incremental Growth
- Exhibits10: Executive Summary - Chart on Company Market Positioning
- Exhibits11: Analysis of price sensitivity, lifecycle, customer purchase basket, adoption rates, and purchase criteria
- Exhibits12: Overview on criticality of inputs and factors of differentiation
- Exhibits13: Overview on factors of disruption
- Exhibits14: Impact of drivers and challenges in 2024 and 2029
- Exhibits15: Parent Market
- Exhibits16: Data Table on - Parent Market
- Exhibits17: Market characteristics analysis
- Exhibits18: Value chain analysis
- Exhibits19: Offerings of companies included in the market definition
- Exhibits20: Market segments
- Exhibits21: Chart on Global - Market size and forecast 2024-2029 ($ million)
- Exhibits22: Data Table on Global - Market size and forecast 2024-2029 ($ million)
- Exhibits23: Chart on Global Market: Year-over-year growth 2024-2029 (%)
- Exhibits24: Data Table on Global Market: Year-over-year growth 2024-2029 (%)
- Exhibits25: Historic Market Size - Data Table on Global AI In Cologne Market 2019 - 2023 ($ million)
- Exhibits26: Historic Market Size - Technology Segment 2019 - 2023 ($ million)
- Exhibits27: Historic Market Size - End-user Segment 2019 - 2023 ($ million)
- Exhibits28: Historic Market Size - Sector Segment 2019 - 2023 ($ million)
- Exhibits29: Historic Market Size - Geography Segment 2019 - 2023 ($ million)
- Exhibits30: Historic Market Size - Country Segment 2019 - 2023 ($ million)
- Exhibits31: Five forces analysis - Comparison between 2024 and 2029
- Exhibits32: Bargaining power of buyers - Impact of key factors 2024 and 2029
- Exhibits33: Bargaining power of suppliers - Impact of key factors in 2024 and 2029
- Exhibits34: Threat of new entrants - Impact of key factors in 2024 and 2029
- Exhibits35: Threat of substitutes - Impact of key factors in 2024 and 2029
- Exhibits36: Threat of rivalry - Impact of key factors in 2024 and 2029
- Exhibits37: Chart on Market condition - Five forces 2024 and 2029
- Exhibits38: Chart on Technology - Market share 2024-2029 (%)
- Exhibits39: Data Table on Technology - Market share 2024-2029 (%)
- Exhibits40: Chart on Comparison by Technology
- Exhibits41: Data Table on Comparison by Technology
- Exhibits42: Chart on Machine learning - Market size and forecast 2024-2029 ($ million)
- Exhibits43: Data Table on Machine learning - Market size and forecast 2024-2029 ($ million)
- Exhibits44: Chart on Machine learning - Year-over-year growth 2024-2029 (%)
- Exhibits45: Data Table on Machine learning - Year-over-year growth 2024-2029 (%)
- Exhibits46: Chart on Computer vision - Market size and forecast 2024-2029 ($ million)
- Exhibits47: Data Table on Computer vision - Market size and forecast 2024-2029 ($ million)
- Exhibits48: Chart on Computer vision - Year-over-year growth 2024-2029 (%)
- Exhibits49: Data Table on Computer vision - Year-over-year growth 2024-2029 (%)
- Exhibits50: Chart on Natural language processing - Market size and forecast 2024-2029 ($ million)
- Exhibits51: Data Table on Natural language processing - Market size and forecast 2024-2029 ($ million)
- Exhibits52: Chart on Natural language processing - Year-over-year growth 2024-2029 (%)
- Exhibits53: Data Table on Natural language processing - Year-over-year growth 2024-2029 (%)
- Exhibits54: Chart on Autonomous and sensor technology - Market size and forecast 2024-2029 ($ million)
- Exhibits55: Data Table on Autonomous and sensor technology - Market size and forecast 2024-2029 ($ million)
- Exhibits56: Chart on Autonomous and sensor technology - Year-over-year growth 2024-2029 (%)
- Exhibits57: Data Table on Autonomous and sensor technology - Year-over-year growth 2024-2029 (%)
- Exhibits58: Chart on Others - Market size and forecast 2024-2029 ($ million)
- Exhibits59: Data Table on Others - Market size and forecast 2024-2029 ($ million)
- Exhibits60: Chart on Others - Year-over-year growth 2024-2029 (%)
- Exhibits61: Data Table on Others - Year-over-year growth 2024-2029 (%)
- Exhibits62: Market opportunity by Technology ($ million)
- Exhibits63: Data Table on Market opportunity by Technology ($ million)
- Exhibits64: Chart on End-user - Market share 2024-2029 (%)
- Exhibits65: Data Table on End-user - Market share 2024-2029 (%)
- Exhibits66: Chart on Comparison by End-user
- Exhibits67: Data Table on Comparison by End-user
- Exhibits68: Chart on Manufacturing - Market size and forecast 2024-2029 ($ million)
- Exhibits69: Data Table on Manufacturing - Market size and forecast 2024-2029 ($ million)
- Exhibits70: Chart on Manufacturing - Year-over-year growth 2024-2029 (%)
- Exhibits71: Data Table on Manufacturing - Year-over-year growth 2024-2029 (%)
- Exhibits72: Chart on Healthcare - Market size and forecast 2024-2029 ($ million)
- Exhibits73: Data Table on Healthcare - Market size and forecast 2024-2029 ($ million)
- Exhibits74: Chart on Healthcare - Year-over-year growth 2024-2029 (%)
- Exhibits75: Data Table on Healthcare - Year-over-year growth 2024-2029 (%)
- Exhibits76: Chart on Automotive - Market size and forecast 2024-2029 ($ million)
- Exhibits77: Data Table on Automotive - Market size and forecast 2024-2029 ($ million)
- Exhibits78: Chart on Automotive - Year-over-year growth 2024-2029 (%)
- Exhibits79: Data Table on Automotive - Year-over-year growth 2024-2029 (%)
- Exhibits80: Chart on Retail - Market size and forecast 2024-2029 ($ million)
- Exhibits81: Data Table on Retail - Market size and forecast 2024-2029 ($ million)
- Exhibits82: Chart on Retail - Year-over-year growth 2024-2029 (%)
- Exhibits83: Data Table on Retail - Year-over-year growth 2024-2029 (%)
- Exhibits84: Chart on Others - Market size and forecast 2024-2029 ($ million)
- Exhibits85: Data Table on Others - Market size and forecast 2024-2029 ($ million)
- Exhibits86: Chart on Others - Year-over-year growth 2024-2029 (%)
- Exhibits87: Data Table on Others - Year-over-year growth 2024-2029 (%)
- Exhibits88: Market opportunity by End-user ($ million)
- Exhibits89: Data Table on Market opportunity by End-user ($ million)
- Exhibits90: Chart on Sector - Market share 2024-2029 (%)
- Exhibits91: Data Table on Sector - Market share 2024-2029 (%)
- Exhibits92: Chart on Comparison by Sector
- Exhibits93: Data Table on Comparison by Sector
- Exhibits94: Chart on Large enterprises - Market size and forecast 2024-2029 ($ million)
- Exhibits95: Data Table on Large enterprises - Market size and forecast 2024-2029 ($ million)
- Exhibits96: Chart on Large enterprises - Year-over-year growth 2024-2029 (%)
- Exhibits97: Data Table on Large enterprises - Year-over-year growth 2024-2029 (%)
- Exhibits98: Chart on SMEs - Market size and forecast 2024-2029 ($ million)
- Exhibits99: Data Table on SMEs - Market size and forecast 2024-2029 ($ million)
- Exhibits100: Chart on SMEs - Year-over-year growth 2024-2029 (%)
- Exhibits101: Data Table on SMEs - Year-over-year growth 2024-2029 (%)
- Exhibits102: Market opportunity by Sector ($ million)
- Exhibits103: Data Table on Market opportunity by Sector ($ million)
- Exhibits104: Analysis of price sensitivity, lifecycle, customer purchase basket, adoption rates, and purchase criteria
- Exhibits105: Chart on Market share By Geographical Landscape 2024-2029 (%)
- Exhibits106: Data Table on Market share By Geographical Landscape 2024-2029 (%)
- Exhibits107: Chart on Geographic comparison
- Exhibits108: Data Table on Geographic comparison
- Exhibits109: Chart on APAC - Market size and forecast 2024-2029 ($ million)
- Exhibits110: Data Table on APAC - Market size and forecast 2024-2029 ($ million)
- Exhibits111: Chart on APAC - Year-over-year growth 2024-2029 (%)
- Exhibits112: Data Table on APAC - Year-over-year growth 2024-2029 (%)
- Exhibits113: Chart on North America - Market size and forecast 2024-2029 ($ million)
- Exhibits114: Data Table on North America - Market size and forecast 2024-2029 ($ million)
- Exhibits115: Chart on North America - Year-over-year growth 2024-2029 (%)
- Exhibits116: Data Table on North America - Year-over-year growth 2024-2029 (%)
- Exhibits117: Chart on Europe - Market size and forecast 2024-2029 ($ million)
- Exhibits118: Data Table on Europe - Market size and forecast 2024-2029 ($ million)
- Exhibits119: Chart on Europe - Year-over-year growth 2024-2029 (%)
- Exhibits120: Data Table on Europe - Year-over-year growth 2024-2029 (%)
- Exhibits121: Chart on Middle East and Africa - Market size and forecast 2024-2029 ($ million)
- Exhibits122: Data Table on Middle East and Africa - Market size and forecast 2024-2029 ($ million)
- Exhibits123: Chart on Middle East and Africa - Year-over-year growth 2024-2029 (%)
- Exhibits124: Data Table on Middle East and Africa - Year-over-year growth 2024-2029 (%)
- Exhibits125: Chart on South America - Market size and forecast 2024-2029 ($ million)
- Exhibits126: Data Table on South America - Market size and forecast 2024-2029 ($ million)
- Exhibits127: Chart on South America - Year-over-year growth 2024-2029 (%)
- Exhibits128: Data Table on South America - Year-over-year growth 2024-2029 (%)
- Exhibits129: Chart on US - Market size and forecast 2024-2029 ($ million)
- Exhibits130: Data Table on US - Market size and forecast 2024-2029 ($ million)
- Exhibits131: Chart on US - Year-over-year growth 2024-2029 (%)
- Exhibits132: Data Table on US - Year-over-year growth 2024-2029 (%)
- Exhibits133: Chart on China - Market size and forecast 2024-2029 ($ million)
- Exhibits134: Data Table on China - Market size and forecast 2024-2029 ($ million)
- Exhibits135: Chart on China - Year-over-year growth 2024-2029 (%)
- Exhibits136: Data Table on China - Year-over-year growth 2024-2029 (%)
- Exhibits137: Chart on Japan - Market size and forecast 2024-2029 ($ million)
- Exhibits138: Data Table on Japan - Market size and forecast 2024-2029 ($ million)
- Exhibits139: Chart on Japan - Year-over-year growth 2024-2029 (%)
- Exhibits140: Data Table on Japan - Year-over-year growth 2024-2029 (%)
- Exhibits141: Chart on India - Market size and forecast 2024-2029 ($ million)
- Exhibits142: Data Table on India - Market size and forecast 2024-2029 ($ million)
- Exhibits143: Chart on India - Year-over-year growth 2024-2029 (%)
- Exhibits144: Data Table on India - Year-over-year growth 2024-2029 (%)
- Exhibits145: Chart on Germany - Market size and forecast 2024-2029 ($ million)
- Exhibits146: Data Table on Germany - Market size and forecast 2024-2029 ($ million)
- Exhibits147: Chart on Germany - Year-over-year growth 2024-2029 (%)
- Exhibits148: Data Table on Germany - Year-over-year growth 2024-2029 (%)
- Exhibits149: Chart on South Korea - Market size and forecast 2024-2029 ($ million)
- Exhibits150: Data Table on South Korea - Market size and forecast 2024-2029 ($ million)
- Exhibits151: Chart on South Korea - Year-over-year growth 2024-2029 (%)
- Exhibits152: Data Table on South Korea - Year-over-year growth 2024-2029 (%)
- Exhibits153: Chart on France - Market size and forecast 2024-2029 ($ million)
- Exhibits154: Data Table on France - Market size and forecast 2024-2029 ($ million)
- Exhibits155: Chart on France - Year-over-year growth 2024-2029 (%)
- Exhibits156: Data Table on France - Year-over-year growth 2024-2029 (%)
- Exhibits157: Chart on Australia - Market size and forecast 2024-2029 ($ million)
- Exhibits158: Data Table on Australia - Market size and forecast 2024-2029 ($ million)
- Exhibits159: Chart on Australia - Year-over-year growth 2024-2029 (%)
- Exhibits160: Data Table on Australia - Year-over-year growth 2024-2029 (%)
- Exhibits161: Chart on Canada - Market size and forecast 2024-2029 ($ million)
- Exhibits162: Data Table on Canada - Market size and forecast 2024-2029 ($ million)
- Exhibits163: Chart on Canada - Year-over-year growth 2024-2029 (%)
- Exhibits164: Data Table on Canada - Year-over-year growth 2024-2029 (%)
- Exhibits165: Chart on UK - Market size and forecast 2024-2029 ($ million)
- Exhibits166: Data Table on UK - Market size and forecast 2024-2029 ($ million)
- Exhibits167: Chart on UK - Year-over-year growth 2024-2029 (%)
- Exhibits168: Data Table on UK - Year-over-year growth 2024-2029 (%)
- Exhibits169: Market opportunity By Geographical Landscape ($ million)
- Exhibits170: Data Tables on Market opportunity By Geographical Landscape ($ million)
- Exhibits171: Impact of drivers and challenges in 2024 and 2029
- Exhibits172: Overview on criticality of inputs and factors of differentiation
- Exhibits173: Overview on factors of disruption
- Exhibits174: Impact of key risks on business
- Exhibits175: Companies covered
- Exhibits176: Company ranking index
- Exhibits177: Matrix on companies position and classification
- Exhibits178: Aryballe Technologies SAS - Overview
- Exhibits179: Aryballe Technologies SAS - Product / Service
- Exhibits180: Aryballe Technologies SAS - Key offerings
- Exhibits181: SWOT
- Exhibits182: Coty Inc. - Overview
- Exhibits183: Coty Inc. - Business segments
- Exhibits184: Coty Inc. - Key news
- Exhibits185: Coty Inc. - Key offerings
- Exhibits186: Coty Inc. - Segment focus
- Exhibits187: SWOT
- Exhibits188: DSM-Firmenich AG - Overview
- Exhibits189: DSM-Firmenich AG - Product / Service
- Exhibits190: DSM-Firmenich AG - Key offerings
- Exhibits191: SWOT
- Exhibits192: EveryHuman - Overview
- Exhibits193: EveryHuman - Product / Service
- Exhibits194: EveryHuman - Key offerings
- Exhibits195: SWOT
- Exhibits196: Future Society Inc. - Overview
- Exhibits197: Future Society Inc. - Product / Service
- Exhibits198: Future Society Inc. - Key offerings
- Exhibits199: SWOT
- Exhibits200: Givaudan SA - Overview
- Exhibits201: Givaudan SA - Business segments
- Exhibits202: Givaudan SA - Key news
- Exhibits203: Givaudan SA - Key offerings
- Exhibits204: Givaudan SA - Segment focus
- Exhibits205: SWOT
- Exhibits206: International Flavors and Fragrances Inc. - Overview
- Exhibits207: International Flavors and Fragrances Inc. - Business segments
- Exhibits208: International Flavors and Fragrances Inc. - Key news
- Exhibits209: International Flavors and Fragrances Inc. - Key offerings
- Exhibits210: International Flavors and Fragrances Inc. - Segment focus
- Exhibits211: SWOT
- Exhibits212: LOreal SA - Overview
- Exhibits213: LOreal SA - Business segments
- Exhibits214: LOreal SA - Key news
- Exhibits215: LOreal SA - Key offerings
- Exhibits216: LOreal SA - Segment focus
- Exhibits217: SWOT
- Exhibits218: Noteworthy Scents Inc. - Overview
- Exhibits219: Noteworthy Scents Inc. - Product / Service
- Exhibits220: Noteworthy Scents Inc. - Key offerings
- Exhibits221: SWOT
- Exhibits222: O BOTICARIO FRANCHISING LtdA. - Overview
- Exhibits223: O BOTICARIO FRANCHISING LtdA. - Product / Service
- Exhibits224: O BOTICARIO FRANCHISING LtdA. - Key offerings
- Exhibits225: SWOT
- Exhibits226: Osmo - Overview
- Exhibits227: Osmo - Product / Service
- Exhibits228: Osmo - Key offerings
- Exhibits229: SWOT
- Exhibits230: Scentronix LLC - Overview
- Exhibits231: Scentronix LLC - Product / Service
- Exhibits232: Scentronix LLC - Key offerings
- Exhibits233: SWOT
- Exhibits234: Symrise Group - Overview
- Exhibits235: Symrise Group - Business segments
- Exhibits236: Symrise Group - Key news
- Exhibits237: Symrise Group - Key offerings
- Exhibits238: Symrise Group - Segment focus
- Exhibits239: SWOT
- Exhibits240: Takasago International Corp. - Overview
- Exhibits241: Takasago International Corp. - Business segments
- Exhibits242: Takasago International Corp. - Key news
- Exhibits243: Takasago International Corp. - Key offerings
- Exhibits244: Takasago International Corp. - Segment focus
- Exhibits245: SWOT
- Exhibits246: The Procter and Gamble Co. - Overview
- Exhibits247: The Procter and Gamble Co. - Business segments
- Exhibits248: The Procter and Gamble Co. - Key offerings
- Exhibits249: The Procter and Gamble Co. - Segment focus
- Exhibits250: SWOT
- Exhibits251: Inclusions checklist
- Exhibits252: Exclusions checklist
- Exhibits253: Currency conversion rates for US$
- Exhibits254: Research methodology
- Exhibits255: Information sources
- Exhibits256: Data validation
- Exhibits257: Validation techniques employed for market sizing
- Exhibits258: Data synthesis
- Exhibits259: 360 degree market analysis
- Exhibits260: List of abbreviations
The AI in cologne market is forecasted to grow by USD 181,296.7 mn during 2024-2029, accelerating at a CAGR of 44.1% during the forecast period. The report on the AI in cologne market provides a holistic analysis, market size and forecast, trends, growth drivers, and challenges, as well as vendor analysis covering around 25 vendors.
The report offers an up-to-date analysis regarding the current market scenario, the latest trends and drivers, and the overall market environment. The market is driven by surging consumer demand for hyper-personalization and customization, advancements in AI technology and data analytics capabilities, and imperative for research and development efficiency and sustainability.
| Market Scope | |
|---|---|
| Base Year | 2025 |
| End Year | 2029 |
| Series Year | 2025-2029 |
| Growth Momentum | Accelerate |
| YOY 2025 | 33.9% |
| CAGR | 44.1% |
| Incremental Value | $181,296.7 mn |
The study was conducted using an objective combination of primary and secondary information including inputs from key participants in the industry. The report contains a comprehensive market size data, segment with regional analysis and vendor landscape in addition to an analysis of the key companies. Reports have historic and forecast data.
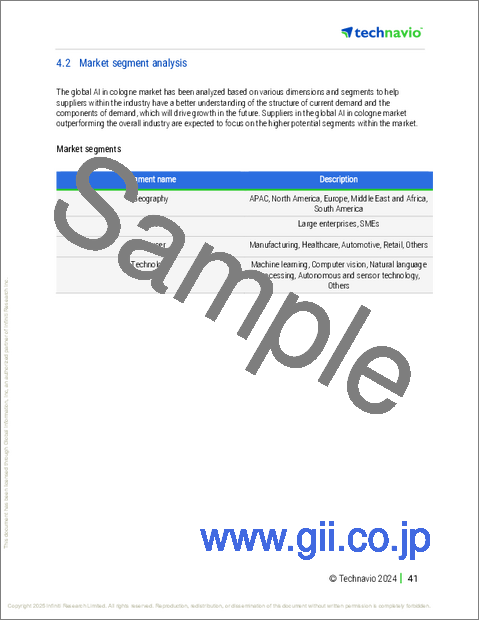
Technavio's AI in cologne market is segmented as below:
By Technology
- Machine learning
- Computer vision
- Natural language processing
- Autonomous and sensor technology
- Others
By End-user
- Manufacturing
- Healthcare
- Automotive
- Retail
- Others
By Sector
- Large enterprises
- SMEs
By Geographical Landscape
- APAC
- North America
- Europe
- Middle East and Africa
- South America
This study identifies the rise of functional fragrances and scent-as-wellness as one of the prime reasons driving the AI in cologne market growth during the next few years. Also, proliferation of generative AI in creative and marketing processes and emergence of digital olfaction and scent digitization platforms will lead to sizable demand in the market.
The report on the AI in cologne market covers the following areas:
- AI In Cologne Market sizing
- AI In Cologne Market forecast
- AI In Cologne Market industry analysis
The robust vendor analysis is designed to help clients improve their market position, and in line with this, this report provides a detailed analysis of several leading AI in cologne market vendors that include Aryballe Technologies SAS, Coty Inc., DSM-Firmenich AG, EveryHuman, Future Society Inc., Givaudan SA, International Flavors and Fragrances Inc., LOreal SA, Moodify, NOS EMOTIONTECH, Noteworthy Scents Inc., O BOTICARIO FRANCHISING LtdA., Osmo, Scentgenie, Scentronix LLC, Sensory Design and Technology Ltd., Symrise Group, Takasago International Corp., and The Procter and Gamble Co.. Also, the AI in cologne market analysis report includes information on upcoming trends and challenges that will influence market growth. This is to help companies strategize and leverage all forthcoming growth opportunities.
The publisher presents a detailed picture of the market by the way of study, synthesis, and summation of data from multiple sources by an analysis of key parameters such as profit, pricing, competition, and promotions. It presents various market facets by identifying the key industry influencers. The data presented is comprehensive, reliable, and a result of extensive primary and secondary research. The market research reports provide a complete competitive landscape and an in-depth vendor selection methodology and analysis using qualitative and quantitative research to forecast accurate market growth.
Table of Contents
1 Executive Summary
- 1.1 Market overview
- Executive Summary - Chart on Market Overview
- Executive Summary - Data Table on Market Overview
- Executive Summary - Chart on Global Market Characteristics
- Executive Summary - Chart on Market By Geographical Landscape
- Executive Summary - Chart on Market Segmentation by Technology
- Executive Summary - Chart on Market Segmentation by End-user
- Executive Summary - Chart on Market Segmentation by Sector
- Executive Summary - Chart on Incremental Growth
- Executive Summary - Data Table on Incremental Growth
- Executive Summary - Chart on Company Market Positioning
2 Technavio Analysis
- 2.1 Analysis of price sensitivity, lifecycle, customer purchase basket, adoption rates, and purchase criteria
- Analysis of price sensitivity, lifecycle, customer purchase basket, adoption rates, and purchase criteria
- 2.2 Criticality of inputs and Factors of differentiation
- Overview on criticality of inputs and factors of differentiation
- 2.3 Factors of disruption
- Overview on factors of disruption
- 2.4 Impact of drivers and challenges
- Impact of drivers and challenges in 2024 and 2029
3 Market Landscape
- 3.1 Market ecosystem
- Parent Market
- Data Table on - Parent Market
- 3.2 Market characteristics
- Market characteristics analysis
- 3.3 Value chain analysis
- Value chain analysis
4 Market Sizing
- 4.1 Market definition
- Offerings of companies included in the market definition
- 4.2 Market segment analysis
- Market segments
- 4.3 Market size 2024
- 4.4 Market outlook: Forecast for 2024-2029
- Chart on Global - Market size and forecast 2024-2029 ($ million)
- Data Table on Global - Market size and forecast 2024-2029 ($ million)
- Chart on Global Market: Year-over-year growth 2024-2029 (%)
- Data Table on Global Market: Year-over-year growth 2024-2029 (%)
5 Historic Market Size
- 5.1 Global AI In Cologne Market 2019 - 2023
- Historic Market Size - Data Table on Global AI In Cologne Market 2019 - 2023 ($ million)
- 5.2 Technology segment analysis 2019 - 2023
- Historic Market Size - Technology Segment 2019 - 2023 ($ million)
- 5.3 End-user segment analysis 2019 - 2023
- Historic Market Size - End-user Segment 2019 - 2023 ($ million)
- 5.4 Sector segment analysis 2019 - 2023
- Historic Market Size - Sector Segment 2019 - 2023 ($ million)
- 5.5 Geography segment analysis 2019 - 2023
- Historic Market Size - Geography Segment 2019 - 2023 ($ million)
- 5.6 Country segment analysis 2019 - 2023
- Historic Market Size - Country Segment 2019 - 2023 ($ million)
6 Five Forces Analysis
- 6.1 Five forces summary
- Five forces analysis - Comparison between 2024 and 2029
- 6.2 Bargaining power of buyers
- Bargaining power of buyers - Impact of key factors 2024 and 2029
- 6.3 Bargaining power of suppliers
- Bargaining power of suppliers - Impact of key factors in 2024 and 2029
- 6.4 Threat of new entrants
- Threat of new entrants - Impact of key factors in 2024 and 2029
- 6.5 Threat of substitutes
- Threat of substitutes - Impact of key factors in 2024 and 2029
- 6.6 Threat of rivalry
- Threat of rivalry - Impact of key factors in 2024 and 2029
- 6.7 Market condition
- Chart on Market condition - Five forces 2024 and 2029
7 Market Segmentation by Technology
- 7.1 Market segments
- Chart on Technology - Market share 2024-2029 (%)
- Data Table on Technology - Market share 2024-2029 (%)
- 7.2 Comparison by Technology
- Chart on Comparison by Technology
- Data Table on Comparison by Technology
- 7.3 Machine learning - Market size and forecast 2024-2029
- Chart on Machine learning - Market size and forecast 2024-2029 ($ million)
- Data Table on Machine learning - Market size and forecast 2024-2029 ($ million)
- Chart on Machine learning - Year-over-year growth 2024-2029 (%)
- Data Table on Machine learning - Year-over-year growth 2024-2029 (%)
- 7.4 Computer vision - Market size and forecast 2024-2029
- Chart on Computer vision - Market size and forecast 2024-2029 ($ million)
- Data Table on Computer vision - Market size and forecast 2024-2029 ($ million)
- Chart on Computer vision - Year-over-year growth 2024-2029 (%)
- Data Table on Computer vision - Year-over-year growth 2024-2029 (%)
- 7.5 Natural language processing - Market size and forecast 2024-2029
- Chart on Natural language processing - Market size and forecast 2024-2029 ($ million)
- Data Table on Natural language processing - Market size and forecast 2024-2029 ($ million)
- Chart on Natural language processing - Year-over-year growth 2024-2029 (%)
- Data Table on Natural language processing - Year-over-year growth 2024-2029 (%)
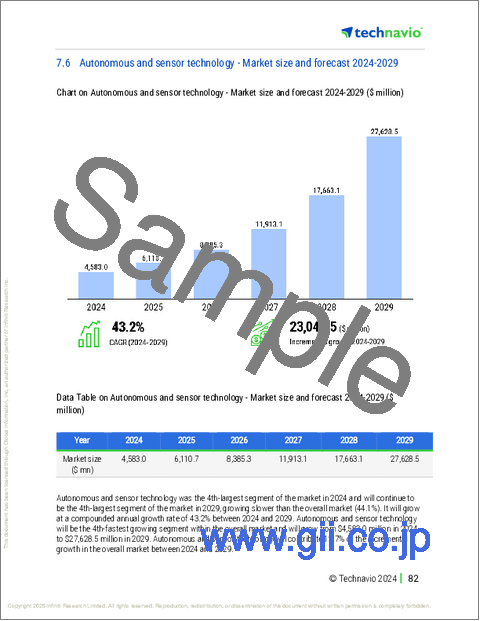
- 7.6 Autonomous and sensor technology - Market size and forecast 2024-2029
- Chart on Autonomous and sensor technology - Market size and forecast 2024-2029 ($ million)
- Data Table on Autonomous and sensor technology - Market size and forecast 2024-2029 ($ million)
- Chart on Autonomous and sensor technology - Year-over-year growth 2024-2029 (%)
- Data Table on Autonomous and sensor technology - Year-over-year growth 2024-2029 (%)
- 7.7 Others - Market size and forecast 2024-2029
- Chart on Others - Market size and forecast 2024-2029 ($ million)
- Data Table on Others - Market size and forecast 2024-2029 ($ million)
- Chart on Others - Year-over-year growth 2024-2029 (%)
- Data Table on Others - Year-over-year growth 2024-2029 (%)
- 7.8 Market opportunity by Technology
- Market opportunity by Technology ($ million)
- Data Table on Market opportunity by Technology ($ million)
8 Market Segmentation by End-user
- 8.1 Market segments
- Chart on End-user - Market share 2024-2029 (%)
- Data Table on End-user - Market share 2024-2029 (%)
- 8.2 Comparison by End-user
- Chart on Comparison by End-user
- Data Table on Comparison by End-user
- 8.3 Manufacturing - Market size and forecast 2024-2029
- Chart on Manufacturing - Market size and forecast 2024-2029 ($ million)
- Data Table on Manufacturing - Market size and forecast 2024-2029 ($ million)
- Chart on Manufacturing - Year-over-year growth 2024-2029 (%)
- Data Table on Manufacturing - Year-over-year growth 2024-2029 (%)
- 8.4 Healthcare - Market size and forecast 2024-2029
- Chart on Healthcare - Market size and forecast 2024-2029 ($ million)
- Data Table on Healthcare - Market size and forecast 2024-2029 ($ million)
- Chart on Healthcare - Year-over-year growth 2024-2029 (%)
- Data Table on Healthcare - Year-over-year growth 2024-2029 (%)
- 8.5 Automotive - Market size and forecast 2024-2029
- Chart on Automotive - Market size and forecast 2024-2029 ($ million)
- Data Table on Automotive - Market size and forecast 2024-2029 ($ million)
- Chart on Automotive - Year-over-year growth 2024-2029 (%)
- Data Table on Automotive - Year-over-year growth 2024-2029 (%)
- 8.6 Retail - Market size and forecast 2024-2029
- Chart on Retail - Market size and forecast 2024-2029 ($ million)
- Data Table on Retail - Market size and forecast 2024-2029 ($ million)
- Chart on Retail - Year-over-year growth 2024-2029 (%)
- Data Table on Retail - Year-over-year growth 2024-2029 (%)
- 8.7 Others - Market size and forecast 2024-2029
- Chart on Others - Market size and forecast 2024-2029 ($ million)
- Data Table on Others - Market size and forecast 2024-2029 ($ million)
- Chart on Others - Year-over-year growth 2024-2029 (%)
- Data Table on Others - Year-over-year growth 2024-2029 (%)
- 8.8 Market opportunity by End-user
- Market opportunity by End-user ($ million)
- Data Table on Market opportunity by End-user ($ million)
9 Market Segmentation by Sector
- 9.1 Market segments
- Chart on Sector - Market share 2024-2029 (%)
- Data Table on Sector - Market share 2024-2029 (%)
- 9.2 Comparison by Sector
- Chart on Comparison by Sector
- Data Table on Comparison by Sector
- 9.3 Large enterprises - Market size and forecast 2024-2029
- Chart on Large enterprises - Market size and forecast 2024-2029 ($ million)
- Data Table on Large enterprises - Market size and forecast 2024-2029 ($ million)
- Chart on Large enterprises - Year-over-year growth 2024-2029 (%)
- Data Table on Large enterprises - Year-over-year growth 2024-2029 (%)
- 9.4 SMEs - Market size and forecast 2024-2029
- Chart on SMEs - Market size and forecast 2024-2029 ($ million)
- Data Table on SMEs - Market size and forecast 2024-2029 ($ million)
- Chart on SMEs - Year-over-year growth 2024-2029 (%)
- Data Table on SMEs - Year-over-year growth 2024-2029 (%)
- 9.5 Market opportunity by Sector
- Market opportunity by Sector ($ million)
- Data Table on Market opportunity by Sector ($ million)
10 Customer Landscape
- 10.1 Customer landscape overview
- Analysis of price sensitivity, lifecycle, customer purchase basket, adoption rates, and purchase criteria
11 Geographic Landscape
- 11.1 Geographic segmentation
- Chart on Market share By Geographical Landscape 2024-2029 (%)
- Data Table on Market share By Geographical Landscape 2024-2029 (%)
- 11.2 Geographic comparison
- Chart on Geographic comparison
- Data Table on Geographic comparison
- 11.3 APAC - Market size and forecast 2024-2029
- Chart on APAC - Market size and forecast 2024-2029 ($ million)
- Data Table on APAC - Market size and forecast 2024-2029 ($ million)
- Chart on APAC - Year-over-year growth 2024-2029 (%)
- Data Table on APAC - Year-over-year growth 2024-2029 (%)
- 11.4 North America - Market size and forecast 2024-2029
- Chart on North America - Market size and forecast 2024-2029 ($ million)
- Data Table on North America - Market size and forecast 2024-2029 ($ million)
- Chart on North America - Year-over-year growth 2024-2029 (%)
- Data Table on North America - Year-over-year growth 2024-2029 (%)
- 11.5 Europe - Market size and forecast 2024-2029
- Chart on Europe - Market size and forecast 2024-2029 ($ million)
- Data Table on Europe - Market size and forecast 2024-2029 ($ million)
- Chart on Europe - Year-over-year growth 2024-2029 (%)
- Data Table on Europe - Year-over-year growth 2024-2029 (%)
- 11.6 Middle East and Africa - Market size and forecast 2024-2029
- Chart on Middle East and Africa - Market size and forecast 2024-2029 ($ million)
- Data Table on Middle East and Africa - Market size and forecast 2024-2029 ($ million)
- Chart on Middle East and Africa - Year-over-year growth 2024-2029 (%)
- Data Table on Middle East and Africa - Year-over-year growth 2024-2029 (%)
- 11.7 South America - Market size and forecast 2024-2029
- Chart on South America - Market size and forecast 2024-2029 ($ million)
- Data Table on South America - Market size and forecast 2024-2029 ($ million)
- Chart on South America - Year-over-year growth 2024-2029 (%)
- Data Table on South America - Year-over-year growth 2024-2029 (%)
- 11.8 US - Market size and forecast 2024-2029
- Chart on US - Market size and forecast 2024-2029 ($ million)
- Data Table on US - Market size and forecast 2024-2029 ($ million)
- Chart on US - Year-over-year growth 2024-2029 (%)
- Data Table on US - Year-over-year growth 2024-2029 (%)
- 11.9 China - Market size and forecast 2024-2029
- Chart on China - Market size and forecast 2024-2029 ($ million)
- Data Table on China - Market size and forecast 2024-2029 ($ million)
- Chart on China - Year-over-year growth 2024-2029 (%)
- Data Table on China - Year-over-year growth 2024-2029 (%)
- 11.10 Japan - Market size and forecast 2024-2029
- Chart on Japan - Market size and forecast 2024-2029 ($ million)
- Data Table on Japan - Market size and forecast 2024-2029 ($ million)
- Chart on Japan - Year-over-year growth 2024-2029 (%)
- Data Table on Japan - Year-over-year growth 2024-2029 (%)
- 11.11 India - Market size and forecast 2024-2029
- Chart on India - Market size and forecast 2024-2029 ($ million)
- Data Table on India - Market size and forecast 2024-2029 ($ million)
- Chart on India - Year-over-year growth 2024-2029 (%)
- Data Table on India - Year-over-year growth 2024-2029 (%)
- 11.12 Germany - Market size and forecast 2024-2029
- Chart on Germany - Market size and forecast 2024-2029 ($ million)
- Data Table on Germany - Market size and forecast 2024-2029 ($ million)
- Chart on Germany - Year-over-year growth 2024-2029 (%)
- Data Table on Germany - Year-over-year growth 2024-2029 (%)
- 11.13 South Korea - Market size and forecast 2024-2029
- Chart on South Korea - Market size and forecast 2024-2029 ($ million)
- Data Table on South Korea - Market size and forecast 2024-2029 ($ million)
- Chart on South Korea - Year-over-year growth 2024-2029 (%)
- Data Table on South Korea - Year-over-year growth 2024-2029 (%)
- 11.14 France - Market size and forecast 2024-2029
- Chart on France - Market size and forecast 2024-2029 ($ million)
- Data Table on France - Market size and forecast 2024-2029 ($ million)
- Chart on France - Year-over-year growth 2024-2029 (%)
- Data Table on France - Year-over-year growth 2024-2029 (%)
- 11.15 Australia - Market size and forecast 2024-2029
- Chart on Australia - Market size and forecast 2024-2029 ($ million)
- Data Table on Australia - Market size and forecast 2024-2029 ($ million)
- Chart on Australia - Year-over-year growth 2024-2029 (%)
- Data Table on Australia - Year-over-year growth 2024-2029 (%)
- 11.16 Canada - Market size and forecast 2024-2029
- Chart on Canada - Market size and forecast 2024-2029 ($ million)
- Data Table on Canada - Market size and forecast 2024-2029 ($ million)
- Chart on Canada - Year-over-year growth 2024-2029 (%)
- Data Table on Canada - Year-over-year growth 2024-2029 (%)
- 11.17 UK - Market size and forecast 2024-2029
- Chart on UK - Market size and forecast 2024-2029 ($ million)
- Data Table on UK - Market size and forecast 2024-2029 ($ million)
- Chart on UK - Year-over-year growth 2024-2029 (%)
- Data Table on UK - Year-over-year growth 2024-2029 (%)
- 11.18 Market opportunity By Geographical Landscape
- Market opportunity By Geographical Landscape ($ million)
- Data Tables on Market opportunity By Geographical Landscape ($ million)
12 Drivers, Challenges, and Opportunity/Restraints
- 12.1 Market drivers
- 12.2 Market challenges
- 12.3 Impact of drivers and challenges
- Impact of drivers and challenges in 2024 and 2029
- 12.4 Market opportunities/restraints
13 Competitive Landscape
- 13.1 Overview
- 13.2 Competitive Landscape
- Overview on criticality of inputs and factors of differentiation
- 13.3 Landscape disruption
- Overview on factors of disruption
- 13.4 Industry risks
- Impact of key risks on business
14 Competitive Analysis
- 14.1 Companies profiled
- Companies covered
- 14.2 Company ranking index
- Company ranking index
- 14.3 Market positioning of companies
- Matrix on companies position and classification
- 14.4 Aryballe Technologies SAS
- Aryballe Technologies SAS - Overview
- Aryballe Technologies SAS - Product / Service
- Aryballe Technologies SAS - Key offerings
- SWOT
- 14.5 Coty Inc.
- Coty Inc. - Overview
- Coty Inc. - Business segments
- Coty Inc. - Key news
- Coty Inc. - Key offerings
- Coty Inc. - Segment focus
- SWOT
- 14.6 DSM-Firmenich AG
- DSM-Firmenich AG - Overview
- DSM-Firmenich AG - Product / Service
- DSM-Firmenich AG - Key offerings
- SWOT
- 14.7 EveryHuman
- EveryHuman - Overview
- EveryHuman - Product / Service
- EveryHuman - Key offerings
- SWOT
- 14.8 Future Society Inc.
- Future Society Inc. - Overview
- Future Society Inc. - Product / Service
- Future Society Inc. - Key offerings
- SWOT
- 14.9 Givaudan SA
- Givaudan SA - Overview
- Givaudan SA - Business segments
- Givaudan SA - Key news
- Givaudan SA - Key offerings
- Givaudan SA - Segment focus
- SWOT
- 14.10 International Flavors and Fragrances Inc.
- International Flavors and Fragrances Inc. - Overview
- International Flavors and Fragrances Inc. - Business segments
- International Flavors and Fragrances Inc. - Key news
- International Flavors and Fragrances Inc. - Key offerings
- International Flavors and Fragrances Inc. - Segment focus
- SWOT
- 14.11 LOreal SA
- LOreal SA - Overview
- LOreal SA - Business segments
- LOreal SA - Key news
- LOreal SA - Key offerings
- LOreal SA - Segment focus
- SWOT
- 14.12 Noteworthy Scents Inc.
- Noteworthy Scents Inc. - Overview
- Noteworthy Scents Inc. - Product / Service
- Noteworthy Scents Inc. - Key offerings
- SWOT
- 14.13 O BOTICARIO FRANCHISING LtdA.
- O BOTICARIO FRANCHISING LtdA. - Overview
- O BOTICARIO FRANCHISING LtdA. - Product / Service
- O BOTICARIO FRANCHISING LtdA. - Key offerings
- SWOT
- 14.14 Osmo
- Osmo - Overview
- Osmo - Product / Service
- Osmo - Key offerings
- SWOT
- 14.15 Scentronix LLC
- Scentronix LLC - Overview
- Scentronix LLC - Product / Service
- Scentronix LLC - Key offerings
- SWOT
- 14.16 Symrise Group
- Symrise Group - Overview
- Symrise Group - Business segments
- Symrise Group - Key news
- Symrise Group - Key offerings
- Symrise Group - Segment focus
- SWOT
- 14.17 Takasago International Corp.
- Takasago International Corp. - Overview
- Takasago International Corp. - Business segments
- Takasago International Corp. - Key news
- Takasago International Corp. - Key offerings
- Takasago International Corp. - Segment focus
- SWOT
- 14.18 The Procter and Gamble Co.
- The Procter and Gamble Co. - Overview
- The Procter and Gamble Co. - Business segments
- The Procter and Gamble Co. - Key offerings
- The Procter and Gamble Co. - Segment focus
- SWOT
15 Appendix
- 15.1 Scope of the report
- 15.2 Inclusions and exclusions checklist
- Inclusions checklist
- Exclusions checklist
- 15.3 Currency conversion rates for US$
- Currency conversion rates for US$
- 15.4 Research methodology
- Research methodology
- 15.5 Data procurement
- Information sources
- 15.6 Data validation
- Data validation
- 15.7 Validation techniques employed for market sizing
- Validation techniques employed for market sizing
- 15.8 Data synthesis
- Data synthesis
- 15.9 360 degree market analysis
- 360 degree market analysis
- 15.10 List of abbreviations
- List of abbreviations

