|
|
市場調査レポート
商品コード
1792223
生物学におけるジェネレーティブAIの世界市場 2025-2029Global Generative AI in Biology Market 2025-2029 |
||||||

|
|||||||
カスタマイズ可能
|
|||||||


| 生物学におけるジェネレーティブAIの世界市場 2025-2029 |
|
出版日: 2025年08月08日
発行: TechNavio
ページ情報: 英文 234 Pages
納期: 即納可能
|

全表示
- 概要
- 図表
- 目次
生物学におけるジェネレーティブAI市場は2024-2029年に3億8,640万米ドル、予測期間中のCAGRは29.3%で成長すると予測されます。
当レポートでは、生物学におけるジェネレーティブAI市場の全体的な分析、市場規模・予測、動向、成長促進要因、課題、約25のベンダーを網羅したベンダー分析などを掲載しています。
現在の市場シナリオ、最新動向と促進要因、市場環境全体に関する最新分析を提供しています。市場は、医薬品の生産性向上とコスト削減の必要性、AI技術と計算インフラの急速な進歩、高品質で大規模な生物学的データの急激な増加によって牽引されています。
| 市場範囲 | |
|---|---|
| 基準年 | 2025 |
| 終了年 | 2029 |
| 予測期間 | 2025-2029 |
| 成長モメンタム | 加速 |
| 前年比 | 27.7% |
| CAGR | 29.3% |
| 増分額 | 3億8,640万米ドル |
本調査は、業界の主要参加者からのインプットを含め、一次情報と二次情報を客観的に組み合わせて実施しました。レポートには、主要企業の分析に加え、包括的な市場規模データ、地域別分析によるセグメント、ベンダー情勢が含まれています。レポートには履歴データと予測データがあります。
本調査では、今後数年間の生物学におけるジェネレーティブAI市場の成長を促進する主な要因の1つとして、生物学的基盤モデルと大規模言語モデルの台頭を挙げています。また、創薬のためのエンドツーエンドの統合プラットフォームへのシフトや、高価値でリスクを共有する戦略的パートナーシップの普及は、市場の大きな需要につながります。
目次
第1章 エグゼクティブサマリー
- 市場概要
第2章 Technavio分析
- 価格・ライフサイクル・顧客購入バスケット・採用率・購入基準の分析
- インプットの重要性と差別化の要因
- 混乱の要因
- 促進要因と課題の影響
第3章 市場情勢
- 市場エコシステム
- 市場の特徴
- バリューチェーン分析
第4章 市場規模
- 市場の定義
- 市場セグメント分析
- 市場規模 2024
- 市場の見通し 2024-2029
第5章 ファイブフォース分析
- ファイブフォースの要約
- 買い手の交渉力
- 供給企業の交渉力
- 新規参入業者の脅威
- 代替品の脅威
- 競争の脅威
- 市況
第6章 市場セグメンテーション:技術別
- 市場セグメント
- 比較:技術別
- トランスフォーマーベース:市場規模と予測 2024-2029
- 法学修士:市場規模と予測 2024-2029
- GAN:市場規模と予測 2024-2029
- 拡散モデル:市場規模と予測 2024-2029
- 市場機会:技術別
第7章 市場セグメンテーション:用途別
- 市場セグメント
- 比較:用途別
- 新しい医薬品の設計:市場規模と予測 2024-2029
- タンパク質構造予測:市場規模と予測 2024-2029
- 遺伝子とDNA配列の生成:市場規模と予測 2024-2029
- 合成生物学:市場規模と予測 2024-2029
- その他:市場規模と予測 2024-2029
- 市場機会:用途別
第8章 市場セグメンテーション:エンドユーザー別
- 市場セグメント
- 比較:エンドユーザー別
- 医薬品および創薬:市場規模と予測 2024-2029
- バイオテクノロジーとバイオインフォマティクス:市場規模と予測 2024-2029
- 学術調査:市場規模と予測 2024-2029
- 契約調査機関:市場規模と予測 2024-2029
- 市場機会:エンドユーザー別
第9章 顧客情勢
- 顧客情勢の概要
第10章 地域別情勢
- 地域別セグメンテーション
- 地域別比較
- 北米:市場規模と予測 2024-2029
- 欧州:市場規模と予測 2024-2029
- アジア太平洋:市場規模と予測 2024-2029
- 南米:市場規模と予測 2024-2029
- 中東・アフリカ:市場規模と予測 2024-2029
- インド:市場規模と予測 2024-2029
- 米国:市場規模と予測 2024-2029
- フランス:市場規模と予測 2024-2029
- イタリア:市場規模と予測 2024-2029
- 韓国:市場規模と予測 2024-2029
- 中国:市場規模と予測 2024-2029
- カナダ:市場規模と予測 2024-2029
- 英国:市場規模と予測 2024-2029
- ドイツ:市場規模と予測 2024-2029
- 日本:市場規模と予測 2024-2029
- 市場機会:地域情勢別
第11章 促進要因・課題・機会・抑制要因
- 市場促進要因
- 市場の課題
- 促進要因と課題の影響
- 市場の機会・抑制要因
第12章 競合情勢
- 概要
- 競合情勢
- 混乱の状況
- 業界のリスク
第13章 競合分析
- 企業プロファイル
- 企業ランキング指数
- 企業の市場ポジショニング
- Absci
- Arzeda Corp.
- Atomwise Inc.
- BenevolentAI
- Deep Genomics Inc.
- DeepMind Technologies Ltd.
- Evogene Ltd.
- Exscientia PLC
- Generate Biomedicines
- Ginkgo Bioworks Holdings Inc.
- Insilico Medicine
- Owkin Inc.
- Recursion Pharmaceuticals Inc.
- Schrodinger Inc.
- Shiru Inc.
第14章 付録
Exhibits:
- Exhibits1: Executive Summary - Chart on Market Overview
- Exhibits2: Executive Summary - Data Table on Market Overview
- Exhibits3: Executive Summary - Chart on Global Market Characteristics
- Exhibits4: Executive Summary - Chart on Market By Geographical Landscape
- Exhibits5: Executive Summary - Chart on Market Segmentation by Technology
- Exhibits6: Executive Summary - Chart on Market Segmentation by Application
- Exhibits7: Executive Summary - Chart on Market Segmentation by End-user
- Exhibits8: Executive Summary - Chart on Incremental Growth
- Exhibits9: Executive Summary - Data Table on Incremental Growth
- Exhibits10: Executive Summary - Chart on Company Market Positioning
- Exhibits11: Analysis of price sensitivity, lifecycle, customer purchase basket, adoption rates, and purchase criteria
- Exhibits12: Overview on criticality of inputs and factors of differentiation
- Exhibits13: Overview on factors of disruption
- Exhibits14: Impact of drivers and challenges in 2024 and 2029
- Exhibits15: Parent Market
- Exhibits16: Data Table on - Parent Market
- Exhibits17: Market characteristics analysis
- Exhibits18: Value chain analysis
- Exhibits19: Offerings of companies included in the market definition
- Exhibits20: Market segments
- Exhibits21: Chart on Global - Market size and forecast 2024-2029 ($ million)
- Exhibits22: Data Table on Global - Market size and forecast 2024-2029 ($ million)
- Exhibits23: Chart on Global Market: Year-over-year growth 2024-2029 (%)
- Exhibits24: Data Table on Global Market: Year-over-year growth 2024-2029 (%)
- Exhibits25: Five forces analysis - Comparison between 2024 and 2029
- Exhibits26: Bargaining power of buyers - Impact of key factors 2024 and 2029
- Exhibits27: Bargaining power of suppliers - Impact of key factors in 2024 and 2029
- Exhibits28: Threat of new entrants - Impact of key factors in 2024 and 2029
- Exhibits29: Threat of substitutes - Impact of key factors in 2024 and 2029
- Exhibits30: Threat of rivalry - Impact of key factors in 2024 and 2029
- Exhibits31: Chart on Market condition - Five forces 2024 and 2029
- Exhibits32: Chart on Technology - Market share 2024-2029 (%)
- Exhibits33: Data Table on Technology - Market share 2024-2029 (%)
- Exhibits34: Chart on Comparison by Technology
- Exhibits35: Data Table on Comparison by Technology
- Exhibits36: Chart on Transformer-based - Market size and forecast 2024-2029 ($ million)
- Exhibits37: Data Table on Transformer-based - Market size and forecast 2024-2029 ($ million)
- Exhibits38: Chart on Transformer-based - Year-over-year growth 2024-2029 (%)
- Exhibits39: Data Table on Transformer-based - Year-over-year growth 2024-2029 (%)
- Exhibits40: Chart on LLM - Market size and forecast 2024-2029 ($ million)
- Exhibits41: Data Table on LLM - Market size and forecast 2024-2029 ($ million)
- Exhibits42: Chart on LLM - Year-over-year growth 2024-2029 (%)
- Exhibits43: Data Table on LLM - Year-over-year growth 2024-2029 (%)
- Exhibits44: Chart on GANs - Market size and forecast 2024-2029 ($ million)
- Exhibits45: Data Table on GANs - Market size and forecast 2024-2029 ($ million)
- Exhibits46: Chart on GANs - Year-over-year growth 2024-2029 (%)
- Exhibits47: Data Table on GANs - Year-over-year growth 2024-2029 (%)
- Exhibits48: Chart on Diffusion models - Market size and forecast 2024-2029 ($ million)
- Exhibits49: Data Table on Diffusion models - Market size and forecast 2024-2029 ($ million)
- Exhibits50: Chart on Diffusion models - Year-over-year growth 2024-2029 (%)
- Exhibits51: Data Table on Diffusion models - Year-over-year growth 2024-2029 (%)
- Exhibits52: Market opportunity by Technology ($ million)
- Exhibits53: Data Table on Market opportunity by Technology ($ million)
- Exhibits54: Chart on Application - Market share 2024-2029 (%)
- Exhibits55: Data Table on Application - Market share 2024-2029 (%)
- Exhibits56: Chart on Comparison by Application
- Exhibits57: Data Table on Comparison by Application
- Exhibits58: Chart on Novel drug design - Market size and forecast 2024-2029 ($ million)
- Exhibits59: Data Table on Novel drug design - Market size and forecast 2024-2029 ($ million)
- Exhibits60: Chart on Novel drug design - Year-over-year growth 2024-2029 (%)
- Exhibits61: Data Table on Novel drug design - Year-over-year growth 2024-2029 (%)
- Exhibits62: Chart on Protein structure prediction - Market size and forecast 2024-2029 ($ million)
- Exhibits63: Data Table on Protein structure prediction - Market size and forecast 2024-2029 ($ million)
- Exhibits64: Chart on Protein structure prediction - Year-over-year growth 2024-2029 (%)
- Exhibits65: Data Table on Protein structure prediction - Year-over-year growth 2024-2029 (%)
- Exhibits66: Chart on Gene and DNA sequence generation - Market size and forecast 2024-2029 ($ million)
- Exhibits67: Data Table on Gene and DNA sequence generation - Market size and forecast 2024-2029 ($ million)
- Exhibits68: Chart on Gene and DNA sequence generation - Year-over-year growth 2024-2029 (%)
- Exhibits69: Data Table on Gene and DNA sequence generation - Year-over-year growth 2024-2029 (%)
- Exhibits70: Chart on Synthetic biology - Market size and forecast 2024-2029 ($ million)
- Exhibits71: Data Table on Synthetic biology - Market size and forecast 2024-2029 ($ million)
- Exhibits72: Chart on Synthetic biology - Year-over-year growth 2024-2029 (%)
- Exhibits73: Data Table on Synthetic biology - Year-over-year growth 2024-2029 (%)
- Exhibits74: Chart on Others - Market size and forecast 2024-2029 ($ million)
- Exhibits75: Data Table on Others - Market size and forecast 2024-2029 ($ million)
- Exhibits76: Chart on Others - Year-over-year growth 2024-2029 (%)
- Exhibits77: Data Table on Others - Year-over-year growth 2024-2029 (%)
- Exhibits78: Market opportunity by Application ($ million)
- Exhibits79: Data Table on Market opportunity by Application ($ million)
- Exhibits80: Chart on End-user - Market share 2024-2029 (%)
- Exhibits81: Data Table on End-user - Market share 2024-2029 (%)
- Exhibits82: Chart on Comparison by End-user
- Exhibits83: Data Table on Comparison by End-user
- Exhibits84: Chart on Pharmaceutical and drug discovery - Market size and forecast 2024-2029 ($ million)
- Exhibits85: Data Table on Pharmaceutical and drug discovery - Market size and forecast 2024-2029 ($ million)
- Exhibits86: Chart on Pharmaceutical and drug discovery - Year-over-year growth 2024-2029 (%)
- Exhibits87: Data Table on Pharmaceutical and drug discovery - Year-over-year growth 2024-2029 (%)
- Exhibits88: Chart on Biotech and bioinformatics - Market size and forecast 2024-2029 ($ million)
- Exhibits89: Data Table on Biotech and bioinformatics - Market size and forecast 2024-2029 ($ million)
- Exhibits90: Chart on Biotech and bioinformatics - Year-over-year growth 2024-2029 (%)
- Exhibits91: Data Table on Biotech and bioinformatics - Year-over-year growth 2024-2029 (%)
- Exhibits92: Chart on Academic and research - Market size and forecast 2024-2029 ($ million)
- Exhibits93: Data Table on Academic and research - Market size and forecast 2024-2029 ($ million)
- Exhibits94: Chart on Academic and research - Year-over-year growth 2024-2029 (%)
- Exhibits95: Data Table on Academic and research - Year-over-year growth 2024-2029 (%)
- Exhibits96: Chart on Contract research organizations - Market size and forecast 2024-2029 ($ million)
- Exhibits97: Data Table on Contract research organizations - Market size and forecast 2024-2029 ($ million)
- Exhibits98: Chart on Contract research organizations - Year-over-year growth 2024-2029 (%)
- Exhibits99: Data Table on Contract research organizations - Year-over-year growth 2024-2029 (%)
- Exhibits100: Market opportunity by End-user ($ million)
- Exhibits101: Data Table on Market opportunity by End-user ($ million)
- Exhibits102: Analysis of price sensitivity, lifecycle, customer purchase basket, adoption rates, and purchase criteria
- Exhibits103: Chart on Market share By Geographical Landscape 2024-2029 (%)
- Exhibits104: Data Table on Market share By Geographical Landscape 2024-2029 (%)
- Exhibits105: Chart on Geographic comparison
- Exhibits106: Data Table on Geographic comparison
- Exhibits107: Chart on North America - Market size and forecast 2024-2029 ($ million)
- Exhibits108: Data Table on North America - Market size and forecast 2024-2029 ($ million)
- Exhibits109: Chart on North America - Year-over-year growth 2024-2029 (%)
- Exhibits110: Data Table on North America - Year-over-year growth 2024-2029 (%)
- Exhibits111: Chart on Europe - Market size and forecast 2024-2029 ($ million)
- Exhibits112: Data Table on Europe - Market size and forecast 2024-2029 ($ million)
- Exhibits113: Chart on Europe - Year-over-year growth 2024-2029 (%)
- Exhibits114: Data Table on Europe - Year-over-year growth 2024-2029 (%)
- Exhibits115: Chart on APAC - Market size and forecast 2024-2029 ($ million)
- Exhibits116: Data Table on APAC - Market size and forecast 2024-2029 ($ million)
- Exhibits117: Chart on APAC - Year-over-year growth 2024-2029 (%)
- Exhibits118: Data Table on APAC - Year-over-year growth 2024-2029 (%)
- Exhibits119: Chart on South America - Market size and forecast 2024-2029 ($ million)
- Exhibits120: Data Table on South America - Market size and forecast 2024-2029 ($ million)
- Exhibits121: Chart on South America - Year-over-year growth 2024-2029 (%)
- Exhibits122: Data Table on South America - Year-over-year growth 2024-2029 (%)
- Exhibits123: Chart on Middle East and Africa - Market size and forecast 2024-2029 ($ million)
- Exhibits124: Data Table on Middle East and Africa - Market size and forecast 2024-2029 ($ million)
- Exhibits125: Chart on Middle East and Africa - Year-over-year growth 2024-2029 (%)
- Exhibits126: Data Table on Middle East and Africa - Year-over-year growth 2024-2029 (%)
- Exhibits127: Chart on India - Market size and forecast 2024-2029 ($ million)
- Exhibits128: Data Table on India - Market size and forecast 2024-2029 ($ million)
- Exhibits129: Chart on India - Year-over-year growth 2024-2029 (%)
- Exhibits130: Data Table on India - Year-over-year growth 2024-2029 (%)
- Exhibits131: Chart on US - Market size and forecast 2024-2029 ($ million)
- Exhibits132: Data Table on US - Market size and forecast 2024-2029 ($ million)
- Exhibits133: Chart on US - Year-over-year growth 2024-2029 (%)
- Exhibits134: Data Table on US - Year-over-year growth 2024-2029 (%)
- Exhibits135: Chart on France - Market size and forecast 2024-2029 ($ million)
- Exhibits136: Data Table on France - Market size and forecast 2024-2029 ($ million)
- Exhibits137: Chart on France - Year-over-year growth 2024-2029 (%)
- Exhibits138: Data Table on France - Year-over-year growth 2024-2029 (%)
- Exhibits139: Chart on Italy - Market size and forecast 2024-2029 ($ million)
- Exhibits140: Data Table on Italy - Market size and forecast 2024-2029 ($ million)
- Exhibits141: Chart on Italy - Year-over-year growth 2024-2029 (%)
- Exhibits142: Data Table on Italy - Year-over-year growth 2024-2029 (%)
- Exhibits143: Chart on South Korea - Market size and forecast 2024-2029 ($ million)
- Exhibits144: Data Table on South Korea - Market size and forecast 2024-2029 ($ million)
- Exhibits145: Chart on South Korea - Year-over-year growth 2024-2029 (%)
- Exhibits146: Data Table on South Korea - Year-over-year growth 2024-2029 (%)
- Exhibits147: Chart on China - Market size and forecast 2024-2029 ($ million)
- Exhibits148: Data Table on China - Market size and forecast 2024-2029 ($ million)
- Exhibits149: Chart on China - Year-over-year growth 2024-2029 (%)
- Exhibits150: Data Table on China - Year-over-year growth 2024-2029 (%)
- Exhibits151: Chart on Canada - Market size and forecast 2024-2029 ($ million)
- Exhibits152: Data Table on Canada - Market size and forecast 2024-2029 ($ million)
- Exhibits153: Chart on Canada - Year-over-year growth 2024-2029 (%)
- Exhibits154: Data Table on Canada - Year-over-year growth 2024-2029 (%)
- Exhibits155: Chart on UK - Market size and forecast 2024-2029 ($ million)
- Exhibits156: Data Table on UK - Market size and forecast 2024-2029 ($ million)
- Exhibits157: Chart on UK - Year-over-year growth 2024-2029 (%)
- Exhibits158: Data Table on UK - Year-over-year growth 2024-2029 (%)
- Exhibits159: Chart on Germany - Market size and forecast 2024-2029 ($ million)
- Exhibits160: Data Table on Germany - Market size and forecast 2024-2029 ($ million)
- Exhibits161: Chart on Germany - Year-over-year growth 2024-2029 (%)
- Exhibits162: Data Table on Germany - Year-over-year growth 2024-2029 (%)
- Exhibits163: Chart on Japan - Market size and forecast 2024-2029 ($ million)
- Exhibits164: Data Table on Japan - Market size and forecast 2024-2029 ($ million)
- Exhibits165: Chart on Japan - Year-over-year growth 2024-2029 (%)
- Exhibits166: Data Table on Japan - Year-over-year growth 2024-2029 (%)
- Exhibits167: Market opportunity By Geographical Landscape ($ million)
- Exhibits168: Data Tables on Market opportunity By Geographical Landscape ($ million)
- Exhibits169: Impact of drivers and challenges in 2024 and 2029
- Exhibits170: Overview on criticality of inputs and factors of differentiation
- Exhibits171: Overview on factors of disruption
- Exhibits172: Impact of key risks on business
- Exhibits173: Companies covered
- Exhibits174: Company ranking index
- Exhibits175: Matrix on companies position and classification
- Exhibits176: Absci - Overview
- Exhibits177: Absci - Product / Service
- Exhibits178: Absci - Key offerings
- Exhibits179: SWOT
- Exhibits180: Arzeda Corp. - Overview
- Exhibits181: Arzeda Corp. - Product / Service
- Exhibits182: Arzeda Corp. - Key offerings
- Exhibits183: SWOT
- Exhibits184: Atomwise Inc. - Overview
- Exhibits185: Atomwise Inc. - Product / Service
- Exhibits186: Atomwise Inc. - Key offerings
- Exhibits187: SWOT
- Exhibits188: BenevolentAI - Overview
- Exhibits189: BenevolentAI - Product / Service
- Exhibits190: BenevolentAI - Key offerings
- Exhibits191: SWOT
- Exhibits192: Deep Genomics Inc. - Overview
- Exhibits193: Deep Genomics Inc. - Product / Service
- Exhibits194: Deep Genomics Inc. - Key offerings
- Exhibits195: SWOT
- Exhibits196: DeepMind Technologies Ltd. - Overview
- Exhibits197: DeepMind Technologies Ltd. - Product / Service
- Exhibits198: DeepMind Technologies Ltd. - Key offerings
- Exhibits199: SWOT
- Exhibits200: Evogene Ltd. - Overview
- Exhibits201: Evogene Ltd. - Business segments
- Exhibits202: Evogene Ltd. - Key offerings
- Exhibits203: Evogene Ltd. - Segment focus
- Exhibits204: SWOT
- Exhibits205: Exscientia PLC - Overview
- Exhibits206: Exscientia PLC - Product / Service
- Exhibits207: Exscientia PLC - Key offerings
- Exhibits208: SWOT
- Exhibits209: Generate Biomedicines - Overview
- Exhibits210: Generate Biomedicines - Product / Service
- Exhibits211: Generate Biomedicines - Key offerings
- Exhibits212: SWOT
- Exhibits213: Ginkgo Bioworks Holdings Inc. - Overview
- Exhibits214: Ginkgo Bioworks Holdings Inc. - Business segments
- Exhibits215: Ginkgo Bioworks Holdings Inc. - Key offerings
- Exhibits216: Ginkgo Bioworks Holdings Inc. - Segment focus
- Exhibits217: SWOT
- Exhibits218: Insilico Medicine - Overview
- Exhibits219: Insilico Medicine - Product / Service
- Exhibits220: Insilico Medicine - Key offerings
- Exhibits221: SWOT
- Exhibits222: Owkin Inc. - Overview
- Exhibits223: Owkin Inc. - Product / Service
- Exhibits224: Owkin Inc. - Key offerings
- Exhibits225: SWOT
- Exhibits226: Recursion Pharmaceuticals Inc. - Overview
- Exhibits227: Recursion Pharmaceuticals Inc. - Product / Service
- Exhibits228: Recursion Pharmaceuticals Inc. - Key offerings
- Exhibits229: SWOT
- Exhibits230: Schrodinger Inc. - Overview
- Exhibits231: Schrodinger Inc. - Business segments
- Exhibits232: Schrodinger Inc. - Key offerings
- Exhibits233: Schrodinger Inc. - Segment focus
- Exhibits234: SWOT
- Exhibits235: Shiru Inc. - Overview
- Exhibits236: Shiru Inc. - Product / Service
- Exhibits237: Shiru Inc. - Key offerings
- Exhibits238: SWOT
- Exhibits239: Inclusions checklist
- Exhibits240: Exclusions checklist
- Exhibits241: Currency conversion rates for US$
- Exhibits242: Research methodology
- Exhibits243: Information sources
- Exhibits244: Data validation
- Exhibits245: Validation techniques employed for market sizing
- Exhibits246: Data synthesis
- Exhibits247: 360 degree market analysis
- Exhibits248: List of abbreviations
The generative AI in biology market is forecasted to grow by USD 386.4 mn during 2024-2029, accelerating at a CAGR of 29.3% during the forecast period. The report on the generative AI in biology market provides a holistic analysis, market size and forecast, trends, growth drivers, and challenges, as well as vendor analysis covering around 25 vendors.
The report offers an up-to-date analysis regarding the current market scenario, the latest trends and drivers, and the overall market environment. The market is driven by imperative to enhance pharmaceutical productivity and reduce costs, rapid advancements in AI technology and computational infrastructure, and exponential growth of high-quality, large-scale biological data.
| Market Scope | |
|---|---|
| Base Year | 2025 |
| End Year | 2029 |
| Series Year | 2025-2029 |
| Growth Momentum | Accelerate |
| YOY 2025 | 27.7% |
| CAGR | 29.3% |
| Incremental Value | $386.4 mn |
The study was conducted using an objective combination of primary and secondary information including inputs from key participants in the industry. The report contains a comprehensive market size data, segment with regional analysis and vendor landscape in addition to an analysis of the key companies. Reports have historic and forecast data.
Technavio's generative AI in biology market is segmented as below:
By Technology
- Transformer-based
- LLM
- GANs
- Diffusion models
By Application
- Novel drug design
- Protein structure prediction
- Gene and DNA sequence generation
- Synthetic biology
- Others
By End-user
- Pharmaceutical and drug discovery
- Biotech and bioinformatics
- Academic and research
- Contract research organizations
By Geographical Landscape
- North America
- Europe
- APAC
- South America
- Middle East and Africa
This study identifies the rise of biological foundation models and large language models as one of the prime reasons driving the generative AI in biology market growth during the next few years. Also, shift toward end-to-end integrated platforms for drug discovery and proliferation of high-value, risk-sharing strategic partnerships will lead to sizable demand in the market.
The report on the generative AI in biology market covers the following areas:
- generative AI In Biology Market sizing
- generative AI In Biology Market forecast
- generative AI In Biology Market industry analysis
The robust vendor analysis is designed to help clients improve their market position, and in line with this, this report provides a detailed analysis of several leading generative AI in biology market vendors that include Absci, Arzeda Corp., Atomwise Inc., BenevolentAI, Cyclica, Deep Genomics Inc., DeepMind Technologies Ltd., Evogene Ltd., Exscientia PLC, Generate Biomedicines, Ginkgo Bioworks Holdings Inc., Insilico Medicine, Owkin Inc., Recursion Pharmaceuticals Inc., Schrodinger Inc., Shiru Inc., and Verge Analytics Inc.. Also, the generative AI in biology market analysis report includes information on upcoming trends and challenges that will influence market growth. This is to help companies strategize and leverage all forthcoming growth opportunities.
The publisher presents a detailed picture of the market by the way of study, synthesis, and summation of data from multiple sources by an analysis of key parameters such as profit, pricing, competition, and promotions. It presents various market facets by identifying the key industry influencers. The data presented is comprehensive, reliable, and a result of extensive primary and secondary research. The market research reports provide a complete competitive landscape and an in-depth vendor selection methodology and analysis using qualitative and quantitative research to forecast accurate market growth.
Table of Contents
1 Executive Summary
- 1.1 Market overview
- Executive Summary - Chart on Market Overview
- Executive Summary - Data Table on Market Overview
- Executive Summary - Chart on Global Market Characteristics
- Executive Summary - Chart on Market By Geographical Landscape
- Executive Summary - Chart on Market Segmentation by Technology
- Executive Summary - Chart on Market Segmentation by Application
- Executive Summary - Chart on Market Segmentation by End-user
- Executive Summary - Chart on Incremental Growth
- Executive Summary - Data Table on Incremental Growth
- Executive Summary - Chart on Company Market Positioning
2 Technavio Analysis
- 2.1 Analysis of price sensitivity, lifecycle, customer purchase basket, adoption rates, and purchase criteria
- Analysis of price sensitivity, lifecycle, customer purchase basket, adoption rates, and purchase criteria
- 2.2 Criticality of inputs and Factors of differentiation
- Overview on criticality of inputs and factors of differentiation
- 2.3 Factors of disruption
- Overview on factors of disruption
- 2.4 Impact of drivers and challenges
- Impact of drivers and challenges in 2024 and 2029
3 Market Landscape
- 3.1 Market ecosystem
- Parent Market
- Data Table on - Parent Market
- 3.2 Market characteristics
- Market characteristics analysis
- 3.3 Value chain analysis
- Value chain analysis
4 Market Sizing
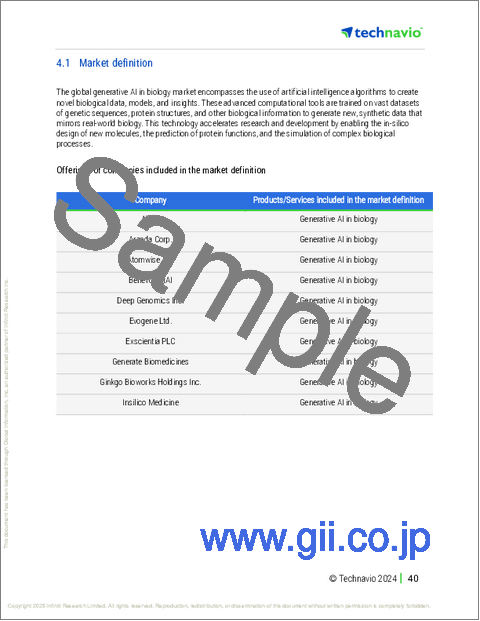
- 4.1 Market definition
- Offerings of companies included in the market definition
- 4.2 Market segment analysis
- Market segments
- 4.3 Market size 2024
- 4.4 Market outlook: Forecast for 2024-2029
- Chart on Global - Market size and forecast 2024-2029 ($ million)
- Data Table on Global - Market size and forecast 2024-2029 ($ million)
- Chart on Global Market: Year-over-year growth 2024-2029 (%)
- Data Table on Global Market: Year-over-year growth 2024-2029 (%)
5 Five Forces Analysis
- 5.1 Five forces summary
- Five forces analysis - Comparison between 2024 and 2029
- 5.2 Bargaining power of buyers
- Bargaining power of buyers - Impact of key factors 2024 and 2029
- 5.3 Bargaining power of suppliers
- Bargaining power of suppliers - Impact of key factors in 2024 and 2029
- 5.4 Threat of new entrants
- Threat of new entrants - Impact of key factors in 2024 and 2029
- 5.5 Threat of substitutes
- Threat of substitutes - Impact of key factors in 2024 and 2029
- 5.6 Threat of rivalry
- Threat of rivalry - Impact of key factors in 2024 and 2029
- 5.7 Market condition
- Chart on Market condition - Five forces 2024 and 2029
6 Market Segmentation by Technology
- 6.1 Market segments
- Chart on Technology - Market share 2024-2029 (%)
- Data Table on Technology - Market share 2024-2029 (%)
- 6.2 Comparison by Technology
- Chart on Comparison by Technology
- Data Table on Comparison by Technology
- 6.3 Transformer-based - Market size and forecast 2024-2029
- Chart on Transformer-based - Market size and forecast 2024-2029 ($ million)
- Data Table on Transformer-based - Market size and forecast 2024-2029 ($ million)
- Chart on Transformer-based - Year-over-year growth 2024-2029 (%)
- Data Table on Transformer-based - Year-over-year growth 2024-2029 (%)
- 6.4 LLM - Market size and forecast 2024-2029
- Chart on LLM - Market size and forecast 2024-2029 ($ million)
- Data Table on LLM - Market size and forecast 2024-2029 ($ million)
- Chart on LLM - Year-over-year growth 2024-2029 (%)
- Data Table on LLM - Year-over-year growth 2024-2029 (%)
- 6.5 GANs - Market size and forecast 2024-2029
- Chart on GANs - Market size and forecast 2024-2029 ($ million)
- Data Table on GANs - Market size and forecast 2024-2029 ($ million)
- Chart on GANs - Year-over-year growth 2024-2029 (%)
- Data Table on GANs - Year-over-year growth 2024-2029 (%)
- 6.6 Diffusion models - Market size and forecast 2024-2029
- Chart on Diffusion models - Market size and forecast 2024-2029 ($ million)
- Data Table on Diffusion models - Market size and forecast 2024-2029 ($ million)
- Chart on Diffusion models - Year-over-year growth 2024-2029 (%)
- Data Table on Diffusion models - Year-over-year growth 2024-2029 (%)
- 6.7 Market opportunity by Technology
- Market opportunity by Technology ($ million)
- Data Table on Market opportunity by Technology ($ million)
7 Market Segmentation by Application
- 7.1 Market segments
- Chart on Application - Market share 2024-2029 (%)
- Data Table on Application - Market share 2024-2029 (%)
- 7.2 Comparison by Application
- Chart on Comparison by Application
- Data Table on Comparison by Application
- 7.3 Novel drug design - Market size and forecast 2024-2029
- Chart on Novel drug design - Market size and forecast 2024-2029 ($ million)
- Data Table on Novel drug design - Market size and forecast 2024-2029 ($ million)
- Chart on Novel drug design - Year-over-year growth 2024-2029 (%)
- Data Table on Novel drug design - Year-over-year growth 2024-2029 (%)
- 7.4 Protein structure prediction - Market size and forecast 2024-2029
- Chart on Protein structure prediction - Market size and forecast 2024-2029 ($ million)
- Data Table on Protein structure prediction - Market size and forecast 2024-2029 ($ million)
- Chart on Protein structure prediction - Year-over-year growth 2024-2029 (%)
- Data Table on Protein structure prediction - Year-over-year growth 2024-2029 (%)
- 7.5 Gene and DNA sequence generation - Market size and forecast 2024-2029
- Chart on Gene and DNA sequence generation - Market size and forecast 2024-2029 ($ million)
- Data Table on Gene and DNA sequence generation - Market size and forecast 2024-2029 ($ million)
- Chart on Gene and DNA sequence generation - Year-over-year growth 2024-2029 (%)
- Data Table on Gene and DNA sequence generation - Year-over-year growth 2024-2029 (%)
- 7.6 Synthetic biology - Market size and forecast 2024-2029
- Chart on Synthetic biology - Market size and forecast 2024-2029 ($ million)
- Data Table on Synthetic biology - Market size and forecast 2024-2029 ($ million)
- Chart on Synthetic biology - Year-over-year growth 2024-2029 (%)
- Data Table on Synthetic biology - Year-over-year growth 2024-2029 (%)
- 7.7 Others - Market size and forecast 2024-2029
- Chart on Others - Market size and forecast 2024-2029 ($ million)
- Data Table on Others - Market size and forecast 2024-2029 ($ million)
- Chart on Others - Year-over-year growth 2024-2029 (%)
- Data Table on Others - Year-over-year growth 2024-2029 (%)
- 7.8 Market opportunity by Application
- Market opportunity by Application ($ million)
- Data Table on Market opportunity by Application ($ million)
8 Market Segmentation by End-user
- 8.1 Market segments
- Chart on End-user - Market share 2024-2029 (%)
- Data Table on End-user - Market share 2024-2029 (%)
- 8.2 Comparison by End-user
- Chart on Comparison by End-user
- Data Table on Comparison by End-user
- 8.3 Pharmaceutical and drug discovery - Market size and forecast 2024-2029
- Chart on Pharmaceutical and drug discovery - Market size and forecast 2024-2029 ($ million)
- Data Table on Pharmaceutical and drug discovery - Market size and forecast 2024-2029 ($ million)
- Chart on Pharmaceutical and drug discovery - Year-over-year growth 2024-2029 (%)
- Data Table on Pharmaceutical and drug discovery - Year-over-year growth 2024-2029 (%)
- 8.4 Biotech and bioinformatics - Market size and forecast 2024-2029
- Chart on Biotech and bioinformatics - Market size and forecast 2024-2029 ($ million)
- Data Table on Biotech and bioinformatics - Market size and forecast 2024-2029 ($ million)
- Chart on Biotech and bioinformatics - Year-over-year growth 2024-2029 (%)
- Data Table on Biotech and bioinformatics - Year-over-year growth 2024-2029 (%)
- 8.5 Academic and research - Market size and forecast 2024-2029
- Chart on Academic and research - Market size and forecast 2024-2029 ($ million)
- Data Table on Academic and research - Market size and forecast 2024-2029 ($ million)
- Chart on Academic and research - Year-over-year growth 2024-2029 (%)
- Data Table on Academic and research - Year-over-year growth 2024-2029 (%)
- 8.6 Contract research organizations - Market size and forecast 2024-2029
- Chart on Contract research organizations - Market size and forecast 2024-2029 ($ million)
- Data Table on Contract research organizations - Market size and forecast 2024-2029 ($ million)
- Chart on Contract research organizations - Year-over-year growth 2024-2029 (%)
- Data Table on Contract research organizations - Year-over-year growth 2024-2029 (%)
- 8.7 Market opportunity by End-user
- Market opportunity by End-user ($ million)
- Data Table on Market opportunity by End-user ($ million)
9 Customer Landscape
- 9.1 Customer landscape overview
- Analysis of price sensitivity, lifecycle, customer purchase basket, adoption rates, and purchase criteria
10 Geographic Landscape
- 10.1 Geographic segmentation
- Chart on Market share By Geographical Landscape 2024-2029 (%)
- Data Table on Market share By Geographical Landscape 2024-2029 (%)
- 10.2 Geographic comparison
- Chart on Geographic comparison
- Data Table on Geographic comparison
- 10.3 North America - Market size and forecast 2024-2029
- Chart on North America - Market size and forecast 2024-2029 ($ million)
- Data Table on North America - Market size and forecast 2024-2029 ($ million)
- Chart on North America - Year-over-year growth 2024-2029 (%)
- Data Table on North America - Year-over-year growth 2024-2029 (%)
- 10.4 Europe - Market size and forecast 2024-2029
- Chart on Europe - Market size and forecast 2024-2029 ($ million)
- Data Table on Europe - Market size and forecast 2024-2029 ($ million)
- Chart on Europe - Year-over-year growth 2024-2029 (%)
- Data Table on Europe - Year-over-year growth 2024-2029 (%)
- 10.5 APAC - Market size and forecast 2024-2029
- Chart on APAC - Market size and forecast 2024-2029 ($ million)
- Data Table on APAC - Market size and forecast 2024-2029 ($ million)
- Chart on APAC - Year-over-year growth 2024-2029 (%)
- Data Table on APAC - Year-over-year growth 2024-2029 (%)
- 10.6 South America - Market size and forecast 2024-2029
- Chart on South America - Market size and forecast 2024-2029 ($ million)
- Data Table on South America - Market size and forecast 2024-2029 ($ million)
- Chart on South America - Year-over-year growth 2024-2029 (%)
- Data Table on South America - Year-over-year growth 2024-2029 (%)
- 10.7 Middle East and Africa - Market size and forecast 2024-2029
- Chart on Middle East and Africa - Market size and forecast 2024-2029 ($ million)
- Data Table on Middle East and Africa - Market size and forecast 2024-2029 ($ million)
- Chart on Middle East and Africa - Year-over-year growth 2024-2029 (%)
- Data Table on Middle East and Africa - Year-over-year growth 2024-2029 (%)
- 10.8 India - Market size and forecast 2024-2029
- Chart on India - Market size and forecast 2024-2029 ($ million)
- Data Table on India - Market size and forecast 2024-2029 ($ million)
- Chart on India - Year-over-year growth 2024-2029 (%)
- Data Table on India - Year-over-year growth 2024-2029 (%)
- 10.9 US - Market size and forecast 2024-2029
- Chart on US - Market size and forecast 2024-2029 ($ million)
- Data Table on US - Market size and forecast 2024-2029 ($ million)
- Chart on US - Year-over-year growth 2024-2029 (%)
- Data Table on US - Year-over-year growth 2024-2029 (%)
- 10.10 France - Market size and forecast 2024-2029
- Chart on France - Market size and forecast 2024-2029 ($ million)
- Data Table on France - Market size and forecast 2024-2029 ($ million)
- Chart on France - Year-over-year growth 2024-2029 (%)
- Data Table on France - Year-over-year growth 2024-2029 (%)
- 10.11 Italy - Market size and forecast 2024-2029
- Chart on Italy - Market size and forecast 2024-2029 ($ million)
- Data Table on Italy - Market size and forecast 2024-2029 ($ million)
- Chart on Italy - Year-over-year growth 2024-2029 (%)
- Data Table on Italy - Year-over-year growth 2024-2029 (%)
- 10.12 South Korea - Market size and forecast 2024-2029
- Chart on South Korea - Market size and forecast 2024-2029 ($ million)
- Data Table on South Korea - Market size and forecast 2024-2029 ($ million)
- Chart on South Korea - Year-over-year growth 2024-2029 (%)
- Data Table on South Korea - Year-over-year growth 2024-2029 (%)
- 10.13 China - Market size and forecast 2024-2029
- Chart on China - Market size and forecast 2024-2029 ($ million)
- Data Table on China - Market size and forecast 2024-2029 ($ million)
- Chart on China - Year-over-year growth 2024-2029 (%)
- Data Table on China - Year-over-year growth 2024-2029 (%)
- 10.14 Canada - Market size and forecast 2024-2029
- Chart on Canada - Market size and forecast 2024-2029 ($ million)
- Data Table on Canada - Market size and forecast 2024-2029 ($ million)
- Chart on Canada - Year-over-year growth 2024-2029 (%)
- Data Table on Canada - Year-over-year growth 2024-2029 (%)
- 10.15 UK - Market size and forecast 2024-2029
- Chart on UK - Market size and forecast 2024-2029 ($ million)
- Data Table on UK - Market size and forecast 2024-2029 ($ million)
- Chart on UK - Year-over-year growth 2024-2029 (%)
- Data Table on UK - Year-over-year growth 2024-2029 (%)
- 10.16 Germany - Market size and forecast 2024-2029
- Chart on Germany - Market size and forecast 2024-2029 ($ million)
- Data Table on Germany - Market size and forecast 2024-2029 ($ million)
- Chart on Germany - Year-over-year growth 2024-2029 (%)
- Data Table on Germany - Year-over-year growth 2024-2029 (%)
- 10.17 Japan - Market size and forecast 2024-2029
- Chart on Japan - Market size and forecast 2024-2029 ($ million)
- Data Table on Japan - Market size and forecast 2024-2029 ($ million)
- Chart on Japan - Year-over-year growth 2024-2029 (%)
- Data Table on Japan - Year-over-year growth 2024-2029 (%)
- 10.18 Market opportunity By Geographical Landscape
- Market opportunity By Geographical Landscape ($ million)
- Data Tables on Market opportunity By Geographical Landscape ($ million)
11 Drivers, Challenges, and Opportunity/Restraints
- 11.1 Market drivers
- 11.2 Market challenges
- 11.3 Impact of drivers and challenges
- Impact of drivers and challenges in 2024 and 2029
- 11.4 Market opportunities/restraints
12 Competitive Landscape
- 12.1 Overview
- 12.2 Competitive Landscape
- Overview on criticality of inputs and factors of differentiation
- 12.3 Landscape disruption
- Overview on factors of disruption
- 12.4 Industry risks
- Impact of key risks on business
13 Competitive Analysis
- 13.1 Companies profiled
- Companies covered
- 13.2 Company ranking index
- Company ranking index
- 13.3 Market positioning of companies
- Matrix on companies position and classification
- 13.4 Absci
- Absci - Overview
- Absci - Product / Service
- Absci - Key offerings
- SWOT
- 13.5 Arzeda Corp.
- Arzeda Corp. - Overview
- Arzeda Corp. - Product / Service
- Arzeda Corp. - Key offerings
- SWOT
- 13.6 Atomwise Inc.
- Atomwise Inc. - Overview
- Atomwise Inc. - Product / Service
- Atomwise Inc. - Key offerings
- SWOT
- 13.7 BenevolentAI
- BenevolentAI - Overview
- BenevolentAI - Product / Service
- BenevolentAI - Key offerings
- SWOT
- 13.8 Deep Genomics Inc.
- Deep Genomics Inc. - Overview
- Deep Genomics Inc. - Product / Service
- Deep Genomics Inc. - Key offerings
- SWOT
- 13.9 DeepMind Technologies Ltd.
- DeepMind Technologies Ltd. - Overview
- DeepMind Technologies Ltd. - Product / Service
- DeepMind Technologies Ltd. - Key offerings
- SWOT
- 13.10 Evogene Ltd.
- Evogene Ltd. - Overview
- Evogene Ltd. - Business segments
- Evogene Ltd. - Key offerings
- Evogene Ltd. - Segment focus
- SWOT
- 13.11 Exscientia PLC
- Exscientia PLC - Overview
- Exscientia PLC - Product / Service
- Exscientia PLC - Key offerings
- SWOT
- 13.12 Generate Biomedicines
- Generate Biomedicines - Overview
- Generate Biomedicines - Product / Service
- Generate Biomedicines - Key offerings
- SWOT
- 13.13 Ginkgo Bioworks Holdings Inc.
- Ginkgo Bioworks Holdings Inc. - Overview
- Ginkgo Bioworks Holdings Inc. - Business segments
- Ginkgo Bioworks Holdings Inc. - Key offerings
- Ginkgo Bioworks Holdings Inc. - Segment focus
- SWOT
- 13.14 Insilico Medicine
- Insilico Medicine - Overview
- Insilico Medicine - Product / Service
- Insilico Medicine - Key offerings
- SWOT
- 13.15 Owkin Inc.
- Owkin Inc. - Overview
- Owkin Inc. - Product / Service
- Owkin Inc. - Key offerings
- SWOT
- 13.16 Recursion Pharmaceuticals Inc.
- Recursion Pharmaceuticals Inc. - Overview
- Recursion Pharmaceuticals Inc. - Product / Service
- Recursion Pharmaceuticals Inc. - Key offerings
- SWOT
- 13.17 Schrodinger Inc.
- Schrodinger Inc. - Overview
- Schrodinger Inc. - Business segments
- Schrodinger Inc. - Key offerings
- Schrodinger Inc. - Segment focus
- SWOT
- 13.18 Shiru Inc.
- Shiru Inc. - Overview
- Shiru Inc. - Product / Service
- Shiru Inc. - Key offerings
- SWOT
14 Appendix
- 14.1 Scope of the report
- 14.2 Inclusions and exclusions checklist
- Inclusions checklist
- Exclusions checklist
- 14.3 Currency conversion rates for US$
- Currency conversion rates for US$
- 14.4 Research methodology
- Research methodology
- 14.5 Data procurement
- Information sources
- 14.6 Data validation
- Data validation
- 14.7 Validation techniques employed for market sizing
- Validation techniques employed for market sizing
- 14.8 Data synthesis
- Data synthesis
- 14.9 360 degree market analysis
- 360 degree market analysis
- 14.10 List of abbreviations
- List of abbreviations
