|
|
市場調査レポート
商品コード
1774414
持続可能なAIの世界市場 2025-2029Global Sustainable AI Market 2025-2029 |
||||||

|
|||||||
カスタマイズ可能
|
|||||||


| 持続可能なAIの世界市場 2025-2029 |
|
出版日: 2025年07月12日
発行: TechNavio
ページ情報: 英文 267 Pages
納期: 即納可能
|

全表示
- 概要
- 図表
- 目次
持続可能なAI市場は2024-2029年に15億5,310万米ドル、予測期間中のCAGRは29.3%で成長すると予測されます。
当レポートでは、持続可能なAI市場の全体的な分析、市場規模・予測、動向、成長促進要因、課題、約25のベンダーを網羅したベンダー分析などを掲載しています。
現在の市場シナリオ、最新動向と促進要因、市場環境全体に関する最新分析を提供しています。市場は、厳格な規制の枠組みや報告義務の急増、経済的な要請と具体的な投資収益率、加速する技術の進歩とアクセシビリティによって牽引されています。
| 市場範囲 | |
|---|---|
| 基準年 | 2025 |
| 終了年 | 2029 |
| 予測期間 | 2025-2029 |
| 成長モメンタム | 加速 |
| 前年比 | 27% |
| CAGR | 29.3% |
| 増分額 | 15億5,310万米ドル |
本調査は、業界の主要参加者からのインプットを含め、一次情報と二次情報を客観的に組み合わせて実施しました。レポートには、主要企業の分析に加え、包括的な市場規模データ、地域分析によるセグメント、ベンダー情勢が含まれています。レポートには過去データと予測データがあります。
本調査では、今後数年間の持続可能なAI市場の成長を促進する主な理由の一つとして、持続可能性ソリューションの触媒としてのジェネレーティブAIの出現を挙げています。また、システム的な脱炭素化のためのデジタルツインとAIの統合、グリーンAIとエネルギー効率の高いインフラストラクチャの戦略的な必要性は、市場の大きな需要につながります。
目次
第1章 エグゼクティブサマリー
- 市場概要
第2章 Technavio分析
- 価格・ライフサイクル・顧客購入バスケット・採用率・購入基準の分析
- インプットの重要性と差別化の要因
- 混乱の要因
- 促進要因と課題の影響
第3章 市場情勢
- 市場エコシステム
- 市場の特徴
- バリューチェーン分析
第4章 市場規模
- 市場の定義
- 市場セグメント分析
- 市場規模 2024
- 市場の見通し 2024-2029
第5章 市場規模実績
- 持続可能なAIの世界市場 2019-2023
- 技術別セグメント分析 2019-2023
- エンドユーザー別セグメント分析 2019-2023
- 展開別セグメント分析 2019-2023
- 用途別セグメント分析 2019-2023
- 地域別セグメント分析 2019-2023
- 国別セグメント分析 2019-2023
第6章 ファイブフォース分析
- ファイブフォースの要約
- 買い手の交渉力
- 供給企業の交渉力
- 新規参入業者の脅威
- 代替品の脅威
- 競争の脅威
- 市況
第7章 市場セグメンテーション:技術別
- 市場セグメント
- 比較:技術別
- 機械学習:市場規模と予測 2024-2029
- 自然言語処理:市場規模と予測 2024-2029
- ディープラーニング:市場規模と予測 2024-2029
- その他:市場規模と予測 2024-2029
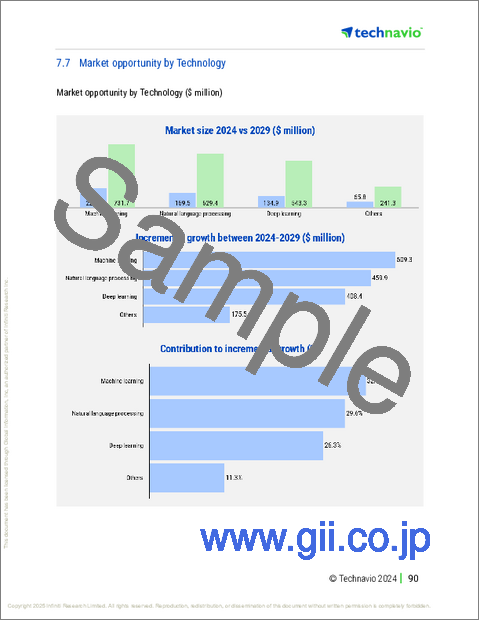
- 市場機会:技術別
第8章 市場セグメンテーション:エンドユーザー別
- 市場セグメント
- 比較:エンドユーザー別
- ヘルスケア:市場規模と予測 2024-2029
- 小売業とeコマース:市場規模と予測 2024-2029
- 製造業:市場規模と予測 2024-2029
- その他:市場規模と予測 2024-2029
- 市場機会:エンドユーザー別
第9章 市場セグメンテーション:展開別
- 市場セグメント
- 比較:展開別
- クラウドベース:市場規模と予測 2024-2029
- オンプレミス:市場規模と予測 2024-2029
- 市場機会:展開別
第10章 市場セグメンテーション:用途別
- 市場セグメント
- 比較:用途別
- エネルギー管理:市場規模と予測 2024-2029
- 炭素排出量の追跡:市場規模と予測 2024-2029
- 気候リスク評価:市場規模と予測 2024-2029
- スマート農業:市場規模と予測 2024-2029
- その他:市場規模と予測 2024-2029
- 市場機会:用途別
第11章 顧客情勢
- 顧客情勢の概要
第12章 地域別情勢
- 地域別セグメンテーション
- 地域別比較
- 北米:市場規模と予測 2024-2029
- 欧州:市場規模と予測 2024-2029
- アジア太平洋:市場規模と予測 2024-2029
- 南米:市場規模と予測 2024-2029
- 中東・アフリカ:市場規模と予測 2024-2029
- 米国:市場規模と予測 2024-2029
- 中国:市場規模と予測 2024-2029
- ドイツ:市場規模と予測 2024-2029
- カナダ:市場規模と予測 2024-2029
- 英国:市場規模と予測 2024-2029
- インド:市場規模と予測 2024-2029
- フランス:市場規模と予測 2024-2029
- オランダ:市場規模と予測 2024-2029
- メキシコ:市場規模と予測 2024-2029
- 日本:市場規模と予測 2024-2029
- 市場機会:地域情勢別
第13章 促進要因・課題・機会・抑制要因
- 市場促進要因
- 市場の課題
- 促進要因と課題の影響
- 市場の機会・抑制要因
第14章 競合情勢
- 概要
- 競合情勢
- 混乱の状況
- 業界のリスク
第15章 競合分析
- 企業プロファイル
- 企業ランキング指数
- 企業の市場ポジショニング
- Amazon.com Inc.
- Apple Inc.
- C3.AI Inc.
- Cisco Systems Inc.
- Google LLC
- Intel Corp.
- International Business Machines Corp.
- Meta Platforms Inc.
- Microsoft Corp.
- OpenAI
- Pachama, Inc.
- Planet Labs PBC
- Samsung Electronics Co. Ltd.
- Sylvera
- Tesla Inc.
第16章 付録
Exhibits:
- Exhibits1: Executive Summary - Chart on Market Overview
- Exhibits2: Executive Summary - Data Table on Market Overview
- Exhibits3: Executive Summary - Chart on Global Market Characteristics
- Exhibits4: Executive Summary - Chart on Market By Geographical Landscape
- Exhibits5: Executive Summary - Chart on Market Segmentation by Technology
- Exhibits6: Executive Summary - Chart on Market Segmentation by End-user
- Exhibits7: Executive Summary - Chart on Market Segmentation by Deployment
- Exhibits8: Executive Summary - Chart on Market Segmentation by Application
- Exhibits9: Executive Summary - Chart on Incremental Growth
- Exhibits10: Executive Summary - Data Table on Incremental Growth
- Exhibits11: Executive Summary - Chart on Company Market Positioning
- Exhibits12: Analysis of price sensitivity, lifecycle, customer purchase basket, adoption rates, and purchase criteria
- Exhibits13: Overview on criticality of inputs and factors of differentiation
- Exhibits14: Overview on factors of disruption
- Exhibits15: Impact of drivers and challenges in 2024 and 2029
- Exhibits16: Parent Market
- Exhibits17: Data Table on - Parent Market
- Exhibits18: Market characteristics analysis
- Exhibits19: Value chain analysis
- Exhibits20: Offerings of companies included in the market definition
- Exhibits21: Market segments
- Exhibits22: Chart on Global - Market size and forecast 2024-2029 ($ million)
- Exhibits23: Data Table on Global - Market size and forecast 2024-2029 ($ million)
- Exhibits24: Chart on Global Market: Year-over-year growth 2024-2029 (%)
- Exhibits25: Data Table on Global Market: Year-over-year growth 2024-2029 (%)
- Exhibits26: Historic Market Size - Data Table on Global Sustainable AI Market 2019 - 2023 ($ million)
- Exhibits27: Historic Market Size - Technology Segment 2019 - 2023 ($ million)
- Exhibits28: Historic Market Size - End-user Segment 2019 - 2023 ($ million)
- Exhibits29: Historic Market Size - Deployment Segment 2019 - 2023 ($ million)
- Exhibits30: Historic Market Size - Application Segment 2019 - 2023 ($ million)
- Exhibits31: Historic Market Size - Geography Segment 2019 - 2023 ($ million)
- Exhibits32: Historic Market Size - Country Segment 2019 - 2023 ($ million)
- Exhibits33: Five forces analysis - Comparison between 2024 and 2029
- Exhibits34: Bargaining power of buyers - Impact of key factors 2024 and 2029
- Exhibits35: Bargaining power of suppliers - Impact of key factors in 2024 and 2029
- Exhibits36: Threat of new entrants - Impact of key factors in 2024 and 2029
- Exhibits37: Threat of substitutes - Impact of key factors in 2024 and 2029
- Exhibits38: Threat of rivalry - Impact of key factors in 2024 and 2029
- Exhibits39: Chart on Market condition - Five forces 2024 and 2029
- Exhibits40: Chart on Technology - Market share 2024-2029 (%)
- Exhibits41: Data Table on Technology - Market share 2024-2029 (%)
- Exhibits42: Chart on Comparison by Technology
- Exhibits43: Data Table on Comparison by Technology
- Exhibits44: Chart on Machine learning - Market size and forecast 2024-2029 ($ million)
- Exhibits45: Data Table on Machine learning - Market size and forecast 2024-2029 ($ million)
- Exhibits46: Chart on Machine learning - Year-over-year growth 2024-2029 (%)
- Exhibits47: Data Table on Machine learning - Year-over-year growth 2024-2029 (%)
- Exhibits48: Chart on Natural language processing - Market size and forecast 2024-2029 ($ million)
- Exhibits49: Data Table on Natural language processing - Market size and forecast 2024-2029 ($ million)
- Exhibits50: Chart on Natural language processing - Year-over-year growth 2024-2029 (%)
- Exhibits51: Data Table on Natural language processing - Year-over-year growth 2024-2029 (%)
- Exhibits52: Chart on Deep learning - Market size and forecast 2024-2029 ($ million)
- Exhibits53: Data Table on Deep learning - Market size and forecast 2024-2029 ($ million)
- Exhibits54: Chart on Deep learning - Year-over-year growth 2024-2029 (%)
- Exhibits55: Data Table on Deep learning - Year-over-year growth 2024-2029 (%)
- Exhibits56: Chart on Others - Market size and forecast 2024-2029 ($ million)
- Exhibits57: Data Table on Others - Market size and forecast 2024-2029 ($ million)
- Exhibits58: Chart on Others - Year-over-year growth 2024-2029 (%)
- Exhibits59: Data Table on Others - Year-over-year growth 2024-2029 (%)
- Exhibits60: Market opportunity by Technology ($ million)
- Exhibits61: Data Table on Market opportunity by Technology ($ million)
- Exhibits62: Chart on End-user - Market share 2024-2029 (%)
- Exhibits63: Data Table on End-user - Market share 2024-2029 (%)
- Exhibits64: Chart on Comparison by End-user
- Exhibits65: Data Table on Comparison by End-user
- Exhibits66: Chart on Healthcare - Market size and forecast 2024-2029 ($ million)
- Exhibits67: Data Table on Healthcare - Market size and forecast 2024-2029 ($ million)
- Exhibits68: Chart on Healthcare - Year-over-year growth 2024-2029 (%)
- Exhibits69: Data Table on Healthcare - Year-over-year growth 2024-2029 (%)
- Exhibits70: Chart on Retail and e-commerce - Market size and forecast 2024-2029 ($ million)
- Exhibits71: Data Table on Retail and e-commerce - Market size and forecast 2024-2029 ($ million)
- Exhibits72: Chart on Retail and e-commerce - Year-over-year growth 2024-2029 (%)
- Exhibits73: Data Table on Retail and e-commerce - Year-over-year growth 2024-2029 (%)
- Exhibits74: Chart on Manufacturing - Market size and forecast 2024-2029 ($ million)
- Exhibits75: Data Table on Manufacturing - Market size and forecast 2024-2029 ($ million)
- Exhibits76: Chart on Manufacturing - Year-over-year growth 2024-2029 (%)
- Exhibits77: Data Table on Manufacturing - Year-over-year growth 2024-2029 (%)
- Exhibits78: Chart on Others - Market size and forecast 2024-2029 ($ million)
- Exhibits79: Data Table on Others - Market size and forecast 2024-2029 ($ million)
- Exhibits80: Chart on Others - Year-over-year growth 2024-2029 (%)
- Exhibits81: Data Table on Others - Year-over-year growth 2024-2029 (%)
- Exhibits82: Market opportunity by End-user ($ million)
- Exhibits83: Data Table on Market opportunity by End-user ($ million)
- Exhibits84: Chart on Deployment - Market share 2024-2029 (%)
- Exhibits85: Data Table on Deployment - Market share 2024-2029 (%)
- Exhibits86: Chart on Comparison by Deployment
- Exhibits87: Data Table on Comparison by Deployment
- Exhibits88: Chart on Cloud-based - Market size and forecast 2024-2029 ($ million)
- Exhibits89: Data Table on Cloud-based - Market size and forecast 2024-2029 ($ million)
- Exhibits90: Chart on Cloud-based - Year-over-year growth 2024-2029 (%)
- Exhibits91: Data Table on Cloud-based - Year-over-year growth 2024-2029 (%)
- Exhibits92: Chart on On-premises - Market size and forecast 2024-2029 ($ million)
- Exhibits93: Data Table on On-premises - Market size and forecast 2024-2029 ($ million)
- Exhibits94: Chart on On-premises - Year-over-year growth 2024-2029 (%)
- Exhibits95: Data Table on On-premises - Year-over-year growth 2024-2029 (%)
- Exhibits96: Market opportunity by Deployment ($ million)
- Exhibits97: Data Table on Market opportunity by Deployment ($ million)
- Exhibits98: Chart on Application - Market share 2024-2029 (%)
- Exhibits99: Data Table on Application - Market share 2024-2029 (%)
- Exhibits100: Chart on Comparison by Application
- Exhibits101: Data Table on Comparison by Application
- Exhibits102: Chart on Energy management - Market size and forecast 2024-2029 ($ million)
- Exhibits103: Data Table on Energy management - Market size and forecast 2024-2029 ($ million)
- Exhibits104: Chart on Energy management - Year-over-year growth 2024-2029 (%)
- Exhibits105: Data Table on Energy management - Year-over-year growth 2024-2029 (%)
- Exhibits106: Chart on Carbon emission tracking - Market size and forecast 2024-2029 ($ million)
- Exhibits107: Data Table on Carbon emission tracking - Market size and forecast 2024-2029 ($ million)
- Exhibits108: Chart on Carbon emission tracking - Year-over-year growth 2024-2029 (%)
- Exhibits109: Data Table on Carbon emission tracking - Year-over-year growth 2024-2029 (%)
- Exhibits110: Chart on Climate risk assessment - Market size and forecast 2024-2029 ($ million)
- Exhibits111: Data Table on Climate risk assessment - Market size and forecast 2024-2029 ($ million)
- Exhibits112: Chart on Climate risk assessment - Year-over-year growth 2024-2029 (%)
- Exhibits113: Data Table on Climate risk assessment - Year-over-year growth 2024-2029 (%)
- Exhibits114: Chart on Smart agriculture - Market size and forecast 2024-2029 ($ million)
- Exhibits115: Data Table on Smart agriculture - Market size and forecast 2024-2029 ($ million)
- Exhibits116: Chart on Smart agriculture - Year-over-year growth 2024-2029 (%)
- Exhibits117: Data Table on Smart agriculture - Year-over-year growth 2024-2029 (%)
- Exhibits118: Chart on Others - Market size and forecast 2024-2029 ($ million)
- Exhibits119: Data Table on Others - Market size and forecast 2024-2029 ($ million)
- Exhibits120: Chart on Others - Year-over-year growth 2024-2029 (%)
- Exhibits121: Data Table on Others - Year-over-year growth 2024-2029 (%)
- Exhibits122: Market opportunity by Application ($ million)
- Exhibits123: Data Table on Market opportunity by Application ($ million)
- Exhibits124: Analysis of price sensitivity, lifecycle, customer purchase basket, adoption rates, and purchase criteria
- Exhibits125: Chart on Market share By Geographical Landscape 2024-2029 (%)
- Exhibits126: Data Table on Market share By Geographical Landscape 2024-2029 (%)
- Exhibits127: Chart on Geographic comparison
- Exhibits128: Data Table on Geographic comparison
- Exhibits129: Chart on North America - Market size and forecast 2024-2029 ($ million)
- Exhibits130: Data Table on North America - Market size and forecast 2024-2029 ($ million)
- Exhibits131: Chart on North America - Year-over-year growth 2024-2029 (%)
- Exhibits132: Data Table on North America - Year-over-year growth 2024-2029 (%)
- Exhibits133: Chart on Europe - Market size and forecast 2024-2029 ($ million)
- Exhibits134: Data Table on Europe - Market size and forecast 2024-2029 ($ million)
- Exhibits135: Chart on Europe - Year-over-year growth 2024-2029 (%)
- Exhibits136: Data Table on Europe - Year-over-year growth 2024-2029 (%)
- Exhibits137: Chart on APAC - Market size and forecast 2024-2029 ($ million)
- Exhibits138: Data Table on APAC - Market size and forecast 2024-2029 ($ million)
- Exhibits139: Chart on APAC - Year-over-year growth 2024-2029 (%)
- Exhibits140: Data Table on APAC - Year-over-year growth 2024-2029 (%)
- Exhibits141: Chart on South America - Market size and forecast 2024-2029 ($ million)
- Exhibits142: Data Table on South America - Market size and forecast 2024-2029 ($ million)
- Exhibits143: Chart on South America - Year-over-year growth 2024-2029 (%)
- Exhibits144: Data Table on South America - Year-over-year growth 2024-2029 (%)
- Exhibits145: Chart on Middle East and Africa - Market size and forecast 2024-2029 ($ million)
- Exhibits146: Data Table on Middle East and Africa - Market size and forecast 2024-2029 ($ million)
- Exhibits147: Chart on Middle East and Africa - Year-over-year growth 2024-2029 (%)
- Exhibits148: Data Table on Middle East and Africa - Year-over-year growth 2024-2029 (%)
- Exhibits149: Chart on US - Market size and forecast 2024-2029 ($ million)
- Exhibits150: Data Table on US - Market size and forecast 2024-2029 ($ million)
- Exhibits151: Chart on US - Year-over-year growth 2024-2029 (%)
- Exhibits152: Data Table on US - Year-over-year growth 2024-2029 (%)
- Exhibits153: Chart on China - Market size and forecast 2024-2029 ($ million)
- Exhibits154: Data Table on China - Market size and forecast 2024-2029 ($ million)
- Exhibits155: Chart on China - Year-over-year growth 2024-2029 (%)
- Exhibits156: Data Table on China - Year-over-year growth 2024-2029 (%)
- Exhibits157: Chart on Germany - Market size and forecast 2024-2029 ($ million)
- Exhibits158: Data Table on Germany - Market size and forecast 2024-2029 ($ million)
- Exhibits159: Chart on Germany - Year-over-year growth 2024-2029 (%)
- Exhibits160: Data Table on Germany - Year-over-year growth 2024-2029 (%)
- Exhibits161: Chart on Canada - Market size and forecast 2024-2029 ($ million)
- Exhibits162: Data Table on Canada - Market size and forecast 2024-2029 ($ million)
- Exhibits163: Chart on Canada - Year-over-year growth 2024-2029 (%)
- Exhibits164: Data Table on Canada - Year-over-year growth 2024-2029 (%)
- Exhibits165: Chart on UK - Market size and forecast 2024-2029 ($ million)
- Exhibits166: Data Table on UK - Market size and forecast 2024-2029 ($ million)
- Exhibits167: Chart on UK - Year-over-year growth 2024-2029 (%)
- Exhibits168: Data Table on UK - Year-over-year growth 2024-2029 (%)
- Exhibits169: Chart on India - Market size and forecast 2024-2029 ($ million)
- Exhibits170: Data Table on India - Market size and forecast 2024-2029 ($ million)
- Exhibits171: Chart on India - Year-over-year growth 2024-2029 (%)
- Exhibits172: Data Table on India - Year-over-year growth 2024-2029 (%)
- Exhibits173: Chart on France - Market size and forecast 2024-2029 ($ million)
- Exhibits174: Data Table on France - Market size and forecast 2024-2029 ($ million)
- Exhibits175: Chart on France - Year-over-year growth 2024-2029 (%)
- Exhibits176: Data Table on France - Year-over-year growth 2024-2029 (%)
- Exhibits177: Chart on The Netherlands - Market size and forecast 2024-2029 ($ million)
- Exhibits178: Data Table on The Netherlands - Market size and forecast 2024-2029 ($ million)
- Exhibits179: Chart on The Netherlands - Year-over-year growth 2024-2029 (%)
- Exhibits180: Data Table on The Netherlands - Year-over-year growth 2024-2029 (%)
- Exhibits181: Chart on Mexico - Market size and forecast 2024-2029 ($ million)
- Exhibits182: Data Table on Mexico - Market size and forecast 2024-2029 ($ million)
- Exhibits183: Chart on Mexico - Year-over-year growth 2024-2029 (%)
- Exhibits184: Data Table on Mexico - Year-over-year growth 2024-2029 (%)
- Exhibits185: Chart on Japan - Market size and forecast 2024-2029 ($ million)
- Exhibits186: Data Table on Japan - Market size and forecast 2024-2029 ($ million)
- Exhibits187: Chart on Japan - Year-over-year growth 2024-2029 (%)
- Exhibits188: Data Table on Japan - Year-over-year growth 2024-2029 (%)
- Exhibits189: Market opportunity By Geographical Landscape ($ million)
- Exhibits190: Data Tables on Market opportunity By Geographical Landscape ($ million)
- Exhibits191: Impact of drivers and challenges in 2024 and 2029
- Exhibits192: Overview on criticality of inputs and factors of differentiation
- Exhibits193: Overview on factors of disruption
- Exhibits194: Impact of key risks on business
- Exhibits195: Companies covered
- Exhibits196: Company ranking index
- Exhibits197: Matrix on companies position and classification
- Exhibits198: Amazon.com Inc. - Overview
- Exhibits199: Amazon.com Inc. - Business segments
- Exhibits200: Amazon.com Inc. - Key news
- Exhibits201: Amazon.com Inc. - Key offerings
- Exhibits202: Amazon.com Inc. - Segment focus
- Exhibits203: SWOT
- Exhibits204: Apple Inc. - Overview
- Exhibits205: Apple Inc. - Business segments
- Exhibits206: Apple Inc. - Key news
- Exhibits207: Apple Inc. - Key offerings
- Exhibits208: Apple Inc. - Segment focus
- Exhibits209: SWOT
- Exhibits210: C3.ai Inc. - Overview
- Exhibits211: C3.ai Inc. - Product / Service
- Exhibits212: C3.ai Inc. - Key news
- Exhibits213: C3.ai Inc. - Key offerings
- Exhibits214: SWOT
- Exhibits215: Cisco Systems Inc. - Overview
- Exhibits216: Cisco Systems Inc. - Business segments
- Exhibits217: Cisco Systems Inc. - Key news
- Exhibits218: Cisco Systems Inc. - Key offerings
- Exhibits219: Cisco Systems Inc. - Segment focus
- Exhibits220: SWOT
- Exhibits221: Google LLC - Overview
- Exhibits222: Google LLC - Product / Service
- Exhibits223: Google LLC - Key offerings
- Exhibits224: SWOT
- Exhibits225: Intel Corp. - Overview
- Exhibits226: Intel Corp. - Business segments
- Exhibits227: Intel Corp. - Key news
- Exhibits228: Intel Corp. - Key offerings
- Exhibits229: Intel Corp. - Segment focus
- Exhibits230: SWOT
- Exhibits231: International Business Machines Corp. - Overview
- Exhibits232: International Business Machines Corp. - Business segments
- Exhibits233: International Business Machines Corp. - Key news
- Exhibits234: International Business Machines Corp. - Key offerings
- Exhibits235: International Business Machines Corp. - Segment focus
- Exhibits236: SWOT
- Exhibits237: Meta Platforms Inc. - Overview
- Exhibits238: Meta Platforms Inc. - Business segments
- Exhibits239: Meta Platforms Inc. - Key offerings
- Exhibits240: Meta Platforms Inc. - Segment focus
- Exhibits241: SWOT
- Exhibits242: Microsoft Corp. - Overview
- Exhibits243: Microsoft Corp. - Business segments
- Exhibits244: Microsoft Corp. - Key news
- Exhibits245: Microsoft Corp. - Key offerings
- Exhibits246: Microsoft Corp. - Segment focus
- Exhibits247: SWOT
- Exhibits248: OpenAI - Overview
- Exhibits249: OpenAI - Product / Service
- Exhibits250: OpenAI - Key offerings
- Exhibits251: SWOT
- Exhibits252: Pachama, Inc. - Overview
- Exhibits253: Pachama, Inc. - Product / Service
- Exhibits254: Pachama, Inc. - Key offerings
- Exhibits255: SWOT
- Exhibits256: Planet Labs PBC - Overview
- Exhibits257: Planet Labs PBC - Product / Service
- Exhibits258: Planet Labs PBC - Key offerings
- Exhibits259: SWOT
- Exhibits260: Samsung Electronics Co. Ltd. - Overview
- Exhibits261: Samsung Electronics Co. Ltd. - Business segments
- Exhibits262: Samsung Electronics Co. Ltd. - Key news
- Exhibits263: Samsung Electronics Co. Ltd. - Key offerings
- Exhibits264: Samsung Electronics Co. Ltd. - Segment focus
- Exhibits265: SWOT
- Exhibits266: Sylvera - Overview
- Exhibits267: Sylvera - Product / Service
- Exhibits268: Sylvera - Key offerings
- Exhibits269: SWOT
- Exhibits270: Tesla Inc. - Overview
- Exhibits271: Tesla Inc. - Business segments
- Exhibits272: Tesla Inc. - Key news
- Exhibits273: Tesla Inc. - Key offerings
- Exhibits274: Tesla Inc. - Segment focus
- Exhibits275: SWOT
- Exhibits276: Inclusions checklist
- Exhibits277: Exclusions checklist
- Exhibits278: Currency conversion rates for US$
- Exhibits279: Research methodology
- Exhibits280: Information sources
- Exhibits281: Data validation
- Exhibits282: Validation techniques employed for market sizing
- Exhibits283: Data synthesis
- Exhibits284: 360 degree market analysis
- Exhibits285: List of abbreviations
The sustainable ai market is forecasted to grow by USD 1,553.1 mn during 2024-2029, accelerating at a CAGR of 29.3% during the forecast period. The report on the sustainable ai market provides a holistic analysis, market size and forecast, trends, growth drivers, and challenges, as well as vendor analysis covering around 25 vendors.
The report offers an up-to-date analysis regarding the current market scenario, the latest trends and drivers, and the overall market environment. The market is driven by proliferation of stringent regulatory frameworks and reporting mandates, economic imperatives and tangible return on investment, and accelerated technological advancement and accessibility.
| Market Scope | |
|---|---|
| Base Year | 2025 |
| End Year | 2029 |
| Series Year | 2025-2029 |
| Growth Momentum | Accelerate |
| YOY 2025 | 27% |
| CAGR | 29.3% |
| Incremental Value | $1,553.1 mn |
The study was conducted using an objective combination of primary and secondary information including inputs from key participants in the industry. The report contains a comprehensive market size data, segment with regional analysis and vendor landscape in addition to an analysis of the key companies. Reports have historic and forecast data.
Technavio's sustainable ai market is segmented as below:
By Technology
- Machine learning
- Natural language processing
- Deep learning
- Others
By End-user
- Healthcare
- Retail and e-commerce
- Manufacturing
- Others
By Deployment
- Cloud-based
- On-premises
By Application
- Energy management
- Carbon emission tracking
- Climate risk assessment
- Smart agriculture
- Others
By Geographical Landscape
- North America
- Europe
- APAC
- South America
- Middle East and Africa
This study identifies the emergence of generative ai as catalyst for sustainability solutions as one of the prime reasons driving the sustainable ai market growth during the next few years. Also, integration of digital twins and ai for systemic decarbonization and strategic imperative of green ai and energy efficient infrastructure will lead to sizable demand in the market.
The report on the sustainable ai market covers the following areas:
- Sustainable AI Market sizing
- Sustainable AI Market forecast
- Sustainable AI Market industry analysis
The robust vendor analysis is designed to help clients improve their market position, and in line with this, this report provides a detailed analysis of several leading sustainable ai market vendors that include Amazon.com Inc., Apple Inc., Baidu Inc., Blue River Technology, C3.ai Inc., Circular Computing, Cisco Systems Inc., Google LLC, Intel Corp., International Business Machines Corp., Meta Platforms Inc., Microsoft Corp., OpenAI, Pachama, Inc., Planet Labs PBC, Samsung Electronics Co. Ltd., Sylvera, Tesla Inc., Verdigris Technologies Inc., and Watershed Technology Inc.. Also, the sustainable ai market analysis report includes information on upcoming trends and challenges that will influence market growth. This is to help companies strategize and leverage all forthcoming growth opportunities.
The publisher presents a detailed picture of the market by the way of study, synthesis, and summation of data from multiple sources by an analysis of key parameters such as profit, pricing, competition, and promotions. It presents various market facets by identifying the key industry influencers. The data presented is comprehensive, reliable, and a result of extensive primary and secondary research. The market research reports provide a complete competitive landscape and an in-depth vendor selection methodology and analysis using qualitative and quantitative research to forecast accurate market growth.
Table of Contents
1 Executive Summary
- 1.1 Market overview
- Executive Summary - Chart on Market Overview
- Executive Summary - Data Table on Market Overview
- Executive Summary - Chart on Global Market Characteristics
- Executive Summary - Chart on Market By Geographical Landscape
- Executive Summary - Chart on Market Segmentation by Technology
- Executive Summary - Chart on Market Segmentation by End-user
- Executive Summary - Chart on Market Segmentation by Deployment
- Executive Summary - Chart on Market Segmentation by Application
- Executive Summary - Chart on Incremental Growth
- Executive Summary - Data Table on Incremental Growth
- Executive Summary - Chart on Company Market Positioning
2 Technavio Analysis
- 2.1 Analysis of price sensitivity, lifecycle, customer purchase basket, adoption rates, and purchase criteria
- Analysis of price sensitivity, lifecycle, customer purchase basket, adoption rates, and purchase criteria
- 2.2 Criticality of inputs and Factors of differentiation
- Overview on criticality of inputs and factors of differentiation
- 2.3 Factors of disruption
- Overview on factors of disruption
- 2.4 Impact of drivers and challenges
- Impact of drivers and challenges in 2024 and 2029
3 Market Landscape
- 3.1 Market ecosystem
- Parent Market
- Data Table on - Parent Market
- 3.2 Market characteristics
- Market characteristics analysis
- 3.3 Value chain analysis
- Value chain analysis
4 Market Sizing
- 4.1 Market definition
- Offerings of companies included in the market definition
- 4.2 Market segment analysis
- Market segments
- 4.3 Market size 2024
- 4.4 Market outlook: Forecast for 2024-2029
- Chart on Global - Market size and forecast 2024-2029 ($ million)
- Data Table on Global - Market size and forecast 2024-2029 ($ million)
- Chart on Global Market: Year-over-year growth 2024-2029 (%)
- Data Table on Global Market: Year-over-year growth 2024-2029 (%)
5 Historic Market Size
- 5.1 Global Sustainable AI Market 2019 - 2023
- Historic Market Size - Data Table on Global Sustainable AI Market 2019 - 2023 ($ million)
- 5.2 Technology segment analysis 2019 - 2023
- Historic Market Size - Technology Segment 2019 - 2023 ($ million)
- 5.3 End-user segment analysis 2019 - 2023
- Historic Market Size - End-user Segment 2019 - 2023 ($ million)
- 5.4 Deployment segment analysis 2019 - 2023
- Historic Market Size - Deployment Segment 2019 - 2023 ($ million)
- 5.5 Application segment analysis 2019 - 2023
- Historic Market Size - Application Segment 2019 - 2023 ($ million)
- 5.6 Geography segment analysis 2019 - 2023
- Historic Market Size - Geography Segment 2019 - 2023 ($ million)
- 5.7 Country segment analysis 2019 - 2023
- Historic Market Size - Country Segment 2019 - 2023 ($ million)
6 Five Forces Analysis
- 6.1 Five forces summary
- Five forces analysis - Comparison between 2024 and 2029
- 6.2 Bargaining power of buyers
- Bargaining power of buyers - Impact of key factors 2024 and 2029
- 6.3 Bargaining power of suppliers
- Bargaining power of suppliers - Impact of key factors in 2024 and 2029
- 6.4 Threat of new entrants
- Threat of new entrants - Impact of key factors in 2024 and 2029
- 6.5 Threat of substitutes
- Threat of substitutes - Impact of key factors in 2024 and 2029
- 6.6 Threat of rivalry
- Threat of rivalry - Impact of key factors in 2024 and 2029
- 6.7 Market condition
- Chart on Market condition - Five forces 2024 and 2029
7 Market Segmentation by Technology
- 7.1 Market segments
- Chart on Technology - Market share 2024-2029 (%)
- Data Table on Technology - Market share 2024-2029 (%)
- 7.2 Comparison by Technology
- Chart on Comparison by Technology
- Data Table on Comparison by Technology
- 7.3 Machine learning - Market size and forecast 2024-2029
- Chart on Machine learning - Market size and forecast 2024-2029 ($ million)
- Data Table on Machine learning - Market size and forecast 2024-2029 ($ million)
- Chart on Machine learning - Year-over-year growth 2024-2029 (%)
- Data Table on Machine learning - Year-over-year growth 2024-2029 (%)
- 7.4 Natural language processing - Market size and forecast 2024-2029
- Chart on Natural language processing - Market size and forecast 2024-2029 ($ million)
- Data Table on Natural language processing - Market size and forecast 2024-2029 ($ million)
- Chart on Natural language processing - Year-over-year growth 2024-2029 (%)
- Data Table on Natural language processing - Year-over-year growth 2024-2029 (%)
- 7.5 Deep learning - Market size and forecast 2024-2029
- Chart on Deep learning - Market size and forecast 2024-2029 ($ million)
- Data Table on Deep learning - Market size and forecast 2024-2029 ($ million)
- Chart on Deep learning - Year-over-year growth 2024-2029 (%)
- Data Table on Deep learning - Year-over-year growth 2024-2029 (%)
- 7.6 Others - Market size and forecast 2024-2029
- Chart on Others - Market size and forecast 2024-2029 ($ million)
- Data Table on Others - Market size and forecast 2024-2029 ($ million)
- Chart on Others - Year-over-year growth 2024-2029 (%)
- Data Table on Others - Year-over-year growth 2024-2029 (%)
- 7.7 Market opportunity by Technology
- Market opportunity by Technology ($ million)
- Data Table on Market opportunity by Technology ($ million)
8 Market Segmentation by End-user
- 8.1 Market segments
- Chart on End-user - Market share 2024-2029 (%)
- Data Table on End-user - Market share 2024-2029 (%)
- 8.2 Comparison by End-user
- Chart on Comparison by End-user
- Data Table on Comparison by End-user
- 8.3 Healthcare - Market size and forecast 2024-2029
- Chart on Healthcare - Market size and forecast 2024-2029 ($ million)
- Data Table on Healthcare - Market size and forecast 2024-2029 ($ million)
- Chart on Healthcare - Year-over-year growth 2024-2029 (%)
- Data Table on Healthcare - Year-over-year growth 2024-2029 (%)
- 8.4 Retail and e-commerce - Market size and forecast 2024-2029
- Chart on Retail and e-commerce - Market size and forecast 2024-2029 ($ million)
- Data Table on Retail and e-commerce - Market size and forecast 2024-2029 ($ million)
- Chart on Retail and e-commerce - Year-over-year growth 2024-2029 (%)
- Data Table on Retail and e-commerce - Year-over-year growth 2024-2029 (%)
- 8.5 Manufacturing - Market size and forecast 2024-2029
- Chart on Manufacturing - Market size and forecast 2024-2029 ($ million)
- Data Table on Manufacturing - Market size and forecast 2024-2029 ($ million)
- Chart on Manufacturing - Year-over-year growth 2024-2029 (%)
- Data Table on Manufacturing - Year-over-year growth 2024-2029 (%)
- 8.6 Others - Market size and forecast 2024-2029
- Chart on Others - Market size and forecast 2024-2029 ($ million)
- Data Table on Others - Market size and forecast 2024-2029 ($ million)
- Chart on Others - Year-over-year growth 2024-2029 (%)
- Data Table on Others - Year-over-year growth 2024-2029 (%)
- 8.7 Market opportunity by End-user
- Market opportunity by End-user ($ million)
- Data Table on Market opportunity by End-user ($ million)
9 Market Segmentation by Deployment
- 9.1 Market segments
- Chart on Deployment - Market share 2024-2029 (%)
- Data Table on Deployment - Market share 2024-2029 (%)
- 9.2 Comparison by Deployment
- Chart on Comparison by Deployment
- Data Table on Comparison by Deployment
- 9.3 Cloud-based - Market size and forecast 2024-2029
- Chart on Cloud-based - Market size and forecast 2024-2029 ($ million)
- Data Table on Cloud-based - Market size and forecast 2024-2029 ($ million)
- Chart on Cloud-based - Year-over-year growth 2024-2029 (%)
- Data Table on Cloud-based - Year-over-year growth 2024-2029 (%)
- 9.4 On-premises - Market size and forecast 2024-2029
- Chart on On-premises - Market size and forecast 2024-2029 ($ million)
- Data Table on On-premises - Market size and forecast 2024-2029 ($ million)
- Chart on On-premises - Year-over-year growth 2024-2029 (%)
- Data Table on On-premises - Year-over-year growth 2024-2029 (%)
- 9.5 Market opportunity by Deployment
- Market opportunity by Deployment ($ million)
- Data Table on Market opportunity by Deployment ($ million)
10 Market Segmentation by Application
- 10.1 Market segments
- Chart on Application - Market share 2024-2029 (%)
- Data Table on Application - Market share 2024-2029 (%)
- 10.2 Comparison by Application
- Chart on Comparison by Application
- Data Table on Comparison by Application
- 10.3 Energy management - Market size and forecast 2024-2029
- Chart on Energy management - Market size and forecast 2024-2029 ($ million)
- Data Table on Energy management - Market size and forecast 2024-2029 ($ million)
- Chart on Energy management - Year-over-year growth 2024-2029 (%)
- Data Table on Energy management - Year-over-year growth 2024-2029 (%)
- 10.4 Carbon emission tracking - Market size and forecast 2024-2029
- Chart on Carbon emission tracking - Market size and forecast 2024-2029 ($ million)
- Data Table on Carbon emission tracking - Market size and forecast 2024-2029 ($ million)
- Chart on Carbon emission tracking - Year-over-year growth 2024-2029 (%)
- Data Table on Carbon emission tracking - Year-over-year growth 2024-2029 (%)
- 10.5 Climate risk assessment - Market size and forecast 2024-2029
- Chart on Climate risk assessment - Market size and forecast 2024-2029 ($ million)
- Data Table on Climate risk assessment - Market size and forecast 2024-2029 ($ million)
- Chart on Climate risk assessment - Year-over-year growth 2024-2029 (%)
- Data Table on Climate risk assessment - Year-over-year growth 2024-2029 (%)
- 10.6 Smart agriculture - Market size and forecast 2024-2029
- Chart on Smart agriculture - Market size and forecast 2024-2029 ($ million)
- Data Table on Smart agriculture - Market size and forecast 2024-2029 ($ million)
- Chart on Smart agriculture - Year-over-year growth 2024-2029 (%)
- Data Table on Smart agriculture - Year-over-year growth 2024-2029 (%)
- 10.7 Others - Market size and forecast 2024-2029
- Chart on Others - Market size and forecast 2024-2029 ($ million)
- Data Table on Others - Market size and forecast 2024-2029 ($ million)
- Chart on Others - Year-over-year growth 2024-2029 (%)
- Data Table on Others - Year-over-year growth 2024-2029 (%)
- 10.8 Market opportunity by Application
- Market opportunity by Application ($ million)
- Data Table on Market opportunity by Application ($ million)
11 Customer Landscape
- 11.1 Customer landscape overview
- Analysis of price sensitivity, lifecycle, customer purchase basket, adoption rates, and purchase criteria
12 Geographic Landscape
- 12.1 Geographic segmentation
- Chart on Market share By Geographical Landscape 2024-2029 (%)
- Data Table on Market share By Geographical Landscape 2024-2029 (%)
- 12.2 Geographic comparison
- Chart on Geographic comparison
- Data Table on Geographic comparison
- 12.3 North America - Market size and forecast 2024-2029
- Chart on North America - Market size and forecast 2024-2029 ($ million)
- Data Table on North America - Market size and forecast 2024-2029 ($ million)
- Chart on North America - Year-over-year growth 2024-2029 (%)
- Data Table on North America - Year-over-year growth 2024-2029 (%)
- 12.4 Europe - Market size and forecast 2024-2029
- Chart on Europe - Market size and forecast 2024-2029 ($ million)
- Data Table on Europe - Market size and forecast 2024-2029 ($ million)
- Chart on Europe - Year-over-year growth 2024-2029 (%)
- Data Table on Europe - Year-over-year growth 2024-2029 (%)
- 12.5 APAC - Market size and forecast 2024-2029
- Chart on APAC - Market size and forecast 2024-2029 ($ million)
- Data Table on APAC - Market size and forecast 2024-2029 ($ million)
- Chart on APAC - Year-over-year growth 2024-2029 (%)
- Data Table on APAC - Year-over-year growth 2024-2029 (%)
- 12.6 South America - Market size and forecast 2024-2029
- Chart on South America - Market size and forecast 2024-2029 ($ million)
- Data Table on South America - Market size and forecast 2024-2029 ($ million)
- Chart on South America - Year-over-year growth 2024-2029 (%)
- Data Table on South America - Year-over-year growth 2024-2029 (%)
- 12.7 Middle East and Africa - Market size and forecast 2024-2029
- Chart on Middle East and Africa - Market size and forecast 2024-2029 ($ million)
- Data Table on Middle East and Africa - Market size and forecast 2024-2029 ($ million)
- Chart on Middle East and Africa - Year-over-year growth 2024-2029 (%)
- Data Table on Middle East and Africa - Year-over-year growth 2024-2029 (%)
- 12.8 US - Market size and forecast 2024-2029
- Chart on US - Market size and forecast 2024-2029 ($ million)
- Data Table on US - Market size and forecast 2024-2029 ($ million)
- Chart on US - Year-over-year growth 2024-2029 (%)
- Data Table on US - Year-over-year growth 2024-2029 (%)
- 12.9 China - Market size and forecast 2024-2029
- Chart on China - Market size and forecast 2024-2029 ($ million)
- Data Table on China - Market size and forecast 2024-2029 ($ million)
- Chart on China - Year-over-year growth 2024-2029 (%)
- Data Table on China - Year-over-year growth 2024-2029 (%)
- 12.10 Germany - Market size and forecast 2024-2029
- Chart on Germany - Market size and forecast 2024-2029 ($ million)
- Data Table on Germany - Market size and forecast 2024-2029 ($ million)
- Chart on Germany - Year-over-year growth 2024-2029 (%)
- Data Table on Germany - Year-over-year growth 2024-2029 (%)
- 12.11 Canada - Market size and forecast 2024-2029
- Chart on Canada - Market size and forecast 2024-2029 ($ million)
- Data Table on Canada - Market size and forecast 2024-2029 ($ million)
- Chart on Canada - Year-over-year growth 2024-2029 (%)
- Data Table on Canada - Year-over-year growth 2024-2029 (%)
- 12.12 UK - Market size and forecast 2024-2029
- Chart on UK - Market size and forecast 2024-2029 ($ million)
- Data Table on UK - Market size and forecast 2024-2029 ($ million)
- Chart on UK - Year-over-year growth 2024-2029 (%)
- Data Table on UK - Year-over-year growth 2024-2029 (%)
- 12.13 India - Market size and forecast 2024-2029
- Chart on India - Market size and forecast 2024-2029 ($ million)
- Data Table on India - Market size and forecast 2024-2029 ($ million)
- Chart on India - Year-over-year growth 2024-2029 (%)
- Data Table on India - Year-over-year growth 2024-2029 (%)
- 12.14 France - Market size and forecast 2024-2029
- Chart on France - Market size and forecast 2024-2029 ($ million)
- Data Table on France - Market size and forecast 2024-2029 ($ million)
- Chart on France - Year-over-year growth 2024-2029 (%)
- Data Table on France - Year-over-year growth 2024-2029 (%)
- 12.15 The Netherlands - Market size and forecast 2024-2029
- Chart on The Netherlands - Market size and forecast 2024-2029 ($ million)
- Data Table on The Netherlands - Market size and forecast 2024-2029 ($ million)
- Chart on The Netherlands - Year-over-year growth 2024-2029 (%)
- Data Table on The Netherlands - Year-over-year growth 2024-2029 (%)
- 12.16 Mexico - Market size and forecast 2024-2029
- Chart on Mexico - Market size and forecast 2024-2029 ($ million)
- Data Table on Mexico - Market size and forecast 2024-2029 ($ million)
- Chart on Mexico - Year-over-year growth 2024-2029 (%)
- Data Table on Mexico - Year-over-year growth 2024-2029 (%)
- 12.17 Japan - Market size and forecast 2024-2029
- Chart on Japan - Market size and forecast 2024-2029 ($ million)
- Data Table on Japan - Market size and forecast 2024-2029 ($ million)
- Chart on Japan - Year-over-year growth 2024-2029 (%)
- Data Table on Japan - Year-over-year growth 2024-2029 (%)
- 12.18 Market opportunity By Geographical Landscape
- Market opportunity By Geographical Landscape ($ million)
- Data Tables on Market opportunity By Geographical Landscape ($ million)
13 Drivers, Challenges, and Opportunity/Restraints
- 13.1 Market drivers
- 13.2 Market challenges
- 13.3 Impact of drivers and challenges
- Impact of drivers and challenges in 2024 and 2029
- 13.4 Market opportunities/restraints
14 Competitive Landscape
- 14.1 Overview
- 14.2 Competitive Landscape
- Overview on criticality of inputs and factors of differentiation
- 14.3 Landscape disruption
- Overview on factors of disruption
- 14.4 Industry risks
- Impact of key risks on business
15 Competitive Analysis
- 15.1 Companies profiled
- Companies covered
- 15.2 Company ranking index
- Company ranking index
- 15.3 Market positioning of companies
- Matrix on companies position and classification
- 15.4 Amazon.com Inc.
- Amazon.com Inc. - Overview
- Amazon.com Inc. - Business segments
- Amazon.com Inc. - Key news
- Amazon.com Inc. - Key offerings
- Amazon.com Inc. - Segment focus
- SWOT
- 15.5 Apple Inc.
- Apple Inc. - Overview
- Apple Inc. - Business segments
- Apple Inc. - Key news
- Apple Inc. - Key offerings
- Apple Inc. - Segment focus
- SWOT
- 15.6 C3.ai Inc.
- C3.ai Inc. - Overview
- C3.ai Inc. - Product / Service
- C3.ai Inc. - Key news
- C3.ai Inc. - Key offerings
- SWOT
- 15.7 Cisco Systems Inc.
- Cisco Systems Inc. - Overview
- Cisco Systems Inc. - Business segments
- Cisco Systems Inc. - Key news
- Cisco Systems Inc. - Key offerings
- Cisco Systems Inc. - Segment focus
- SWOT
- 15.8 Google LLC
- Google LLC - Overview
- Google LLC - Product / Service
- Google LLC - Key offerings
- SWOT
- 15.9 Intel Corp.
- Intel Corp. - Overview
- Intel Corp. - Business segments
- Intel Corp. - Key news
- Intel Corp. - Key offerings
- Intel Corp. - Segment focus
- SWOT
- 15.10 International Business Machines Corp.
- International Business Machines Corp. - Overview
- International Business Machines Corp. - Business segments
- International Business Machines Corp. - Key news
- International Business Machines Corp. - Key offerings
- International Business Machines Corp. - Segment focus
- SWOT
- 15.11 Meta Platforms Inc.
- Meta Platforms Inc. - Overview
- Meta Platforms Inc. - Business segments
- Meta Platforms Inc. - Key offerings
- Meta Platforms Inc. - Segment focus
- SWOT
- 15.12 Microsoft Corp.
- Microsoft Corp. - Overview
- Microsoft Corp. - Business segments
- Microsoft Corp. - Key news
- Microsoft Corp. - Key offerings
- Microsoft Corp. - Segment focus
- SWOT
- 15.13 OpenAI
- OpenAI - Overview
- OpenAI - Product / Service
- OpenAI - Key offerings
- SWOT
- 15.14 Pachama, Inc.
- Pachama, Inc. - Overview
- Pachama, Inc. - Product / Service
- Pachama, Inc. - Key offerings
- SWOT
- 15.15 Planet Labs PBC
- Planet Labs PBC - Overview
- Planet Labs PBC - Product / Service
- Planet Labs PBC - Key offerings
- SWOT
- 15.16 Samsung Electronics Co. Ltd.
- Samsung Electronics Co. Ltd. - Overview
- Samsung Electronics Co. Ltd. - Business segments
- Samsung Electronics Co. Ltd. - Key news
- Samsung Electronics Co. Ltd. - Key offerings
- Samsung Electronics Co. Ltd. - Segment focus
- SWOT
- 15.17 Sylvera
- Sylvera - Overview
- Sylvera - Product / Service
- Sylvera - Key offerings
- SWOT
- 15.18 Tesla Inc.
- Tesla Inc. - Overview
- Tesla Inc. - Business segments
- Tesla Inc. - Key news
- Tesla Inc. - Key offerings
- Tesla Inc. - Segment focus
- SWOT
16 Appendix
- 16.1 Scope of the report
- 16.2 Inclusions and exclusions checklist
- Inclusions checklist
- Exclusions checklist
- 16.3 Currency conversion rates for US$
- Currency conversion rates for US$
- 16.4 Research methodology
- Research methodology
- 16.5 Data procurement
- Information sources
- 16.6 Data validation
- Data validation
- 16.7 Validation techniques employed for market sizing
- Validation techniques employed for market sizing
- 16.8 Data synthesis
- Data synthesis
- 16.9 360 degree market analysis
- 360 degree market analysis
- 16.10 List of abbreviations
- List of abbreviations

