|
|
市場調査レポート
商品コード
1727168
日本の半導体デバイス市場 2025~2029年Semiconductor Device Market in Japan 2025-2029 |
||||||

|
|||||||
カスタマイズ可能
|
|||||||


| 日本の半導体デバイス市場 2025~2029年 |
|
出版日: 2025年05月14日
発行: TechNavio
ページ情報: 英文 176 Pages
納期: 即納可能
|

全表示
- 概要
- 図表
- 目次
日本の半導体デバイス市場は2024-2029年に125億2,780万米ドル、予測期間中のCAGRは9%で成長すると予測されます。
当レポートでは、日本の半導体デバイス市場について、市場規模・予測、動向、成長促進要因、ベンダー分析(約25社)を包括的に分析しています。
現在の市場シナリオ、最新動向と促進要因、市場環境全体に関する最新分析を提供しています。市場は、高電力密度デバイスの需要増加、市場参入企業間の戦略的提携、半導体デバイスの開発を支援する政府のイニシアチブによって牽引されています。
本調査は、業界の主要参加者からのインプットを含め、一次情報と二次情報を客観的に組み合わせて実施しました。レポートには、主要企業の分析に加え、包括的な市場規模データ、地域別分析によるセグメント、ベンダー情勢が含まれています。レポートには過去データと予測データを掲載しています。
| 市場範囲 | |
|---|---|
| 基準年 | 2025 |
| 終了年 | 2029 |
| 予測期間 | 2025-2029 |
| 成長モメンタム | 加速 |
| 前年比 | 8% |
| CAGR | 9% |
| 増分額 | 125億2,780万米ドル |
本調査では、今後数年間の日本の半導体デバイス市場の成長を牽引する主な要因の一つとして、日本における5g技術への投資の拡大を挙げています。また、自動車産業におけるADASの使用増加や低価格通信デバイスの採用増加も、市場の大きな需要につながります。
目次
第1章 エグゼクティブサマリー
- 市場概要
第2章 Technavio分析
- 価格・ライフサイクル・顧客購入バスケット・採用率・購入基準の分析
- インプットの重要性と差別化の要因
- 混乱の要因
- 促進要因と課題の影響
第3章 市場情勢
- 市場エコシステム
- 市場の特徴
- バリューチェーン分析
第4章 市場規模
- 市場の定義
- 市場セグメント分析
- 市場規模 2024
- 市場の見通し 2024-2029
第5章 市場規模実績
- 日本の半導体デバイス市場 2019-2023
- 用途別セグメント分析 2019-2023
- デバイス別セグメント分析 2019-2023
- 素材別セグメント分析 2019-2023
第6章 定性分析
- AIの影響:日本の半導体デバイス市場
第7章 ファイブフォース分析
- ファイブフォースの要約
- 買い手の交渉力
- 供給企業の交渉力
- 新規参入業者の脅威
- 代替品の脅威
- 競争の脅威
- 市況
第8章 市場セグメンテーション:用途別
- 市場セグメント
- 比較:用途別
- 家電:市場規模と予測 2024-2029
- コミュニケーション:市場規模と予測 2024-2029
- 自動車:市場規模と予測 2024-2029
- 医療機器:市場規模と予測 2024-2029
- その他:市場規模と予測 2024-2029
- 市場機会:用途別
第9章 市場セグメンテーション:デバイス別
- 市場セグメント
- 比較:デバイス別
- PMIC:市場規模と予測 2024-2029
- マイクロチップ:市場規模と予測 2024-2029
- RFID:市場規模と予測 2024-2029
- 市場機会:デバイス別
第10章 市場セグメンテーション:素材別
- 市場セグメント
- 比較:素材別
- シリコン:市場規模と予測 2024-2029
- ゲルマニウム:市場規模と予測 2024-2029
- ガリウムヒ素:市場規模と予測 2024-2029
- その他:市場規模と予測 2024-2029
- 市場機会:素材別
第11章 顧客情勢
- 顧客情勢の概要
第12章 促進要因・課題・機会・抑制要因
- 市場促進要因
- 市場の課題
- 促進要因と課題の影響
- 市場の機会・抑制要因
第13章 競合情勢
- 概要
- 競合情勢
- 混乱の状況
- 業界のリスク
第14章 競合分析
- 企業プロファイル
- 企業ランキング指数
- 企業の市場ポジショニング
- Advanced Micro Devices Inc.
- AOI ELECTRONICS CO.LTD.
- Infineon Technologies AG
- Intel Corp.
- Kyocera Corp.
- Micron Technology Inc.
- NVIDIA Corp.
- NXP Semiconductors NV
- Qualcomm Inc.
- Samsung Electronics Co. Ltd.
- Screen Holdings Co. Ltd
- Shindengen Electric Manufacturing Co. Ltd.
- STMicroelectronics NV
- Sumitomo Corp.
- Toshiba Corp.
第15章 付録
Exhibits:
- Exhibits1: Executive Summary - Chart on Market Overview
- Exhibits2: Executive Summary - Data Table on Market Overview
- Exhibits3: Executive Summary - Chart on Country Market Characteristics
- Exhibits4: Executive Summary - Chart on Market Segmentation by Application
- Exhibits5: Executive Summary - Chart on Market Segmentation by Device
- Exhibits6: Executive Summary - Chart on Market Segmentation by Material
- Exhibits7: Executive Summary - Chart on Company Market Positioning
- Exhibits8: Analysis of price sensitivity, lifecycle, customer purchase basket, adoption rates, and purchase criteria
- Exhibits9: Overview on criticality of inputs and factors of differentiation
- Exhibits10: Overview on factors of disruption
- Exhibits11: Impact of drivers and challenges in 2024 and 2029
- Exhibits12: Parent Market
- Exhibits13: Data Table on - Parent Market
- Exhibits14: Market characteristics analysis
- Exhibits15: Value chain analysis
- Exhibits16: Offerings of companies included in the market definition
- Exhibits17: Market segments
- Exhibits18: Chart on Japan - Market size and forecast 2024-2029 ($ million)
- Exhibits19: Data Table on Japan - Market size and forecast 2024-2029 ($ million)
- Exhibits20: Chart on Japan: Year-over-year growth 2024-2029 (%)
- Exhibits21: Data Table on Japan: Year-over-year growth 2024-2029 (%)
- Exhibits22: Historic Market Size - Data Table on Semiconductor Device Market in Japan 2019 - 2023 ($ million)
- Exhibits23: Historic Market Size - Application Segment 2019 - 2023 ($ million)
- Exhibits24: Historic Market Size - Device Segment 2019 - 2023 ($ million)
- Exhibits25: Historic Market Size - Material Segment 2019 - 2023 ($ million)
- Exhibits26: Five forces analysis - Comparison between 2024 and 2029
- Exhibits27: Bargaining power of buyers - Impact of key factors 2024 and 2029
- Exhibits28: Bargaining power of suppliers - Impact of key factors in 2024 and 2029
- Exhibits29: Threat of new entrants - Impact of key factors in 2024 and 2029
- Exhibits30: Threat of substitutes - Impact of key factors in 2024 and 2029
- Exhibits31: Threat of rivalry - Impact of key factors in 2024 and 2029
- Exhibits32: Chart on Market condition - Five forces 2024 and 2029
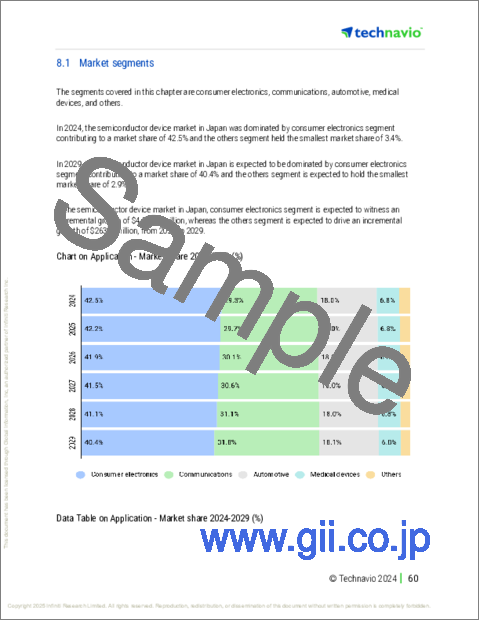
- Exhibits33: Chart on Application - Market share 2024-2029 (%)
- Exhibits34: Data Table on Application - Market share 2024-2029 (%)
- Exhibits35: Chart on Comparison by Application
- Exhibits36: Data Table on Comparison by Application
- Exhibits37: Chart on Consumer electronics - Market size and forecast 2024-2029 ($ million)
- Exhibits38: Data Table on Consumer electronics - Market size and forecast 2024-2029 ($ million)
- Exhibits39: Chart on Consumer electronics - Year-over-year growth 2024-2029 (%)
- Exhibits40: Data Table on Consumer electronics - Year-over-year growth 2024-2029 (%)
- Exhibits41: Chart on Communications - Market size and forecast 2024-2029 ($ million)
- Exhibits42: Data Table on Communications - Market size and forecast 2024-2029 ($ million)
- Exhibits43: Chart on Communications - Year-over-year growth 2024-2029 (%)
- Exhibits44: Data Table on Communications - Year-over-year growth 2024-2029 (%)
- Exhibits45: Chart on Automotive - Market size and forecast 2024-2029 ($ million)
- Exhibits46: Data Table on Automotive - Market size and forecast 2024-2029 ($ million)
- Exhibits47: Chart on Automotive - Year-over-year growth 2024-2029 (%)
- Exhibits48: Data Table on Automotive - Year-over-year growth 2024-2029 (%)
- Exhibits49: Chart on Medical devices - Market size and forecast 2024-2029 ($ million)
- Exhibits50: Data Table on Medical devices - Market size and forecast 2024-2029 ($ million)
- Exhibits51: Chart on Medical devices - Year-over-year growth 2024-2029 (%)
- Exhibits52: Data Table on Medical devices - Year-over-year growth 2024-2029 (%)
- Exhibits53: Chart on Others - Market size and forecast 2024-2029 ($ million)
- Exhibits54: Data Table on Others - Market size and forecast 2024-2029 ($ million)
- Exhibits55: Chart on Others - Year-over-year growth 2024-2029 (%)
- Exhibits56: Data Table on Others - Year-over-year growth 2024-2029 (%)
- Exhibits57: Market opportunity by Application ($ million)
- Exhibits58: Data Table on Market opportunity by Application ($ million)
- Exhibits59: Chart on Device - Market share 2024-2029 (%)
- Exhibits60: Data Table on Device - Market share 2024-2029 (%)
- Exhibits61: Chart on Comparison by Device
- Exhibits62: Data Table on Comparison by Device
- Exhibits63: Chart on PMIC - Market size and forecast 2024-2029 ($ million)
- Exhibits64: Data Table on PMIC - Market size and forecast 2024-2029 ($ million)
- Exhibits65: Chart on PMIC - Year-over-year growth 2024-2029 (%)
- Exhibits66: Data Table on PMIC - Year-over-year growth 2024-2029 (%)
- Exhibits67: Chart on Microchips - Market size and forecast 2024-2029 ($ million)
- Exhibits68: Data Table on Microchips - Market size and forecast 2024-2029 ($ million)
- Exhibits69: Chart on Microchips - Year-over-year growth 2024-2029 (%)
- Exhibits70: Data Table on Microchips - Year-over-year growth 2024-2029 (%)
- Exhibits71: Chart on RFID - Market size and forecast 2024-2029 ($ million)
- Exhibits72: Data Table on RFID - Market size and forecast 2024-2029 ($ million)
- Exhibits73: Chart on RFID - Year-over-year growth 2024-2029 (%)
- Exhibits74: Data Table on RFID - Year-over-year growth 2024-2029 (%)
- Exhibits75: Market opportunity by Device ($ million)
- Exhibits76: Data Table on Market opportunity by Device ($ million)
- Exhibits77: Chart on Material - Market share 2024-2029 (%)
- Exhibits78: Data Table on Material - Market share 2024-2029 (%)
- Exhibits79: Chart on Comparison by Material
- Exhibits80: Data Table on Comparison by Material
- Exhibits81: Chart on Silicon - Market size and forecast 2024-2029 ($ million)
- Exhibits82: Data Table on Silicon - Market size and forecast 2024-2029 ($ million)
- Exhibits83: Chart on Silicon - Year-over-year growth 2024-2029 (%)
- Exhibits84: Data Table on Silicon - Year-over-year growth 2024-2029 (%)
- Exhibits85: Chart on Germanium - Market size and forecast 2024-2029 ($ million)
- Exhibits86: Data Table on Germanium - Market size and forecast 2024-2029 ($ million)
- Exhibits87: Chart on Germanium - Year-over-year growth 2024-2029 (%)
- Exhibits88: Data Table on Germanium - Year-over-year growth 2024-2029 (%)
- Exhibits89: Chart on Gallium arsenide - Market size and forecast 2024-2029 ($ million)
- Exhibits90: Data Table on Gallium arsenide - Market size and forecast 2024-2029 ($ million)
- Exhibits91: Chart on Gallium arsenide - Year-over-year growth 2024-2029 (%)
- Exhibits92: Data Table on Gallium arsenide - Year-over-year growth 2024-2029 (%)
- Exhibits93: Chart on Others - Market size and forecast 2024-2029 ($ million)
- Exhibits94: Data Table on Others - Market size and forecast 2024-2029 ($ million)
- Exhibits95: Chart on Others - Year-over-year growth 2024-2029 (%)
- Exhibits96: Data Table on Others - Year-over-year growth 2024-2029 (%)
- Exhibits97: Market opportunity by Material ($ million)
- Exhibits98: Data Table on Market opportunity by Material ($ million)
- Exhibits99: Analysis of price sensitivity, lifecycle, customer purchase basket, adoption rates, and purchase criteria
- Exhibits100: Impact of drivers and challenges in 2024 and 2029
- Exhibits101: Overview on criticality of inputs and factors of differentiation
- Exhibits102: Overview on factors of disruption
- Exhibits103: Impact of key risks on business
- Exhibits104: Companies covered
- Exhibits105: Company ranking index
- Exhibits106: Matrix on companies position and classification
- Exhibits107: Advanced Micro Devices Inc. - Overview
- Exhibits108: Advanced Micro Devices Inc. - Business segments
- Exhibits109: Advanced Micro Devices Inc. - Key news
- Exhibits110: Advanced Micro Devices Inc. - Key offerings
- Exhibits111: Advanced Micro Devices Inc. - Segment focus
- Exhibits112: SWOT
- Exhibits113: AOI ELECTRONICS CO.LTD. - Overview
- Exhibits114: AOI ELECTRONICS CO.LTD. - Product / Service
- Exhibits115: AOI ELECTRONICS CO.LTD. - Key offerings
- Exhibits116: SWOT
- Exhibits117: Infineon Technologies AG - Overview
- Exhibits118: Infineon Technologies AG - Business segments
- Exhibits119: Infineon Technologies AG - Key news
- Exhibits120: Infineon Technologies AG - Key offerings
- Exhibits121: Infineon Technologies AG - Segment focus
- Exhibits122: SWOT
- Exhibits123: Intel Corp. - Overview
- Exhibits124: Intel Corp. - Business segments
- Exhibits125: Intel Corp. - Key news
- Exhibits126: Intel Corp. - Key offerings
- Exhibits127: Intel Corp. - Segment focus
- Exhibits128: SWOT
- Exhibits129: Kyocera Corp. - Overview
- Exhibits130: Kyocera Corp. - Business segments
- Exhibits131: Kyocera Corp. - Key news
- Exhibits132: Kyocera Corp. - Key offerings
- Exhibits133: Kyocera Corp. - Segment focus
- Exhibits134: SWOT
- Exhibits135: Micron Technology Inc. - Overview
- Exhibits136: Micron Technology Inc. - Business segments
- Exhibits137: Micron Technology Inc. - Key news
- Exhibits138: Micron Technology Inc. - Key offerings
- Exhibits139: Micron Technology Inc. - Segment focus
- Exhibits140: SWOT
- Exhibits141: NVIDIA Corp. - Overview
- Exhibits142: NVIDIA Corp. - Business segments
- Exhibits143: NVIDIA Corp. - Key news
- Exhibits144: NVIDIA Corp. - Key offerings
- Exhibits145: NVIDIA Corp. - Segment focus
- Exhibits146: SWOT
- Exhibits147: NXP Semiconductors NV - Overview
- Exhibits148: NXP Semiconductors NV - Product / Service
- Exhibits149: NXP Semiconductors NV - Key offerings
- Exhibits150: SWOT
- Exhibits151: Qualcomm Inc. - Overview
- Exhibits152: Qualcomm Inc. - Business segments
- Exhibits153: Qualcomm Inc. - Key news
- Exhibits154: Qualcomm Inc. - Key offerings
- Exhibits155: Qualcomm Inc. - Segment focus
- Exhibits156: SWOT
- Exhibits157: Samsung Electronics Co. Ltd. - Overview
- Exhibits158: Samsung Electronics Co. Ltd. - Business segments
- Exhibits159: Samsung Electronics Co. Ltd. - Key news
- Exhibits160: Samsung Electronics Co. Ltd. - Key offerings
- Exhibits161: Samsung Electronics Co. Ltd. - Segment focus
- Exhibits162: SWOT
- Exhibits163: Screen Holdings Co. Ltd - Overview
- Exhibits164: Screen Holdings Co. Ltd - Business segments
- Exhibits165: Screen Holdings Co. Ltd - Key offerings
- Exhibits166: Screen Holdings Co. Ltd - Segment focus
- Exhibits167: SWOT
- Exhibits168: Shindengen Electric Manufacturing Co. Ltd. - Overview
- Exhibits169: Shindengen Electric Manufacturing Co. Ltd. - Product / Service
- Exhibits170: Shindengen Electric Manufacturing Co. Ltd. - Key offerings
- Exhibits171: SWOT
- Exhibits172: STMicroelectronics NV - Overview
- Exhibits173: STMicroelectronics NV - Business segments
- Exhibits174: STMicroelectronics NV - Key news
- Exhibits175: STMicroelectronics NV - Key offerings
- Exhibits176: STMicroelectronics NV - Segment focus
- Exhibits177: SWOT
- Exhibits178: Sumitomo Corp. - Overview
- Exhibits179: Sumitomo Corp. - Business segments
- Exhibits180: Sumitomo Corp. - Key offerings
- Exhibits181: Sumitomo Corp. - Segment focus
- Exhibits182: SWOT
- Exhibits183: Toshiba Corp. - Overview
- Exhibits184: Toshiba Corp. - Business segments
- Exhibits185: Toshiba Corp. - Key news
- Exhibits186: Toshiba Corp. - Key offerings
- Exhibits187: Toshiba Corp. - Segment focus
- Exhibits188: SWOT
- Exhibits189: Inclusions checklist
- Exhibits190: Exclusions checklist
- Exhibits191: Currency conversion rates for US$
- Exhibits192: Research methodology
- Exhibits193: Information sources
- Exhibits194: Data validation
- Exhibits195: Validation techniques employed for market sizing
- Exhibits196: Data synthesis
- Exhibits197: 360 degree market analysis
- Exhibits198: List of abbreviations
The semiconductor device market in japan is forecasted to grow by USD 12527.8 mn during 2024-2029, accelerating at a CAGR of 9% during the forecast period. The report on the semiconductor device market in japan provides a holistic analysis, market size and forecast, trends, growth drivers, and challenges, as well as vendor analysis covering around 25 vendors.
The report offers an up-to-date analysis regarding the current market scenario, the latest trends and drivers, and the overall market environment. The market is driven by increasing demand for high-power density devices, strategic collaborations among market participants, and government initiatives supporting development of semiconductor device.
The study was conducted using an objective combination of primary and secondary information including inputs from key participants in the industry. The report contains a comprehensive market size data, segment with regional analysis and vendor landscape in addition to an analysis of the key companies. Reports have historic and forecast data.
| Market Scope | |
|---|---|
| Base Year | 2025 |
| End Year | 2029 |
| Series Year | 2025-2029 |
| Growth Momentum | Accelerate |
| YOY 2025 | 8% |
| CAGR | 9% |
| Incremental Value | $12527.8 mn |
Technavio's semiconductor device market in japan is segmented as below:
By Application
- Consumer electronics
- Communications
- Automotive
- Medical devices
- Others
By Device
- PMIC
- Microchips
- RFID
By Material
- Silicon
- Germanium
- Gallium arsenide
- Others
This study identifies the growing investments in 5g technology in japan as one of the prime reasons driving the semiconductor device market in japan growth during the next few years. Also, increasing use of adas in automotive industry and rising adoption of low-cost communication devices will lead to sizable demand in the market.
The report on the semiconductor device market in japan covers the following areas:
- Semiconductor Device Market in Japan sizing
- Semiconductor Device Market in Japan forecast
- Semiconductor Device Market in Japan industry analysis
The robust vendor analysis is designed to help clients improve their market position, and in line with this, this report provides a detailed analysis of several leading semiconductor device market in japan vendors that include Advanced Micro Devices Inc., AOI ELECTRONICS CO.LTD., Infineon Technologies AG, Intel Corp., Kyocera Corp., Micron Technology Inc., Mitsubishi Electric Corp., NVIDIA Corp., NXP Semiconductors NV, Qualcomm Inc., Renesas Electronics Corp., ROHM Co. Ltd., Samsung Electronics Co. Ltd., Screen Holdings Co. Ltd, Shindengen Electric Manufacturing Co. Ltd., STMicroelectronics NV, Sumitomo Corp., and Toshiba Corp.. Also, the semiconductor device market in japan analysis report includes information on upcoming trends and challenges that will influence market growth. This is to help companies strategize and leverage all forthcoming growth opportunities.
The publisher presents a detailed picture of the market by the way of study, synthesis, and summation of data from multiple sources by an analysis of key parameters such as profit, pricing, competition, and promotions. It presents various market facets by identifying the key industry influencers. The data presented is comprehensive, reliable, and a result of extensive primary and secondary research. The market research reports provide a complete competitive landscape and an in-depth vendor selection methodology and analysis using qualitative and quantitative research to forecast accurate market growth.
Table of Contents
1 Executive Summary
- 1.1 Market overview
- Executive Summary - Chart on Market Overview
- Executive Summary - Data Table on Market Overview
- Executive Summary - Chart on Country Market Characteristics
- Executive Summary - Chart on Market Segmentation by Application
- Executive Summary - Chart on Market Segmentation by Device
- Executive Summary - Chart on Market Segmentation by Material
- Executive Summary - Chart on Company Market Positioning
2 Technavio Analysis
- 2.1 Analysis of price sensitivity, lifecycle, customer purchase basket, adoption rates, and purchase criteria
- Analysis of price sensitivity, lifecycle, customer purchase basket, adoption rates, and purchase criteria
- 2.2 Criticality of inputs and Factors of differentiation
- Overview on criticality of inputs and factors of differentiation
- 2.3 Factors of disruption
- Overview on factors of disruption
- 2.4 Impact of drivers and challenges
- Impact of drivers and challenges in 2024 and 2029
3 Market Landscape
- 3.1 Market ecosystem
- Parent Market
- Data Table on - Parent Market
- 3.2 Market characteristics
- Market characteristics analysis
- 3.3 Value chain analysis
- Value chain analysis
4 Market Sizing
- 4.1 Market definition
- Offerings of companies included in the market definition
- 4.2 Market segment analysis
- Market segments
- 4.3 Market size 2024
- 4.4 Market outlook: Forecast for 2024-2029
- Chart on Japan - Market size and forecast 2024-2029 ($ million)
- Data Table on Japan - Market size and forecast 2024-2029 ($ million)
- Chart on Japan: Year-over-year growth 2024-2029 (%)
- Data Table on Japan: Year-over-year growth 2024-2029 (%)
5 Historic Market Size
- 5.1 Semiconductor Device Market in Japan 2019 - 2023
- Historic Market Size - Data Table on Semiconductor Device Market in Japan 2019 - 2023 ($ million)
- 5.2 Application segment analysis 2019 - 2023
- Historic Market Size - Application Segment 2019 - 2023 ($ million)
- 5.3 Device segment analysis 2019 - 2023
- Historic Market Size - Device Segment 2019 - 2023 ($ million)
- 5.4 Material segment analysis 2019 - 2023
- Historic Market Size - Material Segment 2019 - 2023 ($ million)
6 Qualitative Analysis
- 6.1 Impact of AI in semiconductor device market in Japan
7 Five Forces Analysis
- 7.1 Five forces summary
- Five forces analysis - Comparison between 2024 and 2029
- 7.2 Bargaining power of buyers
- Bargaining power of buyers - Impact of key factors 2024 and 2029
- 7.3 Bargaining power of suppliers
- Bargaining power of suppliers - Impact of key factors in 2024 and 2029
- 7.4 Threat of new entrants
- Threat of new entrants - Impact of key factors in 2024 and 2029
- 7.5 Threat of substitutes
- Threat of substitutes - Impact of key factors in 2024 and 2029
- 7.6 Threat of rivalry
- Threat of rivalry - Impact of key factors in 2024 and 2029
- 7.7 Market condition
- Chart on Market condition - Five forces 2024 and 2029
8 Market Segmentation by Application
- 8.1 Market segments
- Chart on Application - Market share 2024-2029 (%)
- Data Table on Application - Market share 2024-2029 (%)
- 8.2 Comparison by Application
- Chart on Comparison by Application
- Data Table on Comparison by Application
- 8.3 Consumer electronics - Market size and forecast 2024-2029
- Chart on Consumer electronics - Market size and forecast 2024-2029 ($ million)
- Data Table on Consumer electronics - Market size and forecast 2024-2029 ($ million)
- Chart on Consumer electronics - Year-over-year growth 2024-2029 (%)
- Data Table on Consumer electronics - Year-over-year growth 2024-2029 (%)
- 8.4 Communications - Market size and forecast 2024-2029
- Chart on Communications - Market size and forecast 2024-2029 ($ million)
- Data Table on Communications - Market size and forecast 2024-2029 ($ million)
- Chart on Communications - Year-over-year growth 2024-2029 (%)
- Data Table on Communications - Year-over-year growth 2024-2029 (%)
- 8.5 Automotive - Market size and forecast 2024-2029
- Chart on Automotive - Market size and forecast 2024-2029 ($ million)
- Data Table on Automotive - Market size and forecast 2024-2029 ($ million)
- Chart on Automotive - Year-over-year growth 2024-2029 (%)
- Data Table on Automotive - Year-over-year growth 2024-2029 (%)
- 8.6 Medical devices - Market size and forecast 2024-2029
- Chart on Medical devices - Market size and forecast 2024-2029 ($ million)
- Data Table on Medical devices - Market size and forecast 2024-2029 ($ million)
- Chart on Medical devices - Year-over-year growth 2024-2029 (%)
- Data Table on Medical devices - Year-over-year growth 2024-2029 (%)
- 8.7 Others - Market size and forecast 2024-2029
- Chart on Others - Market size and forecast 2024-2029 ($ million)
- Data Table on Others - Market size and forecast 2024-2029 ($ million)
- Chart on Others - Year-over-year growth 2024-2029 (%)
- Data Table on Others - Year-over-year growth 2024-2029 (%)
- 8.8 Market opportunity by Application
- Market opportunity by Application ($ million)
- Data Table on Market opportunity by Application ($ million)
9 Market Segmentation by Device
- 9.1 Market segments
- Chart on Device - Market share 2024-2029 (%)
- Data Table on Device - Market share 2024-2029 (%)
- 9.2 Comparison by Device
- Chart on Comparison by Device
- Data Table on Comparison by Device
- 9.3 PMIC - Market size and forecast 2024-2029
- Chart on PMIC - Market size and forecast 2024-2029 ($ million)
- Data Table on PMIC - Market size and forecast 2024-2029 ($ million)
- Chart on PMIC - Year-over-year growth 2024-2029 (%)
- Data Table on PMIC - Year-over-year growth 2024-2029 (%)
- 9.4 Microchips - Market size and forecast 2024-2029
- Chart on Microchips - Market size and forecast 2024-2029 ($ million)
- Data Table on Microchips - Market size and forecast 2024-2029 ($ million)
- Chart on Microchips - Year-over-year growth 2024-2029 (%)
- Data Table on Microchips - Year-over-year growth 2024-2029 (%)
- 9.5 RFID - Market size and forecast 2024-2029
- Chart on RFID - Market size and forecast 2024-2029 ($ million)
- Data Table on RFID - Market size and forecast 2024-2029 ($ million)
- Chart on RFID - Year-over-year growth 2024-2029 (%)
- Data Table on RFID - Year-over-year growth 2024-2029 (%)
- 9.6 Market opportunity by Device
- Market opportunity by Device ($ million)
- Data Table on Market opportunity by Device ($ million)
10 Market Segmentation by Material
- 10.1 Market segments
- Chart on Material - Market share 2024-2029 (%)
- Data Table on Material - Market share 2024-2029 (%)
- 10.2 Comparison by Material
- Chart on Comparison by Material
- Data Table on Comparison by Material
- 10.3 Silicon - Market size and forecast 2024-2029
- Chart on Silicon - Market size and forecast 2024-2029 ($ million)
- Data Table on Silicon - Market size and forecast 2024-2029 ($ million)
- Chart on Silicon - Year-over-year growth 2024-2029 (%)
- Data Table on Silicon - Year-over-year growth 2024-2029 (%)
- 10.4 Germanium - Market size and forecast 2024-2029
- Chart on Germanium - Market size and forecast 2024-2029 ($ million)
- Data Table on Germanium - Market size and forecast 2024-2029 ($ million)
- Chart on Germanium - Year-over-year growth 2024-2029 (%)
- Data Table on Germanium - Year-over-year growth 2024-2029 (%)
- 10.5 Gallium arsenide - Market size and forecast 2024-2029
- Chart on Gallium arsenide - Market size and forecast 2024-2029 ($ million)
- Data Table on Gallium arsenide - Market size and forecast 2024-2029 ($ million)
- Chart on Gallium arsenide - Year-over-year growth 2024-2029 (%)
- Data Table on Gallium arsenide - Year-over-year growth 2024-2029 (%)
- 10.6 Others - Market size and forecast 2024-2029
- Chart on Others - Market size and forecast 2024-2029 ($ million)
- Data Table on Others - Market size and forecast 2024-2029 ($ million)
- Chart on Others - Year-over-year growth 2024-2029 (%)
- Data Table on Others - Year-over-year growth 2024-2029 (%)
- 10.7 Market opportunity by Material
- Market opportunity by Material ($ million)
- Data Table on Market opportunity by Material ($ million)
11 Customer Landscape
- 11.1 Customer landscape overview
- Analysis of price sensitivity, lifecycle, customer purchase basket, adoption rates, and purchase criteria
12 Drivers, Challenges, and Opportunity/Restraints
- 12.1 Market drivers
- 12.2 Market challenges
- 12.3 Impact of drivers and challenges
- Impact of drivers and challenges in 2024 and 2029
- 12.4 Market opportunities/restraints
13 Competitive Landscape
- 13.1 Overview
- 13.2 Competitive Landscape
- Overview on criticality of inputs and factors of differentiation
- 13.3 Landscape disruption
- Overview on factors of disruption
- 13.4 Industry risks
- Impact of key risks on business
14 Competitive Analysis
- 14.1 Companies profiled
- Companies covered
- 14.2 Company ranking index
- Company ranking index
- 14.3 Market positioning of companies
- Matrix on companies position and classification
- 14.4 Advanced Micro Devices Inc.
- Advanced Micro Devices Inc. - Overview
- Advanced Micro Devices Inc. - Business segments
- Advanced Micro Devices Inc. - Key news
- Advanced Micro Devices Inc. - Key offerings
- Advanced Micro Devices Inc. - Segment focus
- SWOT
- 14.5 AOI ELECTRONICS CO.LTD.
- AOI ELECTRONICS CO.LTD. - Overview
- AOI ELECTRONICS CO.LTD. - Product / Service
- AOI ELECTRONICS CO.LTD. - Key offerings
- SWOT
- 14.6 Infineon Technologies AG
- Infineon Technologies AG - Overview
- Infineon Technologies AG - Business segments
- Infineon Technologies AG - Key news
- Infineon Technologies AG - Key offerings
- Infineon Technologies AG - Segment focus
- SWOT
- 14.7 Intel Corp.
- Intel Corp. - Overview
- Intel Corp. - Business segments
- Intel Corp. - Key news
- Intel Corp. - Key offerings
- Intel Corp. - Segment focus
- SWOT
- 14.8 Kyocera Corp.
- Kyocera Corp. - Overview
- Kyocera Corp. - Business segments
- Kyocera Corp. - Key news
- Kyocera Corp. - Key offerings
- Kyocera Corp. - Segment focus
- SWOT
- 14.9 Micron Technology Inc.
- Micron Technology Inc. - Overview
- Micron Technology Inc. - Business segments
- Micron Technology Inc. - Key news
- Micron Technology Inc. - Key offerings
- Micron Technology Inc. - Segment focus
- SWOT
- 14.10 NVIDIA Corp.
- NVIDIA Corp. - Overview
- NVIDIA Corp. - Business segments
- NVIDIA Corp. - Key news
- NVIDIA Corp. - Key offerings
- NVIDIA Corp. - Segment focus
- SWOT
- 14.11 NXP Semiconductors NV
- NXP Semiconductors NV - Overview
- NXP Semiconductors NV - Product / Service
- NXP Semiconductors NV - Key offerings
- SWOT
- 14.12 Qualcomm Inc.
- Qualcomm Inc. - Overview
- Qualcomm Inc. - Business segments
- Qualcomm Inc. - Key news
- Qualcomm Inc. - Key offerings
- Qualcomm Inc. - Segment focus
- SWOT
- 14.13 Samsung Electronics Co. Ltd.
- Samsung Electronics Co. Ltd. - Overview
- Samsung Electronics Co. Ltd. - Business segments
- Samsung Electronics Co. Ltd. - Key news
- Samsung Electronics Co. Ltd. - Key offerings
- Samsung Electronics Co. Ltd. - Segment focus
- SWOT
- 14.14 Screen Holdings Co. Ltd
- Screen Holdings Co. Ltd - Overview
- Screen Holdings Co. Ltd - Business segments
- Screen Holdings Co. Ltd - Key offerings
- Screen Holdings Co. Ltd - Segment focus
- SWOT
- 14.15 Shindengen Electric Manufacturing Co. Ltd.
- Shindengen Electric Manufacturing Co. Ltd. - Overview
- Shindengen Electric Manufacturing Co. Ltd. - Product / Service
- Shindengen Electric Manufacturing Co. Ltd. - Key offerings
- SWOT
- 14.16 STMicroelectronics NV
- STMicroelectronics NV - Overview
- STMicroelectronics NV - Business segments
- STMicroelectronics NV - Key news
- STMicroelectronics NV - Key offerings
- STMicroelectronics NV - Segment focus
- SWOT
- 14.17 Sumitomo Corp.
- Sumitomo Corp. - Overview
- Sumitomo Corp. - Business segments
- Sumitomo Corp. - Key offerings
- Sumitomo Corp. - Segment focus
- SWOT
- 14.18 Toshiba Corp.
- Toshiba Corp. - Overview
- Toshiba Corp. - Business segments
- Toshiba Corp. - Key news
- Toshiba Corp. - Key offerings
- Toshiba Corp. - Segment focus
- SWOT
15 Appendix
- 15.1 Scope of the report
- 15.2 Inclusions and exclusions checklist
- Inclusions checklist
- Exclusions checklist
- 15.3 Currency conversion rates for US$
- Currency conversion rates for US$
- 15.4 Research methodology
- Research methodology
- 15.5 Data procurement
- Information sources
- 15.6 Data validation
- Data validation
- 15.7 Validation techniques employed for market sizing
- Validation techniques employed for market sizing
- 15.8 Data synthesis
- Data synthesis
- 15.9 360 degree market analysis
- 360 degree market analysis
- 15.10 List of abbreviations
- List of abbreviations
