|
|
市場調査レポート
商品コード
1719444
網膜用薬の世界市場 2025~2029年Global Retinal Drugs Market 2025-2029 |
||||||

|
|||||||
カスタマイズ可能
|
|||||||


| 網膜用薬の世界市場 2025~2029年 |
|
出版日: 2025年04月24日
発行: TechNavio
ページ情報: 英文 217 Pages
納期: 即納可能
|

全表示
- 概要
- 図表
- 目次
網膜用薬市場は2024-2029年に94億3,490万米ドル、予測期間中のCAGRは7.1%で成長すると予測されます。
当レポートでは、網膜用薬市場の全体的な分析、市場規模・予測、動向、成長促進要因、課題、約25のベンダーを網羅したベンダー分析などを掲載しています。
現在の市場シナリオ、最新動向と促進要因、市場環境全体に関する最新分析を提供しています。市場は、網膜疾患の有病率の上昇、高度診断ツールの出現、患者支援プログラムなどが牽引しています。
| 市場範囲 | |
|---|---|
| 基準年 | 2025 |
| 終了年 | 2029 |
| 予測期間 | 2025-2029 |
| 成長モメンタム | 加速 |
| 前年比2025年 | 6.5% |
| CAGR | 7.1% |
| 増分額 | 94億3,490万米ドル |
本調査は、業界の主要参加者からのインプットを含め、一次情報と二次情報を客観的に組み合わせて実施しました。レポートには、主要企業の分析に加え、包括的な市場規模データ、地域分析によるセグメント、ベンダー情勢が含まれています。レポートには過去データと予測データがあります。
本調査では、今後数年間の網膜用薬市場の成長を促進する主な要因の一つとして、革新的な治療法の開発を挙げています。また、徐放性眼科用製剤の需要の増加や診断技術の進歩は、市場の大きな需要につながります。
目次
第1章 エグゼクティブサマリー
- 市場概要
第2章 Technavio分析
- 価格・ライフサイクル・顧客購入バスケット・採用率・購入基準の分析
- インプットの重要性と差別化の要因
- 混乱の要因
- 促進要因と課題の影響
第3章 市場情勢
- 市場エコシステム
- 市場の特徴
- バリューチェーン分析
第4章 市場規模
- 市場の定義
- 市場セグメント分析
- 市場規模 2024
- 市場の見通し 2024-2029
第5章 市場規模実績
- 網膜用薬の世界市場 2019-2023
- 流通チャネル別セグメント分析 2019-2023
- 適応症別セグメント分析 2019-2023
- 薬剤クラス別セグメント分析 2019-2023
- 地域別セグメント分析 2019-2023
- 国別セグメント分析 2019-2023
第6章 定性分析
- AIの影響:網膜用薬の世界市場
第7章 ファイブフォース分析
- ファイブフォースの要約
- 買い手の交渉力
- 供給企業の交渉力
- 新規参入業者の脅威
- 代替品の脅威
- 競争の脅威
- 市況
第8章 市場セグメンテーション:流通チャネル別
- 市場セグメント
- 比較:流通チャネル別
- 病院薬局:市場規模と予測 2024-2029
- 小売薬局:市場規模と予測 2024-2029
- オンライン薬局:市場規模と予測 2024-2029
- 市場機会:流通チャネル別
第9章 市場セグメンテーション:適応症別
- 市場セグメント
- 比較:適応症別
- 黄斑変性:市場規模と予測 2024-2029
- 糖尿病性眼疾患:市場規模と予測 2024-2029
- その他:市場規模と予測 2024-2029
- 市場機会:適応症別
第10章 市場セグメンテーション:薬剤クラス別
- 市場セグメント
- 比較:薬剤クラス別
- VEGF-A拮抗薬:市場規模と予測 2024-2029
- TNF-A阻害剤:市場規模と予測 2024-2029
- 市場機会:薬剤クラス別
第11章 顧客情勢
- 顧客情勢の概要
第12章 地域別情勢
- 地域別セグメンテーション
- 地域別比較
- 北米:市場規模と予測 2024-2029
- 欧州:市場規模と予測 2024-2029
- アジア:市場規模と予測 2024-2029
- 世界のその他の地域:市場規模と予測 2024-2029
- 米国:市場規模と予測 2024-2029
- ドイツ:市場規模と予測 2024-2029
- カナダ:市場規模と予測 2024-2029
- 中国:市場規模と予測 2024-2029
- 英国:市場規模と予測 2024-2029
- フランス:市場規模と予測 2024-2029
- 日本:市場規模と予測 2024-2029
- イタリア:市場規模と予測 2024-2029
- インド:市場規模と予測 2024-2029
- 韓国:市場規模と予測 2024-2029
- 市場機会:地域情勢別
第13章 促進要因・課題・機会・抑制要因
- 市場促進要因
- 市場の課題
- 促進要因と課題の影響
- 市場の機会・抑制要因
第14章 競合情勢
- 概要
- 競合情勢
- 混乱の状況
- 業界のリスク
第15章 競合分析
- 企業プロファイル
- 企業ランキング指数
- 企業の市場ポジショニング
- AbbVie Inc.
- Alcon Inc.
- Alimera Sciences Inc.
- Bausch Health Companies Inc.
- Bayer AG
- Bristol Myers Squibb Co.
- F. Hoffmann La Roche Ltd.
- Johnson and Johnson Services Inc.
- MeiraGTx Holdings Plc.
- Novartis AG
- Ocular Therapeutix Inc
- Oxurion N
- Pfizer Inc.
- Regeneron Pharmaceuticals Inc.
- Sanofi SA
第16章 付録
Exhibits:
- Exhibits1: Executive Summary - Chart on Market Overview
- Exhibits2: Executive Summary - Data Table on Market Overview
- Exhibits3: Executive Summary - Chart on Global Market Characteristics
- Exhibits4: Executive Summary - Chart on Market By Geographical Landscape
- Exhibits5: Executive Summary - Chart on Market Segmentation by Distribution Channel
- Exhibits6: Executive Summary - Chart on Market Segmentation by Indication
- Exhibits7: Executive Summary - Chart on Market Segmentation by Drug Class
- Exhibits8: Executive Summary - Chart on Incremental Growth
- Exhibits9: Executive Summary - Data Table on Incremental Growth
- Exhibits10: Executive Summary - Chart on Company Market Positioning
- Exhibits11: Analysis of price sensitivity, lifecycle, customer purchase basket, adoption rates, and purchase criteria
- Exhibits12: Overview on criticality of inputs and factors of differentiation
- Exhibits13: Overview on factors of disruption
- Exhibits14: Impact of drivers and challenges in 2024 and 2029
- Exhibits15: Parent Market
- Exhibits16: Data Table on - Parent Market
- Exhibits17: Market characteristics analysis
- Exhibits18: Value chain analysis
- Exhibits19: Offerings of companies included in the market definition
- Exhibits20: Market segments
- Exhibits21: Chart on Global - Market size and forecast 2024-2029 ($ million)
- Exhibits22: Data Table on Global - Market size and forecast 2024-2029 ($ million)
- Exhibits23: Chart on Global Market: Year-over-year growth 2024-2029 (%)
- Exhibits24: Data Table on Global Market: Year-over-year growth 2024-2029 (%)
- Exhibits25: Historic Market Size - Data Table on Global Retinal Drugs Market 2019 - 2023 ($ million)
- Exhibits26: Historic Market Size - Distribution Channel Segment 2019 - 2023 ($ million)
- Exhibits27: Historic Market Size - Indication Segment 2019 - 2023 ($ million)
- Exhibits28: Historic Market Size - Drug Class Segment 2019 - 2023 ($ million)
- Exhibits29: Historic Market Size - Geography Segment 2019 - 2023 ($ million)
- Exhibits30: Historic Market Size - Country Segment 2019 - 2023 ($ million)
- Exhibits31: Five forces analysis - Comparison between 2024 and 2029
- Exhibits32: Bargaining power of buyers - Impact of key factors 2024 and 2029
- Exhibits33: Bargaining power of suppliers - Impact of key factors in 2024 and 2029
- Exhibits34: Threat of new entrants - Impact of key factors in 2024 and 2029
- Exhibits35: Threat of substitutes - Impact of key factors in 2024 and 2029
- Exhibits36: Threat of rivalry - Impact of key factors in 2024 and 2029
- Exhibits37: Chart on Market condition - Five forces 2024 and 2029
- Exhibits38: Chart on Distribution Channel - Market share 2024-2029 (%)
- Exhibits39: Data Table on Distribution Channel - Market share 2024-2029 (%)
- Exhibits40: Chart on Comparison by Distribution Channel
- Exhibits41: Data Table on Comparison by Distribution Channel
- Exhibits42: Chart on Hospital pharmacy - Market size and forecast 2024-2029 ($ million)
- Exhibits43: Data Table on Hospital pharmacy - Market size and forecast 2024-2029 ($ million)
- Exhibits44: Chart on Hospital pharmacy - Year-over-year growth 2024-2029 (%)
- Exhibits45: Data Table on Hospital pharmacy - Year-over-year growth 2024-2029 (%)
- Exhibits46: Chart on Retail pharmacy - Market size and forecast 2024-2029 ($ million)
- Exhibits47: Data Table on Retail pharmacy - Market size and forecast 2024-2029 ($ million)
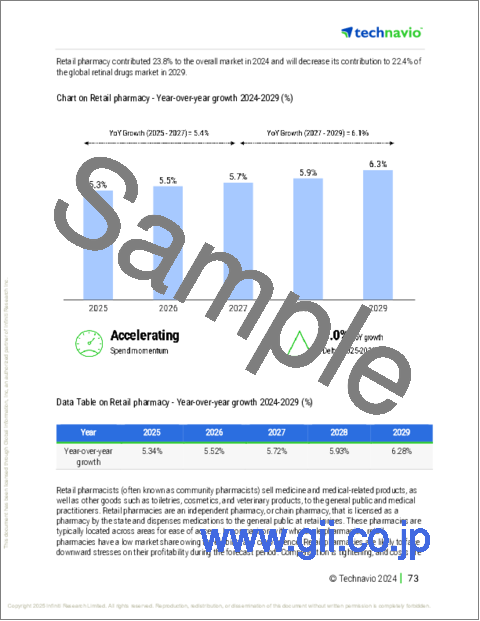
- Exhibits48: Chart on Retail pharmacy - Year-over-year growth 2024-2029 (%)
- Exhibits49: Data Table on Retail pharmacy - Year-over-year growth 2024-2029 (%)
- Exhibits50: Chart on Online pharmacy - Market size and forecast 2024-2029 ($ million)
- Exhibits51: Data Table on Online pharmacy - Market size and forecast 2024-2029 ($ million)
- Exhibits52: Chart on Online pharmacy - Year-over-year growth 2024-2029 (%)
- Exhibits53: Data Table on Online pharmacy - Year-over-year growth 2024-2029 (%)
- Exhibits54: Market opportunity by Distribution Channel ($ million)
- Exhibits55: Data Table on Market opportunity by Distribution Channel ($ million)
- Exhibits56: Chart on Indication - Market share 2024-2029 (%)
- Exhibits57: Data Table on Indication - Market share 2024-2029 (%)
- Exhibits58: Chart on Comparison by Indication
- Exhibits59: Data Table on Comparison by Indication
- Exhibits60: Chart on Macular degeneration - Market size and forecast 2024-2029 ($ million)
- Exhibits61: Data Table on Macular degeneration - Market size and forecast 2024-2029 ($ million)
- Exhibits62: Chart on Macular degeneration - Year-over-year growth 2024-2029 (%)
- Exhibits63: Data Table on Macular degeneration - Year-over-year growth 2024-2029 (%)
- Exhibits64: Chart on Diabetic eye disease - Market size and forecast 2024-2029 ($ million)
- Exhibits65: Data Table on Diabetic eye disease - Market size and forecast 2024-2029 ($ million)
- Exhibits66: Chart on Diabetic eye disease - Year-over-year growth 2024-2029 (%)
- Exhibits67: Data Table on Diabetic eye disease - Year-over-year growth 2024-2029 (%)
- Exhibits68: Chart on Others - Market size and forecast 2024-2029 ($ million)
- Exhibits69: Data Table on Others - Market size and forecast 2024-2029 ($ million)
- Exhibits70: Chart on Others - Year-over-year growth 2024-2029 (%)
- Exhibits71: Data Table on Others - Year-over-year growth 2024-2029 (%)
- Exhibits72: Market opportunity by Indication ($ million)
- Exhibits73: Data Table on Market opportunity by Indication ($ million)
- Exhibits74: Chart on Drug Class - Market share 2024-2029 (%)
- Exhibits75: Data Table on Drug Class - Market share 2024-2029 (%)
- Exhibits76: Chart on Comparison by Drug Class
- Exhibits77: Data Table on Comparison by Drug Class
- Exhibits78: Chart on VEGF-A antagonist - Market size and forecast 2024-2029 ($ million)
- Exhibits79: Data Table on VEGF-A antagonist - Market size and forecast 2024-2029 ($ million)
- Exhibits80: Chart on VEGF-A antagonist - Year-over-year growth 2024-2029 (%)
- Exhibits81: Data Table on VEGF-A antagonist - Year-over-year growth 2024-2029 (%)
- Exhibits82: Chart on TNF-A inhibitor - Market size and forecast 2024-2029 ($ million)
- Exhibits83: Data Table on TNF-A inhibitor - Market size and forecast 2024-2029 ($ million)
- Exhibits84: Chart on TNF-A inhibitor - Year-over-year growth 2024-2029 (%)
- Exhibits85: Data Table on TNF-A inhibitor - Year-over-year growth 2024-2029 (%)
- Exhibits86: Market opportunity by Drug Class ($ million)
- Exhibits87: Data Table on Market opportunity by Drug Class ($ million)
- Exhibits88: Analysis of price sensitivity, lifecycle, customer purchase basket, adoption rates, and purchase criteria
- Exhibits89: Chart on Market share By Geographical Landscape 2024-2029 (%)
- Exhibits90: Data Table on Market share By Geographical Landscape 2024-2029 (%)
- Exhibits91: Chart on Geographic comparison
- Exhibits92: Data Table on Geographic comparison
- Exhibits93: Chart on North America - Market size and forecast 2024-2029 ($ million)
- Exhibits94: Data Table on North America - Market size and forecast 2024-2029 ($ million)
- Exhibits95: Chart on North America - Year-over-year growth 2024-2029 (%)
- Exhibits96: Data Table on North America - Year-over-year growth 2024-2029 (%)
- Exhibits97: Chart on Europe - Market size and forecast 2024-2029 ($ million)
- Exhibits98: Data Table on Europe - Market size and forecast 2024-2029 ($ million)
- Exhibits99: Chart on Europe - Year-over-year growth 2024-2029 (%)
- Exhibits100: Data Table on Europe - Year-over-year growth 2024-2029 (%)
- Exhibits101: Chart on Asia - Market size and forecast 2024-2029 ($ million)
- Exhibits102: Data Table on Asia - Market size and forecast 2024-2029 ($ million)
- Exhibits103: Chart on Asia - Year-over-year growth 2024-2029 (%)
- Exhibits104: Data Table on Asia - Year-over-year growth 2024-2029 (%)
- Exhibits105: Chart on Rest of World (ROW) - Market size and forecast 2024-2029 ($ million)
- Exhibits106: Data Table on Rest of World (ROW) - Market size and forecast 2024-2029 ($ million)
- Exhibits107: Chart on Rest of World (ROW) - Year-over-year growth 2024-2029 (%)
- Exhibits108: Data Table on Rest of World (ROW) - Year-over-year growth 2024-2029 (%)
- Exhibits109: Chart on US - Market size and forecast 2024-2029 ($ million)
- Exhibits110: Data Table on US - Market size and forecast 2024-2029 ($ million)
- Exhibits111: Chart on US - Year-over-year growth 2024-2029 (%)
- Exhibits112: Data Table on US - Year-over-year growth 2024-2029 (%)
- Exhibits113: Chart on Germany - Market size and forecast 2024-2029 ($ million)
- Exhibits114: Data Table on Germany - Market size and forecast 2024-2029 ($ million)
- Exhibits115: Chart on Germany - Year-over-year growth 2024-2029 (%)
- Exhibits116: Data Table on Germany - Year-over-year growth 2024-2029 (%)
- Exhibits117: Chart on Canada - Market size and forecast 2024-2029 ($ million)
- Exhibits118: Data Table on Canada - Market size and forecast 2024-2029 ($ million)
- Exhibits119: Chart on Canada - Year-over-year growth 2024-2029 (%)
- Exhibits120: Data Table on Canada - Year-over-year growth 2024-2029 (%)
- Exhibits121: Chart on China - Market size and forecast 2024-2029 ($ million)
- Exhibits122: Data Table on China - Market size and forecast 2024-2029 ($ million)
- Exhibits123: Chart on China - Year-over-year growth 2024-2029 (%)
- Exhibits124: Data Table on China - Year-over-year growth 2024-2029 (%)
- Exhibits125: Chart on UK - Market size and forecast 2024-2029 ($ million)
- Exhibits126: Data Table on UK - Market size and forecast 2024-2029 ($ million)
- Exhibits127: Chart on UK - Year-over-year growth 2024-2029 (%)
- Exhibits128: Data Table on UK - Year-over-year growth 2024-2029 (%)
- Exhibits129: Chart on France - Market size and forecast 2024-2029 ($ million)
- Exhibits130: Data Table on France - Market size and forecast 2024-2029 ($ million)
- Exhibits131: Chart on France - Year-over-year growth 2024-2029 (%)
- Exhibits132: Data Table on France - Year-over-year growth 2024-2029 (%)
- Exhibits133: Chart on Japan - Market size and forecast 2024-2029 ($ million)
- Exhibits134: Data Table on Japan - Market size and forecast 2024-2029 ($ million)
- Exhibits135: Chart on Japan - Year-over-year growth 2024-2029 (%)
- Exhibits136: Data Table on Japan - Year-over-year growth 2024-2029 (%)
- Exhibits137: Chart on Italy - Market size and forecast 2024-2029 ($ million)
- Exhibits138: Data Table on Italy - Market size and forecast 2024-2029 ($ million)
- Exhibits139: Chart on Italy - Year-over-year growth 2024-2029 (%)
- Exhibits140: Data Table on Italy - Year-over-year growth 2024-2029 (%)
- Exhibits141: Chart on India - Market size and forecast 2024-2029 ($ million)
- Exhibits142: Data Table on India - Market size and forecast 2024-2029 ($ million)
- Exhibits143: Chart on India - Year-over-year growth 2024-2029 (%)
- Exhibits144: Data Table on India - Year-over-year growth 2024-2029 (%)
- Exhibits145: Chart on South Korea - Market size and forecast 2024-2029 ($ million)
- Exhibits146: Data Table on South Korea - Market size and forecast 2024-2029 ($ million)
- Exhibits147: Chart on South Korea - Year-over-year growth 2024-2029 (%)
- Exhibits148: Data Table on South Korea - Year-over-year growth 2024-2029 (%)
- Exhibits149: Market opportunity By Geographical Landscape ($ million)
- Exhibits150: Data Tables on Market opportunity By Geographical Landscape ($ million)
- Exhibits151: Impact of drivers and challenges in 2024 and 2029
- Exhibits152: Overview on criticality of inputs and factors of differentiation
- Exhibits153: Overview on factors of disruption
- Exhibits154: Impact of key risks on business
- Exhibits155: Companies covered
- Exhibits156: Company ranking index
- Exhibits157: Matrix on companies position and classification
- Exhibits158: AbbVie Inc. - Overview
- Exhibits159: AbbVie Inc. - Product / Service
- Exhibits160: AbbVie Inc. - Key news
- Exhibits161: AbbVie Inc. - Key offerings
- Exhibits162: SWOT
- Exhibits163: Alcon Inc. - Overview
- Exhibits164: Alcon Inc. - Business segments
- Exhibits165: Alcon Inc. - Key news
- Exhibits166: Alcon Inc. - Key offerings
- Exhibits167: Alcon Inc. - Segment focus
- Exhibits168: SWOT
- Exhibits169: Alimera Sciences Inc. - Overview
- Exhibits170: Alimera Sciences Inc. - Product / Service
- Exhibits171: Alimera Sciences Inc. - Key offerings
- Exhibits172: SWOT
- Exhibits173: Bausch Health Companies Inc. - Overview
- Exhibits174: Bausch Health Companies Inc. - Business segments
- Exhibits175: Bausch Health Companies Inc. - Key news
- Exhibits176: Bausch Health Companies Inc. - Key offerings
- Exhibits177: Bausch Health Companies Inc. - Segment focus
- Exhibits178: SWOT
- Exhibits179: Bayer AG - Overview
- Exhibits180: Bayer AG - Business segments
- Exhibits181: Bayer AG - Key news
- Exhibits182: Bayer AG - Key offerings
- Exhibits183: Bayer AG - Segment focus
- Exhibits184: SWOT
- Exhibits185: Bristol Myers Squibb Co. - Overview
- Exhibits186: Bristol Myers Squibb Co. - Product / Service
- Exhibits187: Bristol Myers Squibb Co. - Key news
- Exhibits188: Bristol Myers Squibb Co. - Key offerings
- Exhibits189: SWOT
- Exhibits190: F. Hoffmann La Roche Ltd. - Overview
- Exhibits191: F. Hoffmann La Roche Ltd. - Business segments
- Exhibits192: F. Hoffmann La Roche Ltd. - Key news
- Exhibits193: F. Hoffmann La Roche Ltd. - Key offerings
- Exhibits194: F. Hoffmann La Roche Ltd. - Segment focus
- Exhibits195: SWOT
- Exhibits196: Johnson and Johnson Services Inc. - Overview
- Exhibits197: Johnson and Johnson Services Inc. - Business segments
- Exhibits198: Johnson and Johnson Services Inc. - Key news
- Exhibits199: Johnson and Johnson Services Inc. - Key offerings
- Exhibits200: Johnson and Johnson Services Inc. - Segment focus
- Exhibits201: SWOT
- Exhibits202: MeiraGTx Holdings Plc. - Overview
- Exhibits203: MeiraGTx Holdings Plc. - Product / Service
- Exhibits204: MeiraGTx Holdings Plc. - Key offerings
- Exhibits205: SWOT
- Exhibits206: Novartis AG - Overview
- Exhibits207: Novartis AG - Business segments
- Exhibits208: Novartis AG - Key news
- Exhibits209: Novartis AG - Key offerings
- Exhibits210: Novartis AG - Segment focus
- Exhibits211: SWOT
- Exhibits212: Ocular Therapeutix Inc - Overview
- Exhibits213: Ocular Therapeutix Inc - Product / Service
- Exhibits214: Ocular Therapeutix Inc - Key offerings
- Exhibits215: SWOT
- Exhibits216: Oxurion N - Overview
- Exhibits217: Oxurion N - Product / Service
- Exhibits218: Oxurion N - Key offerings
- Exhibits219: SWOT
- Exhibits220: Pfizer Inc. - Overview
- Exhibits221: Pfizer Inc. - Product / Service
- Exhibits222: Pfizer Inc. - Key news
- Exhibits223: Pfizer Inc. - Key offerings
- Exhibits224: SWOT
- Exhibits225: Regeneron Pharmaceuticals Inc. - Overview
- Exhibits226: Regeneron Pharmaceuticals Inc. - Product / Service
- Exhibits227: Regeneron Pharmaceuticals Inc. - Key offerings
- Exhibits228: SWOT
- Exhibits229: Sanofi SA - Overview
- Exhibits230: Sanofi SA - Business segments
- Exhibits231: Sanofi SA - Key news
- Exhibits232: Sanofi SA - Key offerings
- Exhibits233: Sanofi SA - Segment focus
- Exhibits234: SWOT
- Exhibits235: Inclusions checklist
- Exhibits236: Exclusions checklist
- Exhibits237: Currency conversion rates for US$
- Exhibits238: Research methodology
- Exhibits239: Information sources
- Exhibits240: Data validation
- Exhibits241: Validation techniques employed for market sizing
- Exhibits242: Data synthesis
- Exhibits243: 360 degree market analysis
- Exhibits244: List of abbreviations
The retinal drugs market is forecasted to grow by USD 9434.9 mn during 2024-2029, accelerating at a CAGR of 7.1% during the forecast period. The report on the retinal drugs market provides a holistic analysis, market size and forecast, trends, growth drivers, and challenges, as well as vendor analysis covering around 25 vendors.
The report offers an up-to-date analysis regarding the current market scenario, the latest trends and drivers, and the overall market environment. The market is driven by rise in prevalence of retinal diseases, emergence of advanced diagnostic tools, and patient assistance programs.
| Market Scope | |
|---|---|
| Base Year | 2025 |
| End Year | 2029 |
| Series Year | 2025-2029 |
| Growth Momentum | Accelerate |
| YOY 2025 | 6.5% |
| CAGR | 7.1% |
| Incremental Value | $9434.9 mn |
The study was conducted using an objective combination of primary and secondary information including inputs from key participants in the industry. The report contains a comprehensive market size data, segment with regional analysis and vendor landscape in addition to an analysis of the key companies. Reports have historic and forecast data.
Technavio's retinal drugs market is segmented as below:
By Distribution Channel
- Hospital pharmacy
- Retail pharmacy
- Online pharmacy
By Indication
- Macular degeneration
- Diabetic eye disease
- Others
By Drug Class
- VEGF-A antagonist
- TNF-A inhibitor
By Geographical Landscape
- North America
- Europe
- Asia
- Rest of World (ROW)
This study identifies the development of innovative therapies as one of the prime reasons driving the retinal drugs market growth during the next few years. Also, rise in demand for sustained-release ocular formulations and advances in diagnostic techniques will lead to sizable demand in the market.
The report on the retinal drugs market covers the following areas:
- Retinal Drugs Market sizing
- Retinal Drugs Market forecast
- Retinal Drugs Market industry analysis
The robust vendor analysis is designed to help clients improve their market position, and in line with this, this report provides a detailed analysis of several leading retinal drugs market vendors that include AbbVie Inc., Alcon Inc., Alimera Sciences Inc., Bausch Health Companies Inc., Bayer AG, Bristol Myers Squibb Co., F. Hoffmann La Roche Ltd., Johnson and Johnson Services Inc., Kubota Corp., MeiraGTx Holdings Plc., Novartis AG, Ocular Therapeutix Inc, Oxurion N, Pfizer Inc., Regeneron Pharmaceuticals Inc., REGENXBIO Inc, Sanofi SA, Santen Pharmaceutical Co. Ltd., Teva Pharmaceutical Industries Ltd., and Visufarma. Also, the retinal drugs market analysis report includes information on upcoming trends and challenges that will influence market growth. This is to help companies strategize and leverage all forthcoming growth opportunities.
The publisher presents a detailed picture of the market by the way of study, synthesis, and summation of data from multiple sources by an analysis of key parameters such as profit, pricing, competition, and promotions. It presents various market facets by identifying the key industry influencers. The data presented is comprehensive, reliable, and a result of extensive primary and secondary research. The market research reports provide a complete competitive landscape and an in-depth vendor selection methodology and analysis using qualitative and quantitative research to forecast accurate market growth.
Table of Contents
1 Executive Summary
- 1.1 Market overview
- Executive Summary - Chart on Market Overview
- Executive Summary - Data Table on Market Overview
- Executive Summary - Chart on Global Market Characteristics
- Executive Summary - Chart on Market By Geographical Landscape
- Executive Summary - Chart on Market Segmentation by Distribution Channel
- Executive Summary - Chart on Market Segmentation by Indication
- Executive Summary - Chart on Market Segmentation by Drug Class
- Executive Summary - Chart on Incremental Growth
- Executive Summary - Data Table on Incremental Growth
- Executive Summary - Chart on Company Market Positioning
2 Technavio Analysis
- 2.1 Analysis of price sensitivity, lifecycle, customer purchase basket, adoption rates, and purchase criteria
- Analysis of price sensitivity, lifecycle, customer purchase basket, adoption rates, and purchase criteria
- 2.2 Criticality of inputs and Factors of differentiation
- Overview on criticality of inputs and factors of differentiation
- 2.3 Factors of disruption
- Overview on factors of disruption
- 2.4 Impact of drivers and challenges
- Impact of drivers and challenges in 2024 and 2029
3 Market Landscape
- 3.1 Market ecosystem
- Parent Market
- Data Table on - Parent Market
- 3.2 Market characteristics
- Market characteristics analysis
- 3.3 Value chain analysis
- Value chain analysis
4 Market Sizing
- 4.1 Market definition
- Offerings of companies included in the market definition
- 4.2 Market segment analysis
- Market segments
- 4.3 Market size 2024
- 4.4 Market outlook: Forecast for 2024-2029
- Chart on Global - Market size and forecast 2024-2029 ($ million)
- Data Table on Global - Market size and forecast 2024-2029 ($ million)
- Chart on Global Market: Year-over-year growth 2024-2029 (%)
- Data Table on Global Market: Year-over-year growth 2024-2029 (%)
5 Historic Market Size
- 5.1 Global Retinal Drugs Market 2019 - 2023
- Historic Market Size - Data Table on Global Retinal Drugs Market 2019 - 2023 ($ million)
- 5.2 Distribution Channel segment analysis 2019 - 2023
- Historic Market Size - Distribution Channel Segment 2019 - 2023 ($ million)
- 5.3 Indication segment analysis 2019 - 2023
- Historic Market Size - Indication Segment 2019 - 2023 ($ million)
- 5.4 Drug Class segment analysis 2019 - 2023
- Historic Market Size - Drug Class Segment 2019 - 2023 ($ million)
- 5.5 Geography segment analysis 2019 - 2023
- Historic Market Size - Geography Segment 2019 - 2023 ($ million)
- 5.6 Country segment analysis 2019 - 2023
- Historic Market Size - Country Segment 2019 - 2023 ($ million)
6 Qualitative Analysis
- 6.1 The AI impact on global retinal drugs market
7 Five Forces Analysis
- 7.1 Five forces summary
- Five forces analysis - Comparison between 2024 and 2029
- 7.2 Bargaining power of buyers
- Bargaining power of buyers - Impact of key factors 2024 and 2029
- 7.3 Bargaining power of suppliers
- Bargaining power of suppliers - Impact of key factors in 2024 and 2029
- 7.4 Threat of new entrants
- Threat of new entrants - Impact of key factors in 2024 and 2029
- 7.5 Threat of substitutes
- Threat of substitutes - Impact of key factors in 2024 and 2029
- 7.6 Threat of rivalry
- Threat of rivalry - Impact of key factors in 2024 and 2029
- 7.7 Market condition
- Chart on Market condition - Five forces 2024 and 2029
8 Market Segmentation by Distribution Channel
- 8.1 Market segments
- Chart on Distribution Channel - Market share 2024-2029 (%)
- Data Table on Distribution Channel - Market share 2024-2029 (%)
- 8.2 Comparison by Distribution Channel
- Chart on Comparison by Distribution Channel
- Data Table on Comparison by Distribution Channel
- 8.3 Hospital pharmacy - Market size and forecast 2024-2029
- Chart on Hospital pharmacy - Market size and forecast 2024-2029 ($ million)
- Data Table on Hospital pharmacy - Market size and forecast 2024-2029 ($ million)
- Chart on Hospital pharmacy - Year-over-year growth 2024-2029 (%)
- Data Table on Hospital pharmacy - Year-over-year growth 2024-2029 (%)
- 8.4 Retail pharmacy - Market size and forecast 2024-2029
- Chart on Retail pharmacy - Market size and forecast 2024-2029 ($ million)
- Data Table on Retail pharmacy - Market size and forecast 2024-2029 ($ million)
- Chart on Retail pharmacy - Year-over-year growth 2024-2029 (%)
- Data Table on Retail pharmacy - Year-over-year growth 2024-2029 (%)
- 8.5 Online pharmacy - Market size and forecast 2024-2029
- Chart on Online pharmacy - Market size and forecast 2024-2029 ($ million)
- Data Table on Online pharmacy - Market size and forecast 2024-2029 ($ million)
- Chart on Online pharmacy - Year-over-year growth 2024-2029 (%)
- Data Table on Online pharmacy - Year-over-year growth 2024-2029 (%)
- 8.6 Market opportunity by Distribution Channel
- Market opportunity by Distribution Channel ($ million)
- Data Table on Market opportunity by Distribution Channel ($ million)
9 Market Segmentation by Indication
- 9.1 Market segments
- Chart on Indication - Market share 2024-2029 (%)
- Data Table on Indication - Market share 2024-2029 (%)
- 9.2 Comparison by Indication
- Chart on Comparison by Indication
- Data Table on Comparison by Indication
- 9.3 Macular degeneration - Market size and forecast 2024-2029
- Chart on Macular degeneration - Market size and forecast 2024-2029 ($ million)
- Data Table on Macular degeneration - Market size and forecast 2024-2029 ($ million)
- Chart on Macular degeneration - Year-over-year growth 2024-2029 (%)
- Data Table on Macular degeneration - Year-over-year growth 2024-2029 (%)
- 9.4 Diabetic eye disease - Market size and forecast 2024-2029
- Chart on Diabetic eye disease - Market size and forecast 2024-2029 ($ million)
- Data Table on Diabetic eye disease - Market size and forecast 2024-2029 ($ million)
- Chart on Diabetic eye disease - Year-over-year growth 2024-2029 (%)
- Data Table on Diabetic eye disease - Year-over-year growth 2024-2029 (%)
- 9.5 Others - Market size and forecast 2024-2029
- Chart on Others - Market size and forecast 2024-2029 ($ million)
- Data Table on Others - Market size and forecast 2024-2029 ($ million)
- Chart on Others - Year-over-year growth 2024-2029 (%)
- Data Table on Others - Year-over-year growth 2024-2029 (%)
- 9.6 Market opportunity by Indication
- Market opportunity by Indication ($ million)
- Data Table on Market opportunity by Indication ($ million)
10 Market Segmentation by Drug Class
- 10.1 Market segments
- Chart on Drug Class - Market share 2024-2029 (%)
- Data Table on Drug Class - Market share 2024-2029 (%)
- 10.2 Comparison by Drug Class
- Chart on Comparison by Drug Class
- Data Table on Comparison by Drug Class
- 10.3 VEGF-A antagonist - Market size and forecast 2024-2029
- Chart on VEGF-A antagonist - Market size and forecast 2024-2029 ($ million)
- Data Table on VEGF-A antagonist - Market size and forecast 2024-2029 ($ million)
- Chart on VEGF-A antagonist - Year-over-year growth 2024-2029 (%)
- Data Table on VEGF-A antagonist - Year-over-year growth 2024-2029 (%)
- 10.4 TNF-A inhibitor - Market size and forecast 2024-2029
- Chart on TNF-A inhibitor - Market size and forecast 2024-2029 ($ million)
- Data Table on TNF-A inhibitor - Market size and forecast 2024-2029 ($ million)
- Chart on TNF-A inhibitor - Year-over-year growth 2024-2029 (%)
- Data Table on TNF-A inhibitor - Year-over-year growth 2024-2029 (%)
- 10.5 Market opportunity by Drug Class
- Market opportunity by Drug Class ($ million)
- Data Table on Market opportunity by Drug Class ($ million)
11 Customer Landscape
- 11.1 Customer landscape overview
- Analysis of price sensitivity, lifecycle, customer purchase basket, adoption rates, and purchase criteria
12 Geographic Landscape
- 12.1 Geographic segmentation
- Chart on Market share By Geographical Landscape 2024-2029 (%)
- Data Table on Market share By Geographical Landscape 2024-2029 (%)
- 12.2 Geographic comparison
- Chart on Geographic comparison
- Data Table on Geographic comparison
- 12.3 North America - Market size and forecast 2024-2029
- Chart on North America - Market size and forecast 2024-2029 ($ million)
- Data Table on North America - Market size and forecast 2024-2029 ($ million)
- Chart on North America - Year-over-year growth 2024-2029 (%)
- Data Table on North America - Year-over-year growth 2024-2029 (%)
- 12.4 Europe - Market size and forecast 2024-2029
- Chart on Europe - Market size and forecast 2024-2029 ($ million)
- Data Table on Europe - Market size and forecast 2024-2029 ($ million)
- Chart on Europe - Year-over-year growth 2024-2029 (%)
- Data Table on Europe - Year-over-year growth 2024-2029 (%)
- 12.5 Asia - Market size and forecast 2024-2029
- Chart on Asia - Market size and forecast 2024-2029 ($ million)
- Data Table on Asia - Market size and forecast 2024-2029 ($ million)
- Chart on Asia - Year-over-year growth 2024-2029 (%)
- Data Table on Asia - Year-over-year growth 2024-2029 (%)
- 12.6 Rest of World (ROW) - Market size and forecast 2024-2029
- Chart on Rest of World (ROW) - Market size and forecast 2024-2029 ($ million)
- Data Table on Rest of World (ROW) - Market size and forecast 2024-2029 ($ million)
- Chart on Rest of World (ROW) - Year-over-year growth 2024-2029 (%)
- Data Table on Rest of World (ROW) - Year-over-year growth 2024-2029 (%)
- 12.7 US - Market size and forecast 2024-2029
- Chart on US - Market size and forecast 2024-2029 ($ million)
- Data Table on US - Market size and forecast 2024-2029 ($ million)
- Chart on US - Year-over-year growth 2024-2029 (%)
- Data Table on US - Year-over-year growth 2024-2029 (%)
- 12.8 Germany - Market size and forecast 2024-2029
- Chart on Germany - Market size and forecast 2024-2029 ($ million)
- Data Table on Germany - Market size and forecast 2024-2029 ($ million)
- Chart on Germany - Year-over-year growth 2024-2029 (%)
- Data Table on Germany - Year-over-year growth 2024-2029 (%)
- 12.9 Canada - Market size and forecast 2024-2029
- Chart on Canada - Market size and forecast 2024-2029 ($ million)
- Data Table on Canada - Market size and forecast 2024-2029 ($ million)
- Chart on Canada - Year-over-year growth 2024-2029 (%)
- Data Table on Canada - Year-over-year growth 2024-2029 (%)
- 12.10 China - Market size and forecast 2024-2029
- Chart on China - Market size and forecast 2024-2029 ($ million)
- Data Table on China - Market size and forecast 2024-2029 ($ million)
- Chart on China - Year-over-year growth 2024-2029 (%)
- Data Table on China - Year-over-year growth 2024-2029 (%)
- 12.11 UK - Market size and forecast 2024-2029
- Chart on UK - Market size and forecast 2024-2029 ($ million)
- Data Table on UK - Market size and forecast 2024-2029 ($ million)
- Chart on UK - Year-over-year growth 2024-2029 (%)
- Data Table on UK - Year-over-year growth 2024-2029 (%)
- 12.12 France - Market size and forecast 2024-2029
- Chart on France - Market size and forecast 2024-2029 ($ million)
- Data Table on France - Market size and forecast 2024-2029 ($ million)
- Chart on France - Year-over-year growth 2024-2029 (%)
- Data Table on France - Year-over-year growth 2024-2029 (%)
- 12.13 Japan - Market size and forecast 2024-2029
- Chart on Japan - Market size and forecast 2024-2029 ($ million)
- Data Table on Japan - Market size and forecast 2024-2029 ($ million)
- Chart on Japan - Year-over-year growth 2024-2029 (%)
- Data Table on Japan - Year-over-year growth 2024-2029 (%)
- 12.14 Italy - Market size and forecast 2024-2029
- Chart on Italy - Market size and forecast 2024-2029 ($ million)
- Data Table on Italy - Market size and forecast 2024-2029 ($ million)
- Chart on Italy - Year-over-year growth 2024-2029 (%)
- Data Table on Italy - Year-over-year growth 2024-2029 (%)
- 12.15 India - Market size and forecast 2024-2029
- Chart on India - Market size and forecast 2024-2029 ($ million)
- Data Table on India - Market size and forecast 2024-2029 ($ million)
- Chart on India - Year-over-year growth 2024-2029 (%)
- Data Table on India - Year-over-year growth 2024-2029 (%)
- 12.16 South Korea - Market size and forecast 2024-2029
- Chart on South Korea - Market size and forecast 2024-2029 ($ million)
- Data Table on South Korea - Market size and forecast 2024-2029 ($ million)
- Chart on South Korea - Year-over-year growth 2024-2029 (%)
- Data Table on South Korea - Year-over-year growth 2024-2029 (%)
- 12.17 Market opportunity By Geographical Landscape
- Market opportunity By Geographical Landscape ($ million)
- Data Tables on Market opportunity By Geographical Landscape ($ million)
13 Drivers, Challenges, and Opportunity/Restraints
- 13.1 Market drivers
- 13.2 Market challenges
- 13.3 Impact of drivers and challenges
- Impact of drivers and challenges in 2024 and 2029
- 13.4 Market opportunities/restraints
14 Competitive Landscape
- 14.1 Overview
- 14.2 Competitive Landscape
- Overview on criticality of inputs and factors of differentiation
- 14.3 Landscape disruption
- Overview on factors of disruption
- 14.4 Industry risks
- Impact of key risks on business
15 Competitive Analysis
- 15.1 Companies profiled
- Companies covered
- 15.2 Company ranking index
- Company ranking index
- 15.3 Market positioning of companies
- Matrix on companies position and classification
- 15.4 AbbVie Inc.
- AbbVie Inc. - Overview
- AbbVie Inc. - Product / Service
- AbbVie Inc. - Key news
- AbbVie Inc. - Key offerings
- SWOT
- 15.5 Alcon Inc.
- Alcon Inc. - Overview
- Alcon Inc. - Business segments
- Alcon Inc. - Key news
- Alcon Inc. - Key offerings
- Alcon Inc. - Segment focus
- SWOT
- 15.6 Alimera Sciences Inc.
- Alimera Sciences Inc. - Overview
- Alimera Sciences Inc. - Product / Service
- Alimera Sciences Inc. - Key offerings
- SWOT
- 15.7 Bausch Health Companies Inc.
- Bausch Health Companies Inc. - Overview
- Bausch Health Companies Inc. - Business segments
- Bausch Health Companies Inc. - Key news
- Bausch Health Companies Inc. - Key offerings
- Bausch Health Companies Inc. - Segment focus
- SWOT
- 15.8 Bayer AG
- Bayer AG - Overview
- Bayer AG - Business segments
- Bayer AG - Key news
- Bayer AG - Key offerings
- Bayer AG - Segment focus
- SWOT
- 15.9 Bristol Myers Squibb Co.
- Bristol Myers Squibb Co. - Overview
- Bristol Myers Squibb Co. - Product / Service
- Bristol Myers Squibb Co. - Key news
- Bristol Myers Squibb Co. - Key offerings
- SWOT
- 15.10 F. Hoffmann La Roche Ltd.
- F. Hoffmann La Roche Ltd. - Overview
- F. Hoffmann La Roche Ltd. - Business segments
- F. Hoffmann La Roche Ltd. - Key news
- F. Hoffmann La Roche Ltd. - Key offerings
- F. Hoffmann La Roche Ltd. - Segment focus
- SWOT
- 15.11 Johnson and Johnson Services Inc.
- Johnson and Johnson Services Inc. - Overview
- Johnson and Johnson Services Inc. - Business segments
- Johnson and Johnson Services Inc. - Key news
- Johnson and Johnson Services Inc. - Key offerings
- Johnson and Johnson Services Inc. - Segment focus
- SWOT
- 15.12 MeiraGTx Holdings Plc.
- MeiraGTx Holdings Plc. - Overview
- MeiraGTx Holdings Plc. - Product / Service
- MeiraGTx Holdings Plc. - Key offerings
- SWOT
- 15.13 Novartis AG
- Novartis AG - Overview
- Novartis AG - Business segments
- Novartis AG - Key news
- Novartis AG - Key offerings
- Novartis AG - Segment focus
- SWOT
- 15.14 Ocular Therapeutix Inc
- Ocular Therapeutix Inc - Overview
- Ocular Therapeutix Inc - Product / Service
- Ocular Therapeutix Inc - Key offerings
- SWOT
- 15.15 Oxurion N
- Oxurion N - Overview
- Oxurion N - Product / Service
- Oxurion N - Key offerings
- SWOT
- 15.16 Pfizer Inc.
- Pfizer Inc. - Overview
- Pfizer Inc. - Product / Service
- Pfizer Inc. - Key news
- Pfizer Inc. - Key offerings
- SWOT
- 15.17 Regeneron Pharmaceuticals Inc.
- Regeneron Pharmaceuticals Inc. - Overview
- Regeneron Pharmaceuticals Inc. - Product / Service
- Regeneron Pharmaceuticals Inc. - Key offerings
- SWOT
- 15.18 Sanofi SA
- Sanofi SA - Overview
- Sanofi SA - Business segments
- Sanofi SA - Key news
- Sanofi SA - Key offerings
- Sanofi SA - Segment focus
- SWOT
16 Appendix
- 16.1 Scope of the report
- 16.2 Inclusions and exclusions checklist
- Inclusions checklist
- Exclusions checklist
- 16.3 Currency conversion rates for US$
- Currency conversion rates for US$
- 16.4 Research methodology
- Research methodology
- 16.5 Data procurement
- Information sources
- 16.6 Data validation
- Data validation
- 16.7 Validation techniques employed for market sizing
- Validation techniques employed for market sizing
- 16.8 Data synthesis
- Data synthesis
- 16.9 360 degree market analysis
- 360 degree market analysis
- 16.10 List of abbreviations
- List of abbreviations

