|
|
市場調査レポート
商品コード
1685009
災害救援ロジスティクスの世界市場 2025~2029年Global Disaster Relief Logistics Market 2025-2029 |
||||||

|
|||||||
カスタマイズ可能
|
|||||||


| 災害救援ロジスティクスの世界市場 2025~2029年 |
|
出版日: 2025年03月12日
発行: TechNavio
ページ情報: 英文 252 Pages
納期: 即納可能
|

全表示
- 概要
- 図表
- 目次
災害救援ロジスティクス市場は2024-2029年に75億7,930万米ドル、予測期間中のCAGRは5.2%で成長すると予測されます。
当レポートでは、災害救援ロジスティクス市場の全体的な分析、市場規模・予測、動向、成長促進要因、課題、約25のベンダーを網羅したベンダー分析などを掲載しています。
現在の市場シナリオ、最新動向と促進要因、市場環境全体に関する最新分析を提供しています。市場は、物流業務を処理する熟練した物流事業者に対する需要の高まり、世界中で自然災害の発生が増加していること、NGOや政府が物流リスクを軽減するために物流事業者と提携していることなどが牽引しています。
| 市場範囲 | |
|---|---|
| 基準年 | 2025 |
| 終了年 | 2029 |
| 予測期間 | 2025-2029 |
| 成長モメンタム | 加速 |
| 前年比2025年 | 4.8% |
| CAGR | 5.2% |
| 増分額 | 75億7,930万米ドル |
本調査は、業界の主要参加者からのインプットを含め、一次情報と二次情報を客観的に組み合わせて実施しました。レポートには、主要企業の分析に加え、包括的な市場規模データ、地域分析によるセグメント、ベンダー情勢が含まれています。レポートには過去データと予測データがあります。
この調査レポートは、今後数年間の災害救援ロジスティクス市場の成長を促進する主な理由の1つとして、災害救援ロジスティクス用ドローンの普及を挙げています。また、3Dプリンティングへのアクセスの増加は、物流のリードタイムの短縮に役立ち、世界の物流企業は複数の利害関係者との通信チャネルを削減することで、市場の大きな需要につながります。
目次
第1章 エグゼクティブサマリー
- 市場概要
第2章 Technavio分析
- 価格・ライフサイクル・顧客購入バスケット・採用率・購入基準の分析
- インプットの重要性と差別化の要因
- 混乱の要因
- 促進要因と課題の影響
第3章 市場情勢
- 市場エコシステム
- 市場の特徴
- バリューチェーン分析
第4章 市場規模
- 市場の定義
- 市場セグメント分析
- 市場規模 2024
- 市場の見通し 2024-2029
第5章 市場規模実績
- 災害救援ロジスティクスの世界市場 2019-2023
- サービス別セグメント分析 2019-2023
- 素材別セグメント分析 2019-2023
- タイプ別セグメント分析 2019-2023
- サービス別タイプセグメント分析 2019-2023
- エンドユーザー別セグメント分析 2019-2023
- 地域別セグメント分析 2019-2023
- 国別セグメント分析 2019-2023
第6章 定性分析
- AIの影響:災害救援ロジスティクスの世界市場
第7章 ファイブフォース分析
- ファイブフォースの要約
- 買い手の交渉力
- 供給企業の交渉力
- 新規参入業者の脅威
- 代替品の脅威
- 競争の脅威
- 市況
第8章 市場セグメンテーション:サービス別
- 市場セグメント
- 比較:サービス別
- 救援物資輸送:市場規模と予測 2024-2029
- 救援・援助ロジスティクス:市場規模と予測 2024-2029
- 市場機会:サービス別
第9章 市場セグメンテーション:素材別
- 市場セグメント
- 比較:素材別
- 食品:市場規模と予測 2024-2029
- 医療:市場規模と予測 2024-2029
- 市場機会:素材別
第10章 市場セグメンテーション:タイプ別
- 市場セグメント
- 比較:タイプ別
- 陸:市場規模と予測 2024-2029
- 空:市場規模と予測 2024-2029
- 海:市場規模と予測 2024-2029
- 市場機会:タイプ別
第11章 市場セグメンテーション:サービスタイプ別
- 市場セグメント
- 比較:サービスタイプ別
- 自社物流:市場規模と予測 2024-2029
- 第三者物流:市場規模と予測 2024-2029
- 第四者物流:市場規模と予測 2024-2029
- 市場機会:サービスタイプ別
第12章 市場セグメンテーション:エンドユーザー別
- 市場セグメント
- 比較:エンドユーザー別
- 政府機関:市場規模と予測 2024-2029
- 非政府組織:市場規模と予測 2024-2029
- 法人:市場規模と予測 2024-2029
- 個人:市場規模と予測 2024-2029
- 市場機会:エンドユーザー別
第13章 顧客情勢
- 顧客情勢の概要
第14章 地域別情勢
- 地域別セグメンテーション
- 地域別比較
- 北米:市場規模と予測 2024-2029
- 欧州:市場規模と予測 2024-2029
- アジア太平洋:市場規模と予測 2024-2029
- 南米:市場規模と予測 2024-2029
- 中東・アフリカ:市場規模と予測 2024-2029
- 米国:市場規模と予測 2024-2029
- カナダ:市場規模と予測 2024-2029
- 中国:市場規模と予測 2024-2029
- 英国:市場規模と予測 2024-2029
- 日本:市場規模と予測 2024-2029
- ドイツ:市場規模と予測 2024-2029
- インド:市場規模と予測 2024-2029
- フランス:市場規模と予測 2024-2029
- イタリア:市場規模と予測 2024-2029
- 韓国:市場規模と予測 2024-2029
- 市場機会:地域情勢別
第15章 促進要因・課題・機会・抑制要因
- 市場促進要因
- 市場の課題
- 促進要因と課題の影響
- 市場の機会・抑制要因
第16章 競合情勢
- 概要
- 競合情勢
- 混乱の状況
- 業界のリスク
第17章 競合分析
- 企業プロファイル
- 企業ランキング指数
- 企業の市場ポジショニング
- Agility Public Warehousing Co. K.S.C.P
- Air Charter Service Group Ltd.
- AP Moller Maersk AS
- Blue Water Shipping AS
- CSafe Global
- Deutsche Post AG
- FreightCenter Inc.
- JAS Worldwide Inc.
- Kuehne Nagel Management AG
- Lynden Inc.
- Next Exit Logistics
- ODW Logistics
- SEKO Logistics
- Scan Global Logistics
- United Parcel Service Inc.
第18章 付録
Exhibits:
- Exhibits1: Executive Summary - Chart on Market Overview
- Exhibits2: Executive Summary - Data Table on Market Overview
- Exhibits3: Executive Summary - Chart on Global Market Characteristics
- Exhibits4: Executive Summary - Chart on Market By Geographical Landscape
- Exhibits5: Executive Summary - Chart on Market Segmentation by Service
- Exhibits6: Executive Summary - Chart on Market Segmentation by Material
- Exhibits7: Executive Summary - Chart on Market Segmentation by Type
- Exhibits8: Executive Summary - Chart on Market Segmentation by Service Type
- Exhibits9: Executive Summary - Chart on Market Segmentation by End-user
- Exhibits10: Executive Summary - Chart on Incremental Growth
- Exhibits11: Executive Summary - Data Table on Incremental Growth
- Exhibits12: Executive Summary - Chart on Company Market Positioning
- Exhibits13: Analysis of price sensitivity, lifecycle, customer purchase basket, adoption rates, and purchase criteria
- Exhibits14: Overview on criticality of inputs and factors of differentiation
- Exhibits15: Overview on factors of disruption
- Exhibits16: Impact of drivers and challenges in 2024 and 2029
- Exhibits17: Parent Market
- Exhibits18: Data Table on - Parent Market
- Exhibits19: Market characteristics analysis
- Exhibits20: Value chain analysis
- Exhibits21: Offerings of companies included in the market definition
- Exhibits22: Market segments
- Exhibits23: Chart on Global - Market size and forecast 2024-2029 ($ million)
- Exhibits24: Data Table on Global - Market size and forecast 2024-2029 ($ million)
- Exhibits25: Chart on Global Market: Year-over-year growth 2024-2029 (%)
- Exhibits26: Data Table on Global Market: Year-over-year growth 2024-2029 (%)
- Exhibits27: Historic Market Size - Data Table on Global Disaster Relief Logistics Market 2019 - 2023 ($ million)
- Exhibits28: Historic Market Size - Service Segment 2019 - 2023 ($ million)
- Exhibits29: Historic Market Size - Material Segment 2019 - 2023 ($ million)
- Exhibits30: Historic Market Size - Type Segment 2019 - 2023 ($ million)
- Exhibits31: Historic Market Size - Service Type Segment 2019 - 2023 ($ million)
- Exhibits32: Historic Market Size - End-user Segment 2019 - 2023 ($ million)
- Exhibits33: Historic Market Size - Geography Segment 2019 - 2023 ($ million)
- Exhibits34: Historic Market Size - Country Segment 2019 - 2023 ($ million)
- Exhibits35: Five forces analysis - Comparison between 2024 and 2029
- Exhibits36: Bargaining power of buyers - Impact of key factors 2024 and 2029
- Exhibits37: Bargaining power of suppliers - Impact of key factors in 2024 and 2029
- Exhibits38: Threat of new entrants - Impact of key factors in 2024 and 2029
- Exhibits39: Threat of substitutes - Impact of key factors in 2024 and 2029
- Exhibits40: Threat of rivalry - Impact of key factors in 2024 and 2029
- Exhibits41: Chart on Market condition - Five forces 2024 and 2029
- Exhibits42: Chart on Service - Market share 2024-2029 (%)
- Exhibits43: Data Table on Service - Market share 2024-2029 (%)
- Exhibits44: Chart on Comparison by Service
- Exhibits45: Data Table on Comparison by Service
- Exhibits46: Chart on Relief and aid transportation - Market size and forecast 2024-2029 ($ million)
- Exhibits47: Data Table on Relief and aid transportation - Market size and forecast 2024-2029 ($ million)
- Exhibits48: Chart on Relief and aid transportation - Year-over-year growth 2024-2029 (%)
- Exhibits49: Data Table on Relief and aid transportation - Year-over-year growth 2024-2029 (%)
- Exhibits50: Chart on Relief and aid logistics - Market size and forecast 2024-2029 ($ million)
- Exhibits51: Data Table on Relief and aid logistics - Market size and forecast 2024-2029 ($ million)
- Exhibits52: Chart on Relief and aid logistics - Year-over-year growth 2024-2029 (%)
- Exhibits53: Data Table on Relief and aid logistics - Year-over-year growth 2024-2029 (%)
- Exhibits54: Market opportunity by Service ($ million)
- Exhibits55: Data Table on Market opportunity by Service ($ million)
- Exhibits56: Chart on Material - Market share 2024-2029 (%)
- Exhibits57: Data Table on Material - Market share 2024-2029 (%)
- Exhibits58: Chart on Comparison by Material
- Exhibits59: Data Table on Comparison by Material
- Exhibits60: Chart on Food - Market size and forecast 2024-2029 ($ million)
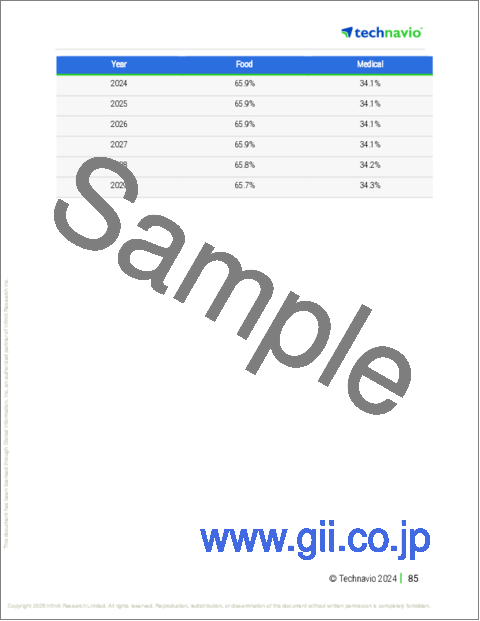
- Exhibits61: Data Table on Food - Market size and forecast 2024-2029 ($ million)
- Exhibits62: Chart on Food - Year-over-year growth 2024-2029 (%)
- Exhibits63: Data Table on Food - Year-over-year growth 2024-2029 (%)
- Exhibits64: Chart on Medical - Market size and forecast 2024-2029 ($ million)
- Exhibits65: Data Table on Medical - Market size and forecast 2024-2029 ($ million)
- Exhibits66: Chart on Medical - Year-over-year growth 2024-2029 (%)
- Exhibits67: Data Table on Medical - Year-over-year growth 2024-2029 (%)
- Exhibits68: Market opportunity by Material ($ million)
- Exhibits69: Data Table on Market opportunity by Material ($ million)
- Exhibits70: Chart on Type - Market share 2024-2029 (%)
- Exhibits71: Data Table on Type - Market share 2024-2029 (%)
- Exhibits72: Chart on Comparison by Type
- Exhibits73: Data Table on Comparison by Type
- Exhibits74: Chart on Land - Market size and forecast 2024-2029 ($ million)
- Exhibits75: Data Table on Land - Market size and forecast 2024-2029 ($ million)
- Exhibits76: Chart on Land - Year-over-year growth 2024-2029 (%)
- Exhibits77: Data Table on Land - Year-over-year growth 2024-2029 (%)
- Exhibits78: Chart on Air - Market size and forecast 2024-2029 ($ million)
- Exhibits79: Data Table on Air - Market size and forecast 2024-2029 ($ million)
- Exhibits80: Chart on Air - Year-over-year growth 2024-2029 (%)
- Exhibits81: Data Table on Air - Year-over-year growth 2024-2029 (%)
- Exhibits82: Chart on Sea - Market size and forecast 2024-2029 ($ million)
- Exhibits83: Data Table on Sea - Market size and forecast 2024-2029 ($ million)
- Exhibits84: Chart on Sea - Year-over-year growth 2024-2029 (%)
- Exhibits85: Data Table on Sea - Year-over-year growth 2024-2029 (%)
- Exhibits86: Market opportunity by Type ($ million)
- Exhibits87: Data Table on Market opportunity by Type ($ million)
- Exhibits88: Chart on Service Type - Market share 2024-2029 (%)
- Exhibits89: Data Table on Service Type - Market share 2024-2029 (%)
- Exhibits90: Chart on Comparison by Service Type
- Exhibits91: Data Table on Comparison by Service Type
- Exhibits92: Chart on First-party logistics - Market size and forecast 2024-2029 ($ million)
- Exhibits93: Data Table on First-party logistics - Market size and forecast 2024-2029 ($ million)
- Exhibits94: Chart on First-party logistics - Year-over-year growth 2024-2029 (%)
- Exhibits95: Data Table on First-party logistics - Year-over-year growth 2024-2029 (%)
- Exhibits96: Chart on Third-party logistics - Market size and forecast 2024-2029 ($ million)
- Exhibits97: Data Table on Third-party logistics - Market size and forecast 2024-2029 ($ million)
- Exhibits98: Chart on Third-party logistics - Year-over-year growth 2024-2029 (%)
- Exhibits99: Data Table on Third-party logistics - Year-over-year growth 2024-2029 (%)
- Exhibits100: Chart on Fourth-party logistics - Market size and forecast 2024-2029 ($ million)
- Exhibits101: Data Table on Fourth-party logistics - Market size and forecast 2024-2029 ($ million)
- Exhibits102: Chart on Fourth-party logistics - Year-over-year growth 2024-2029 (%)
- Exhibits103: Data Table on Fourth-party logistics - Year-over-year growth 2024-2029 (%)
- Exhibits104: Market opportunity by Service Type ($ million)
- Exhibits105: Data Table on Market opportunity by Service Type ($ million)
- Exhibits106: Chart on End-user - Market share 2024-2029 (%)
- Exhibits107: Data Table on End-user - Market share 2024-2029 (%)
- Exhibits108: Chart on Comparison by End-user
- Exhibits109: Data Table on Comparison by End-user
- Exhibits110: Chart on Government agencies - Market size and forecast 2024-2029 ($ million)
- Exhibits111: Data Table on Government agencies - Market size and forecast 2024-2029 ($ million)
- Exhibits112: Chart on Government agencies - Year-over-year growth 2024-2029 (%)
- Exhibits113: Data Table on Government agencies - Year-over-year growth 2024-2029 (%)
- Exhibits114: Chart on Non-governmental organizations - Market size and forecast 2024-2029 ($ million)
- Exhibits115: Data Table on Non-governmental organizations - Market size and forecast 2024-2029 ($ million)
- Exhibits116: Chart on Non-governmental organizations - Year-over-year growth 2024-2029 (%)
- Exhibits117: Data Table on Non-governmental organizations - Year-over-year growth 2024-2029 (%)
- Exhibits118: Chart on Corporate entities - Market size and forecast 2024-2029 ($ million)
- Exhibits119: Data Table on Corporate entities - Market size and forecast 2024-2029 ($ million)
- Exhibits120: Chart on Corporate entities - Year-over-year growth 2024-2029 (%)
- Exhibits121: Data Table on Corporate entities - Year-over-year growth 2024-2029 (%)
- Exhibits122: Chart on Individuals - Market size and forecast 2024-2029 ($ million)
- Exhibits123: Data Table on Individuals - Market size and forecast 2024-2029 ($ million)
- Exhibits124: Chart on Individuals - Year-over-year growth 2024-2029 (%)
- Exhibits125: Data Table on Individuals - Year-over-year growth 2024-2029 (%)
- Exhibits126: Market opportunity by End-user ($ million)
- Exhibits127: Data Table on Market opportunity by End-user ($ million)
- Exhibits128: Analysis of price sensitivity, lifecycle, customer purchase basket, adoption rates, and purchase criteria
- Exhibits129: Chart on Market share By Geographical Landscape 2024-2029 (%)
- Exhibits130: Data Table on Market share By Geographical Landscape 2024-2029 (%)
- Exhibits131: Chart on Geographic comparison
- Exhibits132: Data Table on Geographic comparison
- Exhibits133: Chart on North America - Market size and forecast 2024-2029 ($ million)
- Exhibits134: Data Table on North America - Market size and forecast 2024-2029 ($ million)
- Exhibits135: Chart on North America - Year-over-year growth 2024-2029 (%)
- Exhibits136: Data Table on North America - Year-over-year growth 2024-2029 (%)
- Exhibits137: Chart on Europe - Market size and forecast 2024-2029 ($ million)
- Exhibits138: Data Table on Europe - Market size and forecast 2024-2029 ($ million)
- Exhibits139: Chart on Europe - Year-over-year growth 2024-2029 (%)
- Exhibits140: Data Table on Europe - Year-over-year growth 2024-2029 (%)
- Exhibits141: Chart on APAC - Market size and forecast 2024-2029 ($ million)
- Exhibits142: Data Table on APAC - Market size and forecast 2024-2029 ($ million)
- Exhibits143: Chart on APAC - Year-over-year growth 2024-2029 (%)
- Exhibits144: Data Table on APAC - Year-over-year growth 2024-2029 (%)
- Exhibits145: Chart on South America - Market size and forecast 2024-2029 ($ million)
- Exhibits146: Data Table on South America - Market size and forecast 2024-2029 ($ million)
- Exhibits147: Chart on South America - Year-over-year growth 2024-2029 (%)
- Exhibits148: Data Table on South America - Year-over-year growth 2024-2029 (%)
- Exhibits149: Chart on Middle East and Africa - Market size and forecast 2024-2029 ($ million)
- Exhibits150: Data Table on Middle East and Africa - Market size and forecast 2024-2029 ($ million)
- Exhibits151: Chart on Middle East and Africa - Year-over-year growth 2024-2029 (%)
- Exhibits152: Data Table on Middle East and Africa - Year-over-year growth 2024-2029 (%)
- Exhibits153: Chart on US - Market size and forecast 2024-2029 ($ million)
- Exhibits154: Data Table on US - Market size and forecast 2024-2029 ($ million)
- Exhibits155: Chart on US - Year-over-year growth 2024-2029 (%)
- Exhibits156: Data Table on US - Year-over-year growth 2024-2029 (%)
- Exhibits157: Chart on Canada - Market size and forecast 2024-2029 ($ million)
- Exhibits158: Data Table on Canada - Market size and forecast 2024-2029 ($ million)
- Exhibits159: Chart on Canada - Year-over-year growth 2024-2029 (%)
- Exhibits160: Data Table on Canada - Year-over-year growth 2024-2029 (%)
- Exhibits161: Chart on China - Market size and forecast 2024-2029 ($ million)
- Exhibits162: Data Table on China - Market size and forecast 2024-2029 ($ million)
- Exhibits163: Chart on China - Year-over-year growth 2024-2029 (%)
- Exhibits164: Data Table on China - Year-over-year growth 2024-2029 (%)
- Exhibits165: Chart on UK - Market size and forecast 2024-2029 ($ million)
- Exhibits166: Data Table on UK - Market size and forecast 2024-2029 ($ million)
- Exhibits167: Chart on UK - Year-over-year growth 2024-2029 (%)
- Exhibits168: Data Table on UK - Year-over-year growth 2024-2029 (%)
- Exhibits169: Chart on Japan - Market size and forecast 2024-2029 ($ million)
- Exhibits170: Data Table on Japan - Market size and forecast 2024-2029 ($ million)
- Exhibits171: Chart on Japan - Year-over-year growth 2024-2029 (%)
- Exhibits172: Data Table on Japan - Year-over-year growth 2024-2029 (%)
- Exhibits173: Chart on Germany - Market size and forecast 2024-2029 ($ million)
- Exhibits174: Data Table on Germany - Market size and forecast 2024-2029 ($ million)
- Exhibits175: Chart on Germany - Year-over-year growth 2024-2029 (%)
- Exhibits176: Data Table on Germany - Year-over-year growth 2024-2029 (%)
- Exhibits177: Chart on India - Market size and forecast 2024-2029 ($ million)
- Exhibits178: Data Table on India - Market size and forecast 2024-2029 ($ million)
- Exhibits179: Chart on India - Year-over-year growth 2024-2029 (%)
- Exhibits180: Data Table on India - Year-over-year growth 2024-2029 (%)
- Exhibits181: Chart on France - Market size and forecast 2024-2029 ($ million)
- Exhibits182: Data Table on France - Market size and forecast 2024-2029 ($ million)
- Exhibits183: Chart on France - Year-over-year growth 2024-2029 (%)
- Exhibits184: Data Table on France - Year-over-year growth 2024-2029 (%)
- Exhibits185: Chart on Italy - Market size and forecast 2024-2029 ($ million)
- Exhibits186: Data Table on Italy - Market size and forecast 2024-2029 ($ million)
- Exhibits187: Chart on Italy - Year-over-year growth 2024-2029 (%)
- Exhibits188: Data Table on Italy - Year-over-year growth 2024-2029 (%)
- Exhibits189: Chart on South Korea - Market size and forecast 2024-2029 ($ million)
- Exhibits190: Data Table on South Korea - Market size and forecast 2024-2029 ($ million)
- Exhibits191: Chart on South Korea - Year-over-year growth 2024-2029 (%)
- Exhibits192: Data Table on South Korea - Year-over-year growth 2024-2029 (%)
- Exhibits193: Market opportunity By Geographical Landscape ($ million)
- Exhibits194: Data Tables on Market opportunity By Geographical Landscape ($ million)
- Exhibits195: Impact of drivers and challenges in 2024 and 2029
- Exhibits196: Overview on criticality of inputs and factors of differentiation
- Exhibits197: Overview on factors of disruption
- Exhibits198: Impact of key risks on business
- Exhibits199: Companies covered
- Exhibits200: Company ranking index
- Exhibits201: Matrix on companies position and classification
- Exhibits202: Agility Public Warehousing Co. K.S.C.P - Overview
- Exhibits203: Agility Public Warehousing Co. K.S.C.P - Business segments
- Exhibits204: Agility Public Warehousing Co. K.S.C.P - Key offerings
- Exhibits205: Agility Public Warehousing Co. K.S.C.P - Segment focus
- Exhibits206: SWOT
- Exhibits207: Air Charter Service Group Ltd. - Overview
- Exhibits208: Air Charter Service Group Ltd. - Business segments
- Exhibits209: Air Charter Service Group Ltd. - Key offerings
- Exhibits210: Air Charter Service Group Ltd. - Segment focus
- Exhibits211: SWOT
- Exhibits212: AP Moller Maersk AS - Overview
- Exhibits213: AP Moller Maersk AS - Business segments
- Exhibits214: AP Moller Maersk AS - Key news
- Exhibits215: AP Moller Maersk AS - Key offerings
- Exhibits216: AP Moller Maersk AS - Segment focus
- Exhibits217: SWOT
- Exhibits218: Blue Water Shipping AS - Overview
- Exhibits219: Blue Water Shipping AS - Product / Service
- Exhibits220: Blue Water Shipping AS - Key offerings
- Exhibits221: SWOT
- Exhibits222: CSafe Global - Overview
- Exhibits223: CSafe Global - Product / Service
- Exhibits224: CSafe Global - Key news
- Exhibits225: CSafe Global - Key offerings
- Exhibits226: SWOT
- Exhibits227: Deutsche Post AG - Overview
- Exhibits228: Deutsche Post AG - Business segments
- Exhibits229: Deutsche Post AG - Key news
- Exhibits230: Deutsche Post AG - Key offerings
- Exhibits231: Deutsche Post AG - Segment focus
- Exhibits232: SWOT
- Exhibits233: FreightCenter Inc. - Overview
- Exhibits234: FreightCenter Inc. - Product / Service
- Exhibits235: FreightCenter Inc. - Key offerings
- Exhibits236: SWOT
- Exhibits237: JAS Worldwide Inc. - Overview
- Exhibits238: JAS Worldwide Inc. - Product / Service
- Exhibits239: JAS Worldwide Inc. - Key offerings
- Exhibits240: SWOT
- Exhibits241: Kuehne Nagel Management AG - Overview
- Exhibits242: Kuehne Nagel Management AG - Business segments
- Exhibits243: Kuehne Nagel Management AG - Key news
- Exhibits244: Kuehne Nagel Management AG - Key offerings
- Exhibits245: Kuehne Nagel Management AG - Segment focus
- Exhibits246: SWOT
- Exhibits247: Lynden Inc. - Overview
- Exhibits248: Lynden Inc. - Product / Service
- Exhibits249: Lynden Inc. - Key offerings
- Exhibits250: SWOT
- Exhibits251: Next Exit Logistics - Overview
- Exhibits252: Next Exit Logistics - Product / Service
- Exhibits253: Next Exit Logistics - Key offerings
- Exhibits254: SWOT
- Exhibits255: ODW Logistics - Overview
- Exhibits256: ODW Logistics - Product / Service
- Exhibits257: ODW Logistics - Key offerings
- Exhibits258: SWOT
- Exhibits259: SEKO Logistics - Overview
- Exhibits260: SEKO Logistics - Product / Service
- Exhibits261: SEKO Logistics - Key offerings
- Exhibits262: SWOT
- Exhibits263: Scan Global Logistics - Overview
- Exhibits264: Scan Global Logistics - Product / Service
- Exhibits265: Scan Global Logistics - Key offerings
- Exhibits266: SWOT
- Exhibits267: United Parcel Service Inc. - Overview
- Exhibits268: United Parcel Service Inc. - Business segments
- Exhibits269: United Parcel Service Inc. - Key news
- Exhibits270: United Parcel Service Inc. - Key offerings
- Exhibits271: United Parcel Service Inc. - Segment focus
- Exhibits272: SWOT
- Exhibits273: Inclusions checklist
- Exhibits274: Exclusions checklist
- Exhibits275: Currency conversion rates for US$
- Exhibits276: Research methodology
- Exhibits277: Information sources
- Exhibits278: Data validation
- Exhibits279: Validation techniques employed for market sizing
- Exhibits280: Data synthesis
- Exhibits281: 360 degree market analysis
- Exhibits282: List of abbreviations
The disaster relief logistics market is forecasted to grow by USD 7579.3 million during 2024-2029, accelerating at a CAGR of 5.2% during the forecast period. The report on the disaster relief logistics market provides a holistic analysis, market size and forecast, trends, growth drivers, and challenges, as well as vendor analysis covering around 25 vendors.
The report offers an up-to-date analysis regarding the current market scenario, the latest trends and drivers, and the overall market environment. The market is driven by rising demand for skilled logistics businesses to handle logistical operations, increasing occurrences of natural disasters around world, and ngos and governments partner with logistics businesses to reduce logistical risks.
| Market Scope | |
|---|---|
| Base Year | 2025 |
| End Year | 2029 |
| Series Year | 2025-2029 |
| Growth Momentum | Accelerate |
| YOY 2025 | 4.8% |
| CAGR | 5.2% |
| Incremental Value | $7579.3 mn |
The study was conducted using an objective combination of primary and secondary information including inputs from key participants in the industry. The report contains a comprehensive market size data, segment with regional analysis and vendor landscape in addition to an analysis of the key companies. Reports have historic and forecast data.
Technavio's disaster relief logistics market is segmented as below:
By Service
- Relief and aid transportation
- Relief and aid logistics
By Material
- Food
- Medical
By Type
- Land
- Air
- Sea
By Service Type
- First-party logistics
- Third-party logistics
- Fourth-party logistics
By End-user
- Government agencies
- Non-governmental organizations
- Corporate entities
- Individuals
By Geographical Landscape
- North America
- Europe
- APAC
- South America
- Middle East and Africa
This study identifies the popularity of drones for disaster relief logistics as one of the prime reasons driving the disaster relief logistics market growth during the next few years. Also, increased access to 3d printing helps in reducing logistics lead times and global logistics companies reducing communication channels with multiple stakeholders will lead to sizable demand in the market.
The report on the disaster relief logistics market covers the following areas:
- Disaster Relief Logistics Market sizing
- Disaster Relief Logistics Market forecast
- Disaster Relief Logistics Market industry analysis
The robust vendor analysis is designed to help clients improve their market position, and in line with this, this report provides a detailed analysis of several leading disaster relief logistics market vendors that include Agility Public Warehousing Co. K.S.C.P, Air Charter Service Group Ltd., AP Moller Maersk AS, Blue Water Shipping AS, CSafe Global, Deutsche Post AG, FedEx Corp., FreightCenter Inc., JAS Worldwide Inc., Kuehne Nagel Management AG, Lynden Inc., Next Exit Logistics, Nippon Express Holdings Inc., ODW Logistics, SEKO Logistics, SF Express Co. Ltd., Scan Global Logistics, United Parcel Service Inc., and XPO Inc.. Also, the disaster relief logistics market analysis report includes information on upcoming trends and challenges that will influence market growth. This is to help companies strategize and leverage all forthcoming growth opportunities.
The publisher presents a detailed picture of the market by the way of study, synthesis, and summation of data from multiple sources by an analysis of key parameters such as profit, pricing, competition, and promotions. It presents various market facets by identifying the key industry influencers. The data presented is comprehensive, reliable, and a result of extensive primary and secondary research. The market research reports provide a complete competitive landscape and an in-depth vendor selection methodology and analysis using qualitative and quantitative research to forecast accurate market growth.
Table of Contents
1 Executive Summary
- 1.1 Market overview
- Executive Summary - Chart on Market Overview
- Executive Summary - Data Table on Market Overview
- Executive Summary - Chart on Global Market Characteristics
- Executive Summary - Chart on Market By Geographical Landscape
- Executive Summary - Chart on Market Segmentation by Service
- Executive Summary - Chart on Market Segmentation by Material
- Executive Summary - Chart on Market Segmentation by Type
- Executive Summary - Chart on Market Segmentation by Service Type
- Executive Summary - Chart on Market Segmentation by End-user
- Executive Summary - Chart on Incremental Growth
- Executive Summary - Data Table on Incremental Growth
- Executive Summary - Chart on Company Market Positioning
2 Technavio Analysis
- 2.1 Analysis of price sensitivity, lifecycle, customer purchase basket, adoption rates, and purchase criteria
- Analysis of price sensitivity, lifecycle, customer purchase basket, adoption rates, and purchase criteria
- 2.2 Criticality of inputs and Factors of differentiation
- Overview on criticality of inputs and factors of differentiation
- 2.3 Factors of disruption
- Overview on factors of disruption
- 2.4 Impact of drivers and challenges
- Impact of drivers and challenges in 2024 and 2029
3 Market Landscape
- 3.1 Market ecosystem
- Parent Market
- Data Table on - Parent Market
- 3.2 Market characteristics
- Market characteristics analysis
- 3.3 Value chain analysis
- Value chain analysis
4 Market Sizing
- 4.1 Market definition
- Offerings of companies included in the market definition
- 4.2 Market segment analysis
- Market segments
- 4.3 Market size 2024
- 4.4 Market outlook: Forecast for 2024-2029
- Chart on Global - Market size and forecast 2024-2029 ($ million)
- Data Table on Global - Market size and forecast 2024-2029 ($ million)
- Chart on Global Market: Year-over-year growth 2024-2029 (%)
- Data Table on Global Market: Year-over-year growth 2024-2029 (%)
5 Historic Market Size
- 5.1 Global Disaster Relief Logistics Market 2019 - 2023
- Historic Market Size - Data Table on Global Disaster Relief Logistics Market 2019 - 2023 ($ million)
- 5.2 Service segment analysis 2019 - 2023
- Historic Market Size - Service Segment 2019 - 2023 ($ million)
- 5.3 Material segment analysis 2019 - 2023
- Historic Market Size - Material Segment 2019 - 2023 ($ million)
- 5.4 Type segment analysis 2019 - 2023
- Historic Market Size - Type Segment 2019 - 2023 ($ million)
- 5.5 Service Type segment analysis 2019 - 2023
- Historic Market Size - Service Type Segment 2019 - 2023 ($ million)
- 5.6 End-user segment analysis 2019 - 2023
- Historic Market Size - End-user Segment 2019 - 2023 ($ million)
- 5.7 Geography segment analysis 2019 - 2023
- Historic Market Size - Geography Segment 2019 - 2023 ($ million)
- 5.8 Country segment analysis 2019 - 2023
- Historic Market Size - Country Segment 2019 - 2023 ($ million)
6 Qualitative Analysis
- 6.1 AI Impact on Global Disaster Relief Logistics Market
7 Five Forces Analysis
- 7.1 Five forces summary
- Five forces analysis - Comparison between 2024 and 2029
- 7.2 Bargaining power of buyers
- Bargaining power of buyers - Impact of key factors 2024 and 2029
- 7.3 Bargaining power of suppliers
- Bargaining power of suppliers - Impact of key factors in 2024 and 2029
- 7.4 Threat of new entrants
- Threat of new entrants - Impact of key factors in 2024 and 2029
- 7.5 Threat of substitutes
- Threat of substitutes - Impact of key factors in 2024 and 2029
- 7.6 Threat of rivalry
- Threat of rivalry - Impact of key factors in 2024 and 2029
- 7.7 Market condition
- Chart on Market condition - Five forces 2024 and 2029
8 Market Segmentation by Service
- 8.1 Market segments
- Chart on Service - Market share 2024-2029 (%)
- Data Table on Service - Market share 2024-2029 (%)
- 8.2 Comparison by Service
- Chart on Comparison by Service
- Data Table on Comparison by Service
- 8.3 Relief and aid transportation - Market size and forecast 2024-2029
- Chart on Relief and aid transportation - Market size and forecast 2024-2029 ($ million)
- Data Table on Relief and aid transportation - Market size and forecast 2024-2029 ($ million)
- Chart on Relief and aid transportation - Year-over-year growth 2024-2029 (%)
- Data Table on Relief and aid transportation - Year-over-year growth 2024-2029 (%)
- 8.4 Relief and aid logistics - Market size and forecast 2024-2029
- Chart on Relief and aid logistics - Market size and forecast 2024-2029 ($ million)
- Data Table on Relief and aid logistics - Market size and forecast 2024-2029 ($ million)
- Chart on Relief and aid logistics - Year-over-year growth 2024-2029 (%)
- Data Table on Relief and aid logistics - Year-over-year growth 2024-2029 (%)
- 8.5 Market opportunity by Service
- Market opportunity by Service ($ million)
- Data Table on Market opportunity by Service ($ million)
9 Market Segmentation by Material
- 9.1 Market segments
- Chart on Material - Market share 2024-2029 (%)
- Data Table on Material - Market share 2024-2029 (%)
- 9.2 Comparison by Material
- Chart on Comparison by Material
- Data Table on Comparison by Material
- 9.3 Food - Market size and forecast 2024-2029
- Chart on Food - Market size and forecast 2024-2029 ($ million)
- Data Table on Food - Market size and forecast 2024-2029 ($ million)
- Chart on Food - Year-over-year growth 2024-2029 (%)
- Data Table on Food - Year-over-year growth 2024-2029 (%)
- 9.4 Medical - Market size and forecast 2024-2029
- Chart on Medical - Market size and forecast 2024-2029 ($ million)
- Data Table on Medical - Market size and forecast 2024-2029 ($ million)
- Chart on Medical - Year-over-year growth 2024-2029 (%)
- Data Table on Medical - Year-over-year growth 2024-2029 (%)
- 9.5 Market opportunity by Material
- Market opportunity by Material ($ million)
- Data Table on Market opportunity by Material ($ million)
10 Market Segmentation by Type
- 10.1 Market segments
- Chart on Type - Market share 2024-2029 (%)
- Data Table on Type - Market share 2024-2029 (%)
- 10.2 Comparison by Type
- Chart on Comparison by Type
- Data Table on Comparison by Type
- 10.3 Land - Market size and forecast 2024-2029
- Chart on Land - Market size and forecast 2024-2029 ($ million)
- Data Table on Land - Market size and forecast 2024-2029 ($ million)
- Chart on Land - Year-over-year growth 2024-2029 (%)
- Data Table on Land - Year-over-year growth 2024-2029 (%)
- 10.4 Air - Market size and forecast 2024-2029
- Chart on Air - Market size and forecast 2024-2029 ($ million)
- Data Table on Air - Market size and forecast 2024-2029 ($ million)
- Chart on Air - Year-over-year growth 2024-2029 (%)
- Data Table on Air - Year-over-year growth 2024-2029 (%)
- 10.5 Sea - Market size and forecast 2024-2029
- Chart on Sea - Market size and forecast 2024-2029 ($ million)
- Data Table on Sea - Market size and forecast 2024-2029 ($ million)
- Chart on Sea - Year-over-year growth 2024-2029 (%)
- Data Table on Sea - Year-over-year growth 2024-2029 (%)
- 10.6 Market opportunity by Type
- Market opportunity by Type ($ million)
- Data Table on Market opportunity by Type ($ million)
11 Market Segmentation by Service Type
- 11.1 Market segments
- Chart on Service Type - Market share 2024-2029 (%)
- Data Table on Service Type - Market share 2024-2029 (%)
- 11.2 Comparison by Service Type
- Chart on Comparison by Service Type
- Data Table on Comparison by Service Type
- 11.3 First-party logistics - Market size and forecast 2024-2029
- Chart on First-party logistics - Market size and forecast 2024-2029 ($ million)
- Data Table on First-party logistics - Market size and forecast 2024-2029 ($ million)
- Chart on First-party logistics - Year-over-year growth 2024-2029 (%)
- Data Table on First-party logistics - Year-over-year growth 2024-2029 (%)
- 11.4 Third-party logistics - Market size and forecast 2024-2029
- Chart on Third-party logistics - Market size and forecast 2024-2029 ($ million)
- Data Table on Third-party logistics - Market size and forecast 2024-2029 ($ million)
- Chart on Third-party logistics - Year-over-year growth 2024-2029 (%)
- Data Table on Third-party logistics - Year-over-year growth 2024-2029 (%)
- 11.5 Fourth-party logistics - Market size and forecast 2024-2029
- Chart on Fourth-party logistics - Market size and forecast 2024-2029 ($ million)
- Data Table on Fourth-party logistics - Market size and forecast 2024-2029 ($ million)
- Chart on Fourth-party logistics - Year-over-year growth 2024-2029 (%)
- Data Table on Fourth-party logistics - Year-over-year growth 2024-2029 (%)
- 11.6 Market opportunity by Service Type
- Market opportunity by Service Type ($ million)
- Data Table on Market opportunity by Service Type ($ million)
12 Market Segmentation by End-user
- 12.1 Market segments
- Chart on End-user - Market share 2024-2029 (%)
- Data Table on End-user - Market share 2024-2029 (%)
- 12.2 Comparison by End-user
- Chart on Comparison by End-user
- Data Table on Comparison by End-user
- 12.3 Government agencies - Market size and forecast 2024-2029
- Chart on Government agencies - Market size and forecast 2024-2029 ($ million)
- Data Table on Government agencies - Market size and forecast 2024-2029 ($ million)
- Chart on Government agencies - Year-over-year growth 2024-2029 (%)
- Data Table on Government agencies - Year-over-year growth 2024-2029 (%)
- 12.4 Non-governmental organizations - Market size and forecast 2024-2029
- Chart on Non-governmental organizations - Market size and forecast 2024-2029 ($ million)
- Data Table on Non-governmental organizations - Market size and forecast 2024-2029 ($ million)
- Chart on Non-governmental organizations - Year-over-year growth 2024-2029 (%)
- Data Table on Non-governmental organizations - Year-over-year growth 2024-2029 (%)
- 12.5 Corporate entities - Market size and forecast 2024-2029
- Chart on Corporate entities - Market size and forecast 2024-2029 ($ million)
- Data Table on Corporate entities - Market size and forecast 2024-2029 ($ million)
- Chart on Corporate entities - Year-over-year growth 2024-2029 (%)
- Data Table on Corporate entities - Year-over-year growth 2024-2029 (%)
- 12.6 Individuals - Market size and forecast 2024-2029
- Chart on Individuals - Market size and forecast 2024-2029 ($ million)
- Data Table on Individuals - Market size and forecast 2024-2029 ($ million)
- Chart on Individuals - Year-over-year growth 2024-2029 (%)
- Data Table on Individuals - Year-over-year growth 2024-2029 (%)
- 12.7 Market opportunity by End-user
- Market opportunity by End-user ($ million)
- Data Table on Market opportunity by End-user ($ million)
13 Customer Landscape
- 13.1 Customer landscape overview
- Analysis of price sensitivity, lifecycle, customer purchase basket, adoption rates, and purchase criteria
14 Geographic Landscape
- 14.1 Geographic segmentation
- Chart on Market share By Geographical Landscape 2024-2029 (%)
- Data Table on Market share By Geographical Landscape 2024-2029 (%)
- 14.2 Geographic comparison
- Chart on Geographic comparison
- Data Table on Geographic comparison
- 14.3 North America - Market size and forecast 2024-2029
- Chart on North America - Market size and forecast 2024-2029 ($ million)
- Data Table on North America - Market size and forecast 2024-2029 ($ million)
- Chart on North America - Year-over-year growth 2024-2029 (%)
- Data Table on North America - Year-over-year growth 2024-2029 (%)
- 14.4 Europe - Market size and forecast 2024-2029
- Chart on Europe - Market size and forecast 2024-2029 ($ million)
- Data Table on Europe - Market size and forecast 2024-2029 ($ million)
- Chart on Europe - Year-over-year growth 2024-2029 (%)
- Data Table on Europe - Year-over-year growth 2024-2029 (%)
- 14.5 APAC - Market size and forecast 2024-2029
- Chart on APAC - Market size and forecast 2024-2029 ($ million)
- Data Table on APAC - Market size and forecast 2024-2029 ($ million)
- Chart on APAC - Year-over-year growth 2024-2029 (%)
- Data Table on APAC - Year-over-year growth 2024-2029 (%)
- 14.6 South America - Market size and forecast 2024-2029
- Chart on South America - Market size and forecast 2024-2029 ($ million)
- Data Table on South America - Market size and forecast 2024-2029 ($ million)
- Chart on South America - Year-over-year growth 2024-2029 (%)
- Data Table on South America - Year-over-year growth 2024-2029 (%)
- 14.7 Middle East and Africa - Market size and forecast 2024-2029
- Chart on Middle East and Africa - Market size and forecast 2024-2029 ($ million)
- Data Table on Middle East and Africa - Market size and forecast 2024-2029 ($ million)
- Chart on Middle East and Africa - Year-over-year growth 2024-2029 (%)
- Data Table on Middle East and Africa - Year-over-year growth 2024-2029 (%)
- 14.8 US - Market size and forecast 2024-2029
- Chart on US - Market size and forecast 2024-2029 ($ million)
- Data Table on US - Market size and forecast 2024-2029 ($ million)
- Chart on US - Year-over-year growth 2024-2029 (%)
- Data Table on US - Year-over-year growth 2024-2029 (%)
- 14.9 Canada - Market size and forecast 2024-2029
- Chart on Canada - Market size and forecast 2024-2029 ($ million)
- Data Table on Canada - Market size and forecast 2024-2029 ($ million)
- Chart on Canada - Year-over-year growth 2024-2029 (%)
- Data Table on Canada - Year-over-year growth 2024-2029 (%)
- 14.10 China - Market size and forecast 2024-2029
- Chart on China - Market size and forecast 2024-2029 ($ million)
- Data Table on China - Market size and forecast 2024-2029 ($ million)
- Chart on China - Year-over-year growth 2024-2029 (%)
- Data Table on China - Year-over-year growth 2024-2029 (%)
- 14.11 UK - Market size and forecast 2024-2029
- Chart on UK - Market size and forecast 2024-2029 ($ million)
- Data Table on UK - Market size and forecast 2024-2029 ($ million)
- Chart on UK - Year-over-year growth 2024-2029 (%)
- Data Table on UK - Year-over-year growth 2024-2029 (%)
- 14.12 Japan - Market size and forecast 2024-2029
- Chart on Japan - Market size and forecast 2024-2029 ($ million)
- Data Table on Japan - Market size and forecast 2024-2029 ($ million)
- Chart on Japan - Year-over-year growth 2024-2029 (%)
- Data Table on Japan - Year-over-year growth 2024-2029 (%)
- 14.13 Germany - Market size and forecast 2024-2029
- Chart on Germany - Market size and forecast 2024-2029 ($ million)
- Data Table on Germany - Market size and forecast 2024-2029 ($ million)
- Chart on Germany - Year-over-year growth 2024-2029 (%)
- Data Table on Germany - Year-over-year growth 2024-2029 (%)
- 14.14 India - Market size and forecast 2024-2029
- Chart on India - Market size and forecast 2024-2029 ($ million)
- Data Table on India - Market size and forecast 2024-2029 ($ million)
- Chart on India - Year-over-year growth 2024-2029 (%)
- Data Table on India - Year-over-year growth 2024-2029 (%)
- 14.15 France - Market size and forecast 2024-2029
- Chart on France - Market size and forecast 2024-2029 ($ million)
- Data Table on France - Market size and forecast 2024-2029 ($ million)
- Chart on France - Year-over-year growth 2024-2029 (%)
- Data Table on France - Year-over-year growth 2024-2029 (%)
- 14.16 Italy - Market size and forecast 2024-2029
- Chart on Italy - Market size and forecast 2024-2029 ($ million)
- Data Table on Italy - Market size and forecast 2024-2029 ($ million)
- Chart on Italy - Year-over-year growth 2024-2029 (%)
- Data Table on Italy - Year-over-year growth 2024-2029 (%)
- 14.17 South Korea - Market size and forecast 2024-2029
- Chart on South Korea - Market size and forecast 2024-2029 ($ million)
- Data Table on South Korea - Market size and forecast 2024-2029 ($ million)
- Chart on South Korea - Year-over-year growth 2024-2029 (%)
- Data Table on South Korea - Year-over-year growth 2024-2029 (%)
- 14.18 Market opportunity By Geographical Landscape
- Market opportunity By Geographical Landscape ($ million)
- Data Tables on Market opportunity By Geographical Landscape ($ million)
15 Drivers, Challenges, and Opportunity/Restraints
- 15.1 Market drivers
- 15.2 Market challenges
- 15.3 Impact of drivers and challenges
- Impact of drivers and challenges in 2024 and 2029
- 15.4 Market opportunities/restraints
16 Competitive Landscape
- 16.1 Overview
- 16.2 Competitive Landscape
- Overview on criticality of inputs and factors of differentiation
- 16.3 Landscape disruption
- Overview on factors of disruption
- 16.4 Industry risks
- Impact of key risks on business
17 Competitive Analysis
- 17.1 Companies profiled
- Companies covered
- 17.2 Company ranking index
- Company ranking index
- 17.3 Market positioning of companies
- Matrix on companies position and classification
- 17.4 Agility Public Warehousing Co. K.S.C.P
- Agility Public Warehousing Co. K.S.C.P - Overview
- Agility Public Warehousing Co. K.S.C.P - Business segments
- Agility Public Warehousing Co. K.S.C.P - Key offerings
- Agility Public Warehousing Co. K.S.C.P - Segment focus
- SWOT
- 17.5 Air Charter Service Group Ltd.
- Air Charter Service Group Ltd. - Overview
- Air Charter Service Group Ltd. - Business segments
- Air Charter Service Group Ltd. - Key offerings
- Air Charter Service Group Ltd. - Segment focus
- SWOT
- 17.6 AP Moller Maersk AS
- AP Moller Maersk AS - Overview
- AP Moller Maersk AS - Business segments
- AP Moller Maersk AS - Key news
- AP Moller Maersk AS - Key offerings
- AP Moller Maersk AS - Segment focus
- SWOT
- 17.7 Blue Water Shipping AS
- Blue Water Shipping AS - Overview
- Blue Water Shipping AS - Product / Service
- Blue Water Shipping AS - Key offerings
- SWOT
- 17.8 CSafe Global
- CSafe Global - Overview
- CSafe Global - Product / Service
- CSafe Global - Key news
- CSafe Global - Key offerings
- SWOT
- 17.9 Deutsche Post AG
- Deutsche Post AG - Overview
- Deutsche Post AG - Business segments
- Deutsche Post AG - Key news
- Deutsche Post AG - Key offerings
- Deutsche Post AG - Segment focus
- SWOT
- 17.10 FreightCenter Inc.
- FreightCenter Inc. - Overview
- FreightCenter Inc. - Product / Service
- FreightCenter Inc. - Key offerings
- SWOT
- 17.11 JAS Worldwide Inc.
- JAS Worldwide Inc. - Overview
- JAS Worldwide Inc. - Product / Service
- JAS Worldwide Inc. - Key offerings
- SWOT
- 17.12 Kuehne Nagel Management AG
- Kuehne Nagel Management AG - Overview
- Kuehne Nagel Management AG - Business segments
- Kuehne Nagel Management AG - Key news
- Kuehne Nagel Management AG - Key offerings
- Kuehne Nagel Management AG - Segment focus
- SWOT
- 17.13 Lynden Inc.
- Lynden Inc. - Overview
- Lynden Inc. - Product / Service
- Lynden Inc. - Key offerings
- SWOT
- 17.14 Next Exit Logistics
- Next Exit Logistics - Overview
- Next Exit Logistics - Product / Service
- Next Exit Logistics - Key offerings
- SWOT
- 17.15 ODW Logistics
- ODW Logistics - Overview
- ODW Logistics - Product / Service
- ODW Logistics - Key offerings
- SWOT
- 17.16 SEKO Logistics
- SEKO Logistics - Overview
- SEKO Logistics - Product / Service
- SEKO Logistics - Key offerings
- SWOT
- 17.17 Scan Global Logistics
- Scan Global Logistics - Overview
- Scan Global Logistics - Product / Service
- Scan Global Logistics - Key offerings
- SWOT
- 17.18 United Parcel Service Inc.
- United Parcel Service Inc. - Overview
- United Parcel Service Inc. - Business segments
- United Parcel Service Inc. - Key news
- United Parcel Service Inc. - Key offerings
- United Parcel Service Inc. - Segment focus
- SWOT
18 Appendix
- 18.1 Scope of the report
- 18.2 Inclusions and exclusions checklist
- Inclusions checklist
- Exclusions checklist
- 18.3 Currency conversion rates for US$
- Currency conversion rates for US$
- 18.4 Research methodology
- Research methodology
- 18.5 Data procurement
- Information sources
- 18.6 Data validation
- Data validation
- 18.7 Validation techniques employed for market sizing
- Validation techniques employed for market sizing
- 18.8 Data synthesis
- Data synthesis
- 18.9 360 degree market analysis
- 360 degree market analysis
- 18.10 List of abbreviations
- List of abbreviations

