|
|
市場調査レポート
商品コード
1652965
地中熱ヒートポンプの世界市場 2025~2029年Global Geothermal Heat Pump Market 2025-2029 |
||||||

|
|||||||
カスタマイズ可能
|
|||||||


| 地中熱ヒートポンプの世界市場 2025~2029年 |
|
出版日: 2025年02月05日
発行: TechNavio
ページ情報: 英文 215 Pages
納期: 即納可能
|

全表示
- 概要
- 目次
地中熱ヒートポンプ市場は、2024~2029年にかけて64億8,350万米ドル、予測期間中のCAGRは8.9%で成長すると予測されています。
当レポートでは、地中熱ヒートポンプ市場の全体的な分析、市場規模・予測、動向、成長促進要因、課題、約25のベンダーを網羅したベンダー分析などを掲載しています。
現在の市場シナリオ、最新動向と促進要因、市場環境全体に関する最新分析を提供しています。地中熱ヒートポンプの従来型システムに対する運用上のメリット、住宅部門の回復に伴う世界のエネルギー消費の増加、再生可能エネルギーへの需要の高まりなどが市場を牽引しています。
| 市場範囲 | |
|---|---|
| 基準年 | 2025年 |
| 終了年 | 2029年 |
| 予測期間 | 2025~2029年 |
| 成長モメンタム | 加速 |
| 前年比[2025年] | 8% |
| CAGR | 8.9% |
| 増分額 | 64億8,350万米ドル |
本調査は、産業の主要参加者からのインプットを含め、一次情報と二次情報を客観的に組み合わせて実施しました。レポートには、主要企業の分析に加え、包括的な市場規模データ、地域分析によるセグメント、ベンダー情勢が含まれています。レポートには過去データと予測データがあります。
本調査では、BEMSの出現が今後数年間の地中熱ヒートポンプ市場成長を牽引する主要因の1つであると特定しています。また、熱回収のためのデスーパーヒーターや新製品の発売は、市場の大きな需要につながります。
目次
第1章 エグゼクティブサマリー
- 市場概要
第2章 Technavio分析
- 価格・ライフサイクル・顧客購入バスケット・採用率・購入基準の分析
- インプットの重要性と差別化の要因
- 混乱の要因
- 促進要因と課題の影響
第3章 市場情勢
- 市場エコシステム
- 市場の特徴
- バリューチェーン分析
第4章 市場規模
- 市場の定義
- 市場セグメント分析
- 市場規模 2024年
- 市場の展望 2024~2029年
第5章 市場規模実績
- 地中熱ヒートポンプの世界市場 2019~2023年
- エンドユーザー別セグメント分析 2019~2023年
- タイプ別セグメント分析 2019~2023年
- 用途別セグメント分析 2019~2023年
- 地域別セグメント分析 2019~2023年
- 国別セグメント分析 2019~2023年
第6章 定性分析
- AIの影響:地中熱ヒートポンプの世界市場
第7章 ファイブフォース分析
- ファイブフォースの要約
- 買い手の交渉力
- 供給企業の交渉力
- 新規参入業者の脅威
- 代替品の脅威
- 競争の脅威
- 市況
第8章 市場セグメンテーション:エンドユーザー別
- 市場セグメント
- 比較:エンドユーザー別
- 住宅:市場規模と予測 2024~2029年
- 非住宅:市場規模と予測 2024~2029年
- 市場機会:エンドユーザー別
第9章 市場セグメンテーション:タイプ別
- 市場セグメント
- 比較:タイプ別
- 閉ループシステム:市場規模と予測 2024~2029年
- 開ループシステム:市場規模と予測 2024~2029年
- 市場機会:タイプ別
第10章 市場セグメンテーション:用途別
- 市場セグメント
- 比較:用途別
- 水平ループ:市場規模と予測 2024~2029年
- 垂直ループ:市場規模と予測 2024~2029年
- ポンドループ:市場規模と予測 2024~2029年
- 市場機会:用途別
第11章 顧客情勢
- 顧客情勢概要
第12章 地域別情勢
- 地域別セグメンテーション
- 比較:地域別
- 欧州:市場規模と予測 2024~2029年
- 北米:市場規模と予測 2024~2029年
- アジア太平洋:市場規模と予測 2024~2029年
- 南米:市場規模と予測 2024~2029年
- 中東・アフリカ:市場規模と予測 2024~2029年
- 米国:市場規模と予測 2024~2029年
- ドイツ:市場規模と予測 2024~2029年
- 英国:市場規模と予測 2024~2029年
- カナダ:市場規模と予測 2024~2029年
- フランス:市場規模と予測 2024~2029年
- イタリア:市場規模と予測 2024~2029年
- 中国:市場規模と予測 2024~2029年
- 日本:市場規模と予測 2024~2029年
- インド:市場規模と予測 2024~2029年
- 韓国:市場規模と予測 2024~2029年
- 地域情勢による市場機会
第13章 促進要因・課題・機会・抑制要因
- 市場促進要因
- 市場課題
- 促進要因と課題の影響
- 市場機会・抑制要因
第14章 競合情勢
- 概要
- 競合情勢
- 混乱の状況
- 産業のリスク
第15章 競合分析
- 企業プロファイル
- 企業ランキング指数
- 企業の市場ポジショニング
- Bard HVAC
- Carrier Global Corp.
- Daikin Industries Ltd.
- Danfoss AS
- Energy Smart Alternatives.
- Glen Dimplex Group.
- Johnson Controls International Plc
- Mitsubishi Corp.
- NIBE Industrier AB
- Robert Bosch GmbH
- Sirac Air Conditioning Equipments Co. Ltd.
- Stiebel Eltron GmbH and Co. KG
- Trane Technologies Plc
- Vaillant Group
- Viessmann Climate Solutions SE
第16章 付録
The geothermal heat pump market is forecasted to grow by USD 6483.5 million during 2024-2029, accelerating at a CAGR of 8.9% during the forecast period. The report on the geothermal heat pump market provides a holistic analysis, market size and forecast, trends, growth drivers, and challenges, as well as vendor analysis covering around 25 vendors.
The report offers an up-to-date analysis regarding the current market scenario, the latest trends and drivers, and the overall market environment. The market is driven by operational benefits of geothermal heat pumps over conventional systems, rising global energy consumption coupled with recovery in housing sector, and increasing demand for renewable energy sources.
| Market Scope | |
|---|---|
| Base Year | 2025 |
| End Year | 2029 |
| Series Year | 2025-2029 |
| Growth Momentum | Accelerate |
| YOY 2025 | 8% |
| CAGR | 8.9% |
| Incremental Value | $6483.5 mn |
The study was conducted using an objective combination of primary and secondary information including inputs from key participants in the industry. The report contains a comprehensive market size data, segment with regional analysis and vendor landscape in addition to an analysis of the key companies. Reports have historic and forecast data.
Technavio's geothermal heat pump market is segmented as below:
By End-user
- Residential
- Non-residential
By Type
- Closed loop system
- Open loop system
By Application
- Horizontal loop
- Vertical loop
- Pond loop
By Geographical Landscape
- Europe
- North America
- APAC
- South America
- Middle East and Africa
This study identifies the emergence of BEMS as one of the prime reasons driving the geothermal heat pump market growth during the next few years. Also, desuperheaters for heat recovery and launch of new products will lead to sizable demand in the market.
The report on the geothermal heat pump market covers the following areas:
- Geothermal Heat Pump Market sizing
- Geothermal Heat Pump Market forecast
- Geothermal Heat Pump Market industry analysis
The robust vendor analysis is designed to help clients improve their market position, and in line with this, this report provides a detailed analysis of several leading geothermal heat pump market vendors that include Bard HVAC, Carrier Global Corp., Daikin Industries Ltd., Dandelion Energy, Danfoss AS, Energy Smart Alternatives., GeoSmart Energy, Glen Dimplex Group., Griffiths Air Conditioning and Electrical Contractors, Johnson Controls International PLC, Kensa Group, Mitsubishi Corp., NIBE Industrier AB, REMKO GmbH and Co. KG, Robert Bosch GmbH, Sirac Air Conditioning Equipments Co. Ltd., Stiebel Eltron GmbH and Co. KG, Trane Technologies PLC, Vaillant Group, and Viessmann Climate Solutions SE. Also, the geothermal heat pump market analysis report includes information on upcoming trends and challenges that will influence market growth. This is to help companies strategize and leverage all forthcoming growth opportunities.
The publisher presents a detailed picture of the market by the way of study, synthesis, and summation of data from multiple sources by an analysis of key parameters such as profit, pricing, competition, and promotions. It presents various market facets by identifying the key industry influencers. The data presented is comprehensive, reliable, and a result of extensive primary and secondary research. The market research reports provide a complete competitive landscape and an in-depth vendor selection methodology and analysis using qualitative and quantitative research to forecast accurate market growth.
Table of Contents
1 Executive Summary
- 1.1 Market overview
- Executive Summary - Chart on Market Overview
- Executive Summary - Data Table on Market Overview
- Executive Summary - Chart on Global Market Characteristics
- Executive Summary - Chart on Market By Geographical Landscape
- Executive Summary - Chart on Market Segmentation by End-user
- Executive Summary - Chart on Market Segmentation by Type
- Executive Summary - Chart on Market Segmentation by Application
- Executive Summary - Chart on Incremental Growth
- Executive Summary - Data Table on Incremental Growth
- Executive Summary - Chart on Company Market Positioning
2 Technavio Analysis
- 2.1 Analysis of price sensitivity, lifecycle, customer purchase basket, adoption rates, and purchase criteria
- Analysis of price sensitivity, lifecycle, customer purchase basket, adoption rates, and purchase criteria
- 2.2 Criticality of inputs and Factors of differentiation
- Overview on criticality of inputs and factors of differentiation
- 2.3 Factors of disruption
- Overview on factors of disruption
- 2.4 Impact of drivers and challenges
- Impact of drivers and challenges in 2024 and 2029
3 Market Landscape
- 3.1 Market ecosystem
- Parent Market
- Data Table on - Parent Market
- 3.2 Market characteristics
- Market characteristics analysis
- 3.3 Value chain analysis
- Value chain analysis
4 Market Sizing
- 4.1 Market definition
- Offerings of companies included in the market definition
- 4.2 Market segment analysis
- Market segments
- 4.3 Market size 2024
- 4.4 Market outlook: Forecast for 2024-2029
- Chart on Global - Market size and forecast 2024-2029 ($ million)
- Data Table on Global - Market size and forecast 2024-2029 ($ million)
- Chart on Global Market: Year-over-year growth 2024-2029 (%)
- Data Table on Global Market: Year-over-year growth 2024-2029 (%)
5 Historic Market Size
- 5.1 Global Geothermal Heat Pump Market 2019 - 2023
- Historic Market Size - Data Table on Global Geothermal Heat Pump Market 2019 - 2023 ($ million)
- 5.2 End-user segment analysis 2019 - 2023
- Historic Market Size - End-user Segment 2019 - 2023 ($ million)
- 5.3 Type segment analysis 2019 - 2023
- Historic Market Size - Type Segment 2019 - 2023 ($ million)
- 5.4 Application segment analysis 2019 - 2023
- Historic Market Size - Application Segment 2019 - 2023 ($ million)
- 5.5 Geography segment analysis 2019 - 2023
- Historic Market Size - Geography Segment 2019 - 2023 ($ million)
- 5.6 Country segment analysis 2019 - 2023
- Historic Market Size - Country Segment 2019 - 2023 ($ million)
6 Qualitative Analysis
- 6.1 Impact of AI on the global geothermal heat pump market
7 Five Forces Analysis
- 7.1 Five forces summary
- Five forces analysis - Comparison between 2024 and 2029
- 7.2 Bargaining power of buyers
- Bargaining power of buyers - Impact of key factors 2024 and 2029
- 7.3 Bargaining power of suppliers
- Bargaining power of suppliers - Impact of key factors in 2024 and 2029
- 7.4 Threat of new entrants
- Threat of new entrants - Impact of key factors in 2024 and 2029
- 7.5 Threat of substitutes
- Threat of substitutes - Impact of key factors in 2024 and 2029
- 7.6 Threat of rivalry
- Threat of rivalry - Impact of key factors in 2024 and 2029
- 7.7 Market condition
- Chart on Market condition - Five forces 2024 and 2029
8 Market Segmentation by End-user
- 8.1 Market segments
- Chart on End-user - Market share 2024-2029 (%)
- Data Table on End-user - Market share 2024-2029 (%)
- 8.2 Comparison by End-user
- Chart on Comparison by End-user
- Data Table on Comparison by End-user
- 8.3 Residential - Market size and forecast 2024-2029
- Chart on Residential - Market size and forecast 2024-2029 ($ million)
- Data Table on Residential - Market size and forecast 2024-2029 ($ million)
- Chart on Residential - Year-over-year growth 2024-2029 (%)
- Data Table on Residential - Year-over-year growth 2024-2029 (%)
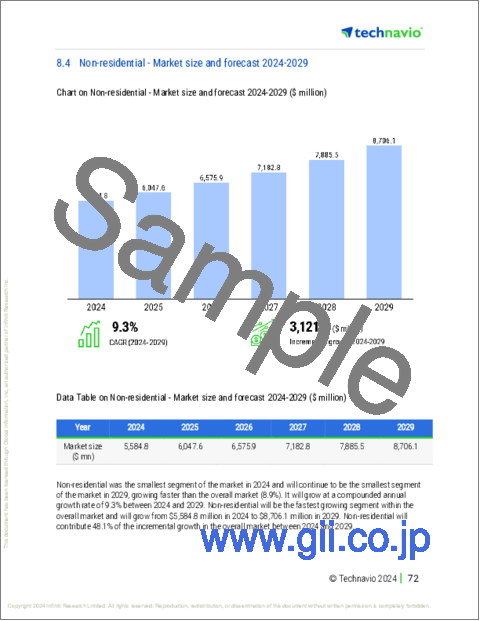
- 8.4 Non-residential - Market size and forecast 2024-2029
- Chart on Non-residential - Market size and forecast 2024-2029 ($ million)
- Data Table on Non-residential - Market size and forecast 2024-2029 ($ million)
- Chart on Non-residential - Year-over-year growth 2024-2029 (%)
- Data Table on Non-residential - Year-over-year growth 2024-2029 (%)
- 8.5 Market opportunity by End-user
- Market opportunity by End-user ($ million)
- Data Table on Market opportunity by End-user ($ million)
9 Market Segmentation by Type
- 9.1 Market segments
- Chart on Type - Market share 2024-2029 (%)
- Data Table on Type - Market share 2024-2029 (%)
- 9.2 Comparison by Type
- Chart on Comparison by Type
- Data Table on Comparison by Type
- 9.3 Closed loop system - Market size and forecast 2024-2029
- Chart on Closed loop system - Market size and forecast 2024-2029 ($ million)
- Data Table on Closed loop system - Market size and forecast 2024-2029 ($ million)
- Chart on Closed loop system - Year-over-year growth 2024-2029 (%)
- Data Table on Closed loop system - Year-over-year growth 2024-2029 (%)
- 9.4 Open loop system - Market size and forecast 2024-2029
- Chart on Open loop system - Market size and forecast 2024-2029 ($ million)
- Data Table on Open loop system - Market size and forecast 2024-2029 ($ million)
- Chart on Open loop system - Year-over-year growth 2024-2029 (%)
- Data Table on Open loop system - Year-over-year growth 2024-2029 (%)
- 9.5 Market opportunity by Type
- Market opportunity by Type ($ million)
- Data Table on Market opportunity by Type ($ million)
10 Market Segmentation by Application
- 10.1 Market segments
- Chart on Application - Market share 2024-2029 (%)
- Data Table on Application - Market share 2024-2029 (%)
- 10.2 Comparison by Application
- Chart on Comparison by Application
- Data Table on Comparison by Application
- 10.3 Horizontal loop - Market size and forecast 2024-2029
- Chart on Horizontal loop - Market size and forecast 2024-2029 ($ million)
- Data Table on Horizontal loop - Market size and forecast 2024-2029 ($ million)
- Chart on Horizontal loop - Year-over-year growth 2024-2029 (%)
- Data Table on Horizontal loop - Year-over-year growth 2024-2029 (%)
- 10.4 Vertical loop - Market size and forecast 2024-2029
- Chart on Vertical loop - Market size and forecast 2024-2029 ($ million)
- Data Table on Vertical loop - Market size and forecast 2024-2029 ($ million)
- Chart on Vertical loop - Year-over-year growth 2024-2029 (%)
- Data Table on Vertical loop - Year-over-year growth 2024-2029 (%)
- 10.5 Pond loop - Market size and forecast 2024-2029
- Chart on Pond loop - Market size and forecast 2024-2029 ($ million)
- Data Table on Pond loop - Market size and forecast 2024-2029 ($ million)
- Chart on Pond loop - Year-over-year growth 2024-2029 (%)
- Data Table on Pond loop - Year-over-year growth 2024-2029 (%)
- 10.6 Market opportunity by Application
- Market opportunity by Application ($ million)
- Data Table on Market opportunity by Application ($ million)
11 Customer Landscape
- 11.1 Customer landscape overview
- Analysis of price sensitivity, lifecycle, customer purchase basket, adoption rates, and purchase criteria
12 Geographic Landscape
- 12.1 Geographic segmentation
- Chart on Market share By Geographical Landscape 2024-2029 (%)
- Data Table on Market share By Geographical Landscape 2024-2029 (%)
- 12.2 Geographic comparison
- Chart on Geographic comparison
- Data Table on Geographic comparison
- 12.3 Europe - Market size and forecast 2024-2029
- Chart on Europe - Market size and forecast 2024-2029 ($ million)
- Data Table on Europe - Market size and forecast 2024-2029 ($ million)
- Chart on Europe - Year-over-year growth 2024-2029 (%)
- Data Table on Europe - Year-over-year growth 2024-2029 (%)
- 12.4 North America - Market size and forecast 2024-2029
- Chart on North America - Market size and forecast 2024-2029 ($ million)
- Data Table on North America - Market size and forecast 2024-2029 ($ million)
- Chart on North America - Year-over-year growth 2024-2029 (%)
- Data Table on North America - Year-over-year growth 2024-2029 (%)
- 12.5 APAC - Market size and forecast 2024-2029
- Chart on APAC - Market size and forecast 2024-2029 ($ million)
- Data Table on APAC - Market size and forecast 2024-2029 ($ million)
- Chart on APAC - Year-over-year growth 2024-2029 (%)
- Data Table on APAC - Year-over-year growth 2024-2029 (%)
- 12.6 South America - Market size and forecast 2024-2029
- Chart on South America - Market size and forecast 2024-2029 ($ million)
- Data Table on South America - Market size and forecast 2024-2029 ($ million)
- Chart on South America - Year-over-year growth 2024-2029 (%)
- Data Table on South America - Year-over-year growth 2024-2029 (%)
- 12.7 Middle East and Africa - Market size and forecast 2024-2029
- Chart on Middle East and Africa - Market size and forecast 2024-2029 ($ million)
- Data Table on Middle East and Africa - Market size and forecast 2024-2029 ($ million)
- Chart on Middle East and Africa - Year-over-year growth 2024-2029 (%)
- Data Table on Middle East and Africa - Year-over-year growth 2024-2029 (%)
- 12.8 US - Market size and forecast 2024-2029
- Chart on US - Market size and forecast 2024-2029 ($ million)
- Data Table on US - Market size and forecast 2024-2029 ($ million)
- Chart on US - Year-over-year growth 2024-2029 (%)
- Data Table on US - Year-over-year growth 2024-2029 (%)
- 12.9 Germany - Market size and forecast 2024-2029
- Chart on Germany - Market size and forecast 2024-2029 ($ million)
- Data Table on Germany - Market size and forecast 2024-2029 ($ million)
- Chart on Germany - Year-over-year growth 2024-2029 (%)
- Data Table on Germany - Year-over-year growth 2024-2029 (%)
- 12.10 UK - Market size and forecast 2024-2029
- Chart on UK - Market size and forecast 2024-2029 ($ million)
- Data Table on UK - Market size and forecast 2024-2029 ($ million)
- Chart on UK - Year-over-year growth 2024-2029 (%)
- Data Table on UK - Year-over-year growth 2024-2029 (%)
- 12.11 Canada - Market size and forecast 2024-2029
- Chart on Canada - Market size and forecast 2024-2029 ($ million)
- Data Table on Canada - Market size and forecast 2024-2029 ($ million)
- Chart on Canada - Year-over-year growth 2024-2029 (%)
- Data Table on Canada - Year-over-year growth 2024-2029 (%)
- 12.12 France - Market size and forecast 2024-2029
- Chart on France - Market size and forecast 2024-2029 ($ million)
- Data Table on France - Market size and forecast 2024-2029 ($ million)
- Chart on France - Year-over-year growth 2024-2029 (%)
- Data Table on France - Year-over-year growth 2024-2029 (%)
- 12.13 Italy - Market size and forecast 2024-2029
- Chart on Italy - Market size and forecast 2024-2029 ($ million)
- Data Table on Italy - Market size and forecast 2024-2029 ($ million)
- Chart on Italy - Year-over-year growth 2024-2029 (%)
- Data Table on Italy - Year-over-year growth 2024-2029 (%)
- 12.14 China - Market size and forecast 2024-2029
- Chart on China - Market size and forecast 2024-2029 ($ million)
- Data Table on China - Market size and forecast 2024-2029 ($ million)
- Chart on China - Year-over-year growth 2024-2029 (%)
- Data Table on China - Year-over-year growth 2024-2029 (%)
- 12.15 Japan - Market size and forecast 2024-2029
- Chart on Japan - Market size and forecast 2024-2029 ($ million)
- Data Table on Japan - Market size and forecast 2024-2029 ($ million)
- Chart on Japan - Year-over-year growth 2024-2029 (%)
- Data Table on Japan - Year-over-year growth 2024-2029 (%)
- 12.16 India - Market size and forecast 2024-2029
- Chart on India - Market size and forecast 2024-2029 ($ million)
- Data Table on India - Market size and forecast 2024-2029 ($ million)
- Chart on India - Year-over-year growth 2024-2029 (%)
- Data Table on India - Year-over-year growth 2024-2029 (%)
- 12.17 South Korea - Market size and forecast 2024-2029
- Chart on South Korea - Market size and forecast 2024-2029 ($ million)
- Data Table on South Korea - Market size and forecast 2024-2029 ($ million)
- Chart on South Korea - Year-over-year growth 2024-2029 (%)
- Data Table on South Korea - Year-over-year growth 2024-2029 (%)
- 12.18 Market opportunity By Geographical Landscape
- Market opportunity By Geographical Landscape ($ million)
- Data Tables on Market opportunity By Geographical Landscape ($ million)
13 Drivers, Challenges, and Opportunity/Restraints
- 13.1 Market drivers
- 13.2 Market challenges
- 13.3 Impact of drivers and challenges
- Impact of drivers and challenges in 2024 and 2029
- 13.4 Market opportunities/restraints
14 Competitive Landscape
- 14.1 Overview
- 14.2 Competitive Landscape
- Overview on criticality of inputs and factors of differentiation
- 14.3 Landscape disruption
- Overview on factors of disruption
- 14.4 Industry risks
- Impact of key risks on business
15 Competitive Analysis
- 15.1 Companies profiled
- Companies covered
- 15.2 Company ranking index
- Company ranking index
- 15.3 Market positioning of companies
- Matrix on companies position and classification
- 15.4 Bard HVAC
- Bard HVAC - Overview
- Bard HVAC - Product / Service
- Bard HVAC - Key offerings
- SWOT
- 15.5 Carrier Global Corp.
- Carrier Global Corp. - Overview
- Carrier Global Corp. - Business segments
- Carrier Global Corp. - Key news
- Carrier Global Corp. - Key offerings
- Carrier Global Corp. - Segment focus
- SWOT
- 15.6 Daikin Industries Ltd.
- Daikin Industries Ltd. - Overview
- Daikin Industries Ltd. - Business segments
- Daikin Industries Ltd. - Key news
- Daikin Industries Ltd. - Key offerings
- Daikin Industries Ltd. - Segment focus
- SWOT
- 15.7 Danfoss AS
- Danfoss AS - Overview
- Danfoss AS - Product / Service
- Danfoss AS - Key offerings
- SWOT
- 15.8 Energy Smart Alternatives.
- Energy Smart Alternatives. - Overview
- Energy Smart Alternatives. - Product / Service
- Energy Smart Alternatives. - Key offerings
- SWOT
- 15.9 Glen Dimplex Group.
- Glen Dimplex Group. - Overview
- Glen Dimplex Group. - Product / Service
- Glen Dimplex Group. - Key offerings
- SWOT
- 15.10 Johnson Controls International Plc
- Johnson Controls International Plc - Overview
- Johnson Controls International Plc - Business segments
- Johnson Controls International Plc - Key news
- Johnson Controls International Plc - Key offerings
- Johnson Controls International Plc - Segment focus
- SWOT
- 15.11 Mitsubishi Corp.
- Mitsubishi Corp. - Overview
- Mitsubishi Corp. - Business segments
- Mitsubishi Corp. - Key news
- Mitsubishi Corp. - Key offerings
- Mitsubishi Corp. - Segment focus
- SWOT
- 15.12 NIBE Industrier AB
- NIBE Industrier AB - Overview
- NIBE Industrier AB - Business segments
- NIBE Industrier AB - Key news
- NIBE Industrier AB - Key offerings
- NIBE Industrier AB - Segment focus
- SWOT
- 15.13 Robert Bosch GmbH
- Robert Bosch GmbH - Overview
- Robert Bosch GmbH - Product / Service
- Robert Bosch GmbH - Key news
- Robert Bosch GmbH - Key offerings
- SWOT
- 15.14 Sirac Air Conditioning Equipments Co. Ltd.
- Sirac Air Conditioning Equipments Co. Ltd. - Overview
- Sirac Air Conditioning Equipments Co. Ltd. - Product / Service
- Sirac Air Conditioning Equipments Co. Ltd. - Key offerings
- SWOT
- 15.15 Stiebel Eltron GmbH and Co. KG
- Stiebel Eltron GmbH and Co. KG - Overview
- Stiebel Eltron GmbH and Co. KG - Product / Service
- Stiebel Eltron GmbH and Co. KG - Key offerings
- SWOT
- 15.16 Trane Technologies Plc
- Trane Technologies Plc - Overview
- Trane Technologies Plc - Business segments
- Trane Technologies Plc - Key news
- Trane Technologies Plc - Key offerings
- Trane Technologies Plc - Segment focus
- SWOT
- 15.17 Vaillant Group
- Vaillant Group - Overview
- Vaillant Group - Product / Service
- Vaillant Group - Key offerings
- SWOT
- 15.18 Viessmann Climate Solutions SE
- Viessmann Climate Solutions SE - Overview
- Viessmann Climate Solutions SE - Product / Service
- Viessmann Climate Solutions SE - Key offerings
- SWOT
16 Appendix
- 16.1 Scope of the report
- 16.2 Inclusions and exclusions checklist
- Inclusions checklist
- Exclusions checklist
- 16.3 Currency conversion rates for US$
- Currency conversion rates for US$
- 16.4 Research methodology
- Research methodology
- 16.5 Data procurement
- Information sources
- 16.6 Data validation
- Data validation
- 16.7 Validation techniques employed for market sizing
- Validation techniques employed for market sizing
- 16.8 Data synthesis
- Data synthesis
- 16.9 360 degree market analysis
- 360 degree market analysis
- 16.10 List of abbreviations
- List of abbreviations

