|
|
市場調査レポート
商品コード
1652904
パーム油の世界市場、2025-2029年Global Palm Oil Market 2025-2029 |
||||||
|
|||||||
カスタマイズ可能
|
|||||||

| パーム油の世界市場、2025-2029年 |
|
出版日: 2025年01月29日
発行: TechNavio
ページ情報: 英文 202 Pages
納期: 即納可能
|

全表示
- 概要
- 目次
パーム油市場は2024-2029年に544億米ドル、予測期間中のCAGRは9%で成長すると予測されます。
当レポートでは、パーム油市場の全体的な分析、市場規模・予測、動向、成長促進要因、課題、約25のベンダーを網羅したベンダー分析などを掲載しています。
現在の市場シナリオ、最新動向と促進要因、市場環境全体に関する最新分析を提供しています。市場は、パーム油の健康上の利点に関する消費者の意識の高まり、バイオ燃料の需要増加、産業用途の需要増加が市場の見通しを高めています。
| 市場範囲 | |
|---|---|
| 基準年 | 2025 |
| 終了年 | 2029 |
| 予測期間 | 2025-2029 |
| 成長モメンタム | 加速 |
| 前年比2025年 | 8.2% |
| CAGR | 9% |
| 増分額 | 544億米ドル |
本調査は、業界の主要参加者からのインプットを含め、一次情報と二次情報を客観的に組み合わせて実施しました。レポートには、主要企業の分析に加え、包括的な市場規模データ、地域別分析によるセグメント、ベンダー情勢が含まれています。レポートには過去データと予測データがあります。
本調査では、バイオ燃料分野におけるパーム油の新たな成長の道が、今後数年間のパーム油市場の成長を促進する主要な理由の一つであると特定しています。また、透明性、トレーサビリティの問題、パーム油農業へのドローンの使用は、市場の大きな需要につながります。
目次
第1章 エグゼクティブサマリー
- 市場概要
第2章 Technavio分析
- 価格・ライフサイクル・顧客購入バスケット・採用率・購入基準の分析
- インプットの重要性と差別化の要因
- 混乱の要因
- 促進要因と課題の影響
第3章 市場情勢
- 市場エコシステム
- 市場の特徴
- バリューチェーン分析
第4章 市場規模
- 市場の定義
- 市場セグメント分析
- 市場規模 2024
- 市場の見通し 2024-2029
第5章 市場規模実績
- パーム油の世界市場 2019-2023
- 用途別セグメント分析 2019-2023
- タイプセグメント分析 2019-2023
- 地域別セグメント分析 2019-2023
- 国別セグメント分析 2019-2023
第6章 定性分析
- AIの影響:パーム油の世界市場
第7章 ファイブフォース分析
- ファイブフォースの要約
- 買い手の交渉力
- 供給企業の交渉力
- 新規参入業者の脅威
- 代替品の脅威
- 競争の脅威
- 市況
第8章 市場セグメンテーション:用途別
- 市場セグメント
- 比較:用途別
- 食用油:市場規模と予測 2024-2029
- 界面活性剤:市場規模と予測 2024-2029
- バイオ燃料:市場規模と予測 2024-2029
- その他:市場規模と予測 2024-2029
- 市場機会:用途別
第9章 市場セグメンテーション:タイプ別
- 市場セグメント
- 比較:タイプ別
- 従来型:市場規模と予測 2024-2029
- オーガニック:市場規模と予測 2024-2029
- 市場機会:タイプ別
第10章 顧客情勢
- 顧客情勢の概要
第11章 地域別情勢
- 地域別セグメンテーション
- 地域別比較
- アジア太平洋:市場規模と予測 2024-2029
- 中東・アフリカ:市場規模と予測 2024-2029
- 欧州:市場規模と予測 2024-2029
- 北米:市場規模と予測 2024-2029
- 南米:市場規模と予測 2024-2029
- インドネシア:市場規模と予測 2024-2029
- インド:市場規模と予測 2024-2029
- 中国:市場規模と予測 2024-2029
- パキスタン:市場規模と予測 2024-2029
- マレーシア:市場規模と予測 2024-2029
- サウジアラビア:市場規模と予測 2024-2029
- アラブ首長国連邦:市場規模と予測 2024-2029
- カタール:市場規模と予測 2024-2029
- 英国:市場規模と予測 2024-2029
- ドイツ:市場規模と予測 2024-2029
- 市場機会:地域情勢別
第12章 促進要因・課題・機会・抑制要因
- 市場促進要因
- 市場の課題
- 促進要因と課題の影響
- 市場の機会・抑制要因
第13章 競合情勢
- 概要
- 競合情勢
- 混乱の状況
- 業界のリスク
第14章 競合分析
- 企業プロファイル
- 企業ランキング指数
- 企業の市場ポジショニング
- Alami Commodities Sdn Bhd
- Alfa Laval AB
- Archer Daniels Midland Co.
- Asian Agri
- Best Industry Group
- Charleston Holdings Pte Ltd.
- Crowe LLP
- Godrej Agrovet Ltd
- Gujarat Ambuja Exports Ltd.
- IOI Corp. Berhad
- Kuala Lumpur Kepong Berhad
- Oil Palm India Ltd.
- Sime Darby Plantation Berhad
- Sinar Mas
- Univanich Palm Oil Public Co. Ltd.
第15章 付録
The palm oil market is forecasted to grow by USD 54.4 bn during 2024-2029, accelerating at a CAGR of 9% during the forecast period. The report on the palm oil market provides a holistic analysis, market size and forecast, trends, growth drivers, and challenges, as well as vendor analysis covering around 25 vendors.
The report offers an up-to-date analysis regarding the current market scenario, the latest trends and drivers, and the overall market environment. The market is driven by increasing consumer awareness regarding health benefits of palm oil, rising demand for biofuels, and growing demand for industrial applications elevating market prospects.
| Market Scope | |
|---|---|
| Base Year | 2025 |
| End Year | 2029 |
| Series Year | 2025-2029 |
| Growth Momentum | Accelerate |
| YOY 2025 | 8.2% |
| CAGR | 9% |
| Incremental Value | $54.4 bn |
The study was conducted using an objective combination of primary and secondary information including inputs from key participants in the industry. The report contains a comprehensive market size data, segment with regional analysis and vendor landscape in addition to an analysis of the key companies. Reports have historic and forecast data.
Technavio's palm oil market is segmented as below:
By Application
- Edible oil
- Surfactants
- Bio-diesel
- Others
By Type
- Conventional
- Organic
By Geographical Landscape
- APAC
- Middle East and Africa
- Europe
- North America
- South America
This study identifies the new growth avenue for palm oil in biodiesel as one of the prime reasons driving the palm oil market growth during the next few years. Also, transparency, and traceability issues and using drones for palm oil farming will lead to sizable demand in the market.
The report on the palm oil market covers the following areas:
- Palm Oil Market sizing
- Palm Oil Market forecast
- Palm Oil Market industry analysis
The robust vendor analysis is designed to help clients improve their market position, and in line with this, this report provides a detailed analysis of several leading palm oil market vendors that include Agarwal Industries P Ltd., Alami Commodities Sdn Bhd, Alfa Laval AB, Archer Daniels Midland Co., Asian Agri, Best Industry Group, Cargill Inc., Charleston Holdings Pte Ltd., Crowe LLP, Godrej Agrovet Ltd, Gujarat Ambuja Exports Ltd., IOI Corp. Berhad, Kuala Lumpur Kepong Berhad, Musim Mas Group, Nisshin OilliO Group Ltd., Oil Palm India Ltd., Patanjali Ayurved Ltd., Sime Darby Plantation Berhad, Sinar Mas, and Univanich Palm Oil Public Co. Ltd.. Also, the palm oil market analysis report includes information on upcoming trends and challenges that will influence market growth. This is to help companies strategize and leverage all forthcoming growth opportunities.
The publisher presents a detailed picture of the market by the way of study, synthesis, and summation of data from multiple sources by an analysis of key parameters such as profit, pricing, competition, and promotions. It presents various market facets by identifying the key industry influencers. The data presented is comprehensive, reliable, and a result of extensive primary and secondary research. The market research reports provide a complete competitive landscape and an in-depth vendor selection methodology and analysis using qualitative and quantitative research to forecast accurate market growth.
Table of Contents
1 Executive Summary
- 1.1 Market overview
- Executive Summary - Chart on Market Overview
- Executive Summary - Data Table on Market Overview
- Executive Summary - Chart on Global Market Characteristics
- Executive Summary - Chart on Market By Geographical Landscape
- Executive Summary - Chart on Market Segmentation by Application
- Executive Summary - Chart on Market Segmentation by Type
- Executive Summary - Chart on Incremental Growth
- Executive Summary - Data Table on Incremental Growth
- Executive Summary - Chart on Company Market Positioning
2 Technavio Analysis
- 2.1 Analysis of price sensitivity, lifecycle, customer purchase basket, adoption rates, and purchase criteria
- Analysis of price sensitivity, lifecycle, customer purchase basket, adoption rates, and purchase criteria
- 2.2 Criticality of inputs and Factors of differentiation
- Overview on criticality of inputs and factors of differentiation
- 2.3 Factors of disruption
- Overview on factors of disruption
- 2.4 Impact of drivers and challenges
- Impact of drivers and challenges in 2024 and 2029
3 Market Landscape
- 3.1 Market ecosystem
- Parent Market
- Data Table on - Parent Market
- 3.2 Market characteristics
- Market characteristics analysis
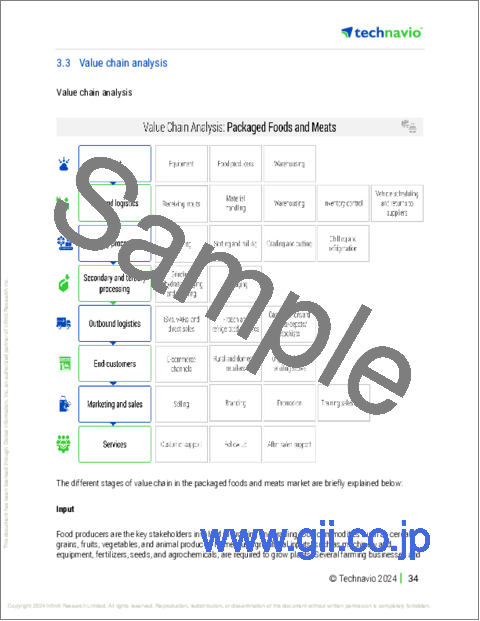
- 3.3 Value chain analysis
- Value chain analysis
4 Market Sizing
- 4.1 Market definition
- Offerings of companies included in the market definition
- 4.2 Market segment analysis
- Market segments
- 4.3 Market size 2024
- 4.4 Market outlook: Forecast for 2024-2029
- Chart on Global - Market size and forecast 2024-2029 ($ billion)
- Data Table on Global - Market size and forecast 2024-2029 ($ billion)
- Chart on Global Market: Year-over-year growth 2024-2029 (%)
- Data Table on Global Market: Year-over-year growth 2024-2029 (%)
5 Historic Market Size
- 5.1 Global Palm Oil Market 2019 - 2023
- Historic Market Size - Data Table on Global Palm Oil Market 2019 - 2023 ($ billion)
- 5.2 Application segment analysis 2019 - 2023
- Historic Market Size - Application Segment 2019 - 2023 ($ billion)
- 5.3 Type segment analysis 2019 - 2023
- Historic Market Size - Type Segment 2019 - 2023 ($ billion)
- 5.4 Geography segment analysis 2019 - 2023
- Historic Market Size - Geography Segment 2019 - 2023 ($ billion)
- 5.5 Country segment analysis 2019 - 2023
- Historic Market Size - Country Segment 2019 - 2023 ($ billion)
6 Qualitative Analysis
- 6.1 Impact of AI on the Global Palm Oil Market
7 Five Forces Analysis
- 7.1 Five forces summary
- Five forces analysis - Comparison between 2024 and 2029
- 7.2 Bargaining power of buyers
- Bargaining power of buyers - Impact of key factors 2024 and 2029
- 7.3 Bargaining power of suppliers
- Bargaining power of suppliers - Impact of key factors in 2024 and 2029
- 7.4 Threat of new entrants
- Threat of new entrants - Impact of key factors in 2024 and 2029
- 7.5 Threat of substitutes
- Threat of substitutes - Impact of key factors in 2024 and 2029
- 7.6 Threat of rivalry
- Threat of rivalry - Impact of key factors in 2024 and 2029
- 7.7 Market condition
- Chart on Market condition - Five forces 2024 and 2029
8 Market Segmentation by Application
- 8.1 Market segments
- Chart on Application - Market share 2024-2029 (%)
- Data Table on Application - Market share 2024-2029 (%)
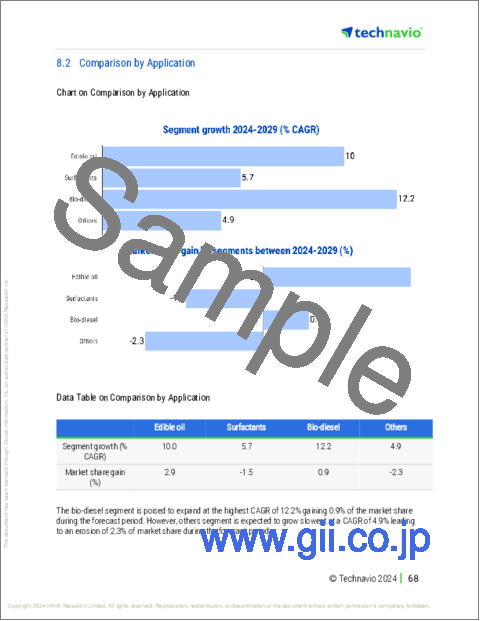
- 8.2 Comparison by Application
- Chart on Comparison by Application
- Data Table on Comparison by Application
- 8.3 Edible oil - Market size and forecast 2024-2029
- Chart on Edible oil - Market size and forecast 2024-2029 ($ billion)
- Data Table on Edible oil - Market size and forecast 2024-2029 ($ billion)
- Chart on Edible oil - Year-over-year growth 2024-2029 (%)
- Data Table on Edible oil - Year-over-year growth 2024-2029 (%)
- 8.4 Surfactants - Market size and forecast 2024-2029
- Chart on Surfactants - Market size and forecast 2024-2029 ($ billion)
- Data Table on Surfactants - Market size and forecast 2024-2029 ($ billion)
- Chart on Surfactants - Year-over-year growth 2024-2029 (%)
- Data Table on Surfactants - Year-over-year growth 2024-2029 (%)
- 8.5 Bio-diesel - Market size and forecast 2024-2029
- Chart on Bio-diesel - Market size and forecast 2024-2029 ($ billion)
- Data Table on Bio-diesel - Market size and forecast 2024-2029 ($ billion)
- Chart on Bio-diesel - Year-over-year growth 2024-2029 (%)
- Data Table on Bio-diesel - Year-over-year growth 2024-2029 (%)
- 8.6 Others - Market size and forecast 2024-2029
- Chart on Others - Market size and forecast 2024-2029 ($ billion)
- Data Table on Others - Market size and forecast 2024-2029 ($ billion)
- Chart on Others - Year-over-year growth 2024-2029 (%)
- Data Table on Others - Year-over-year growth 2024-2029 (%)
- 8.7 Market opportunity by Application
- Market opportunity by Application ($ billion)
- Data Table on Market opportunity by Application ($ billion)
9 Market Segmentation by Type
- 9.1 Market segments
- Chart on Type - Market share 2024-2029 (%)
- Data Table on Type - Market share 2024-2029 (%)
- 9.2 Comparison by Type
- Chart on Comparison by Type
- Data Table on Comparison by Type
- 9.3 Conventional - Market size and forecast 2024-2029
- Chart on Conventional - Market size and forecast 2024-2029 ($ billion)
- Data Table on Conventional - Market size and forecast 2024-2029 ($ billion)
- Chart on Conventional - Year-over-year growth 2024-2029 (%)
- Data Table on Conventional - Year-over-year growth 2024-2029 (%)
- 9.4 Organic - Market size and forecast 2024-2029
- Chart on Organic - Market size and forecast 2024-2029 ($ billion)
- Data Table on Organic - Market size and forecast 2024-2029 ($ billion)
- Chart on Organic - Year-over-year growth 2024-2029 (%)
- Data Table on Organic - Year-over-year growth 2024-2029 (%)
- 9.5 Market opportunity by Type
- Market opportunity by Type ($ billion)
- Data Table on Market opportunity by Type ($ billion)
10 Customer Landscape
- 10.1 Customer landscape overview
- Analysis of price sensitivity, lifecycle, customer purchase basket, adoption rates, and purchase criteria
11 Geographic Landscape
- 11.1 Geographic segmentation
- Chart on Market share By Geographical Landscape 2024-2029 (%)
- Data Table on Market share By Geographical Landscape 2024-2029 (%)
- 11.2 Geographic comparison
- Chart on Geographic comparison
- Data Table on Geographic comparison
- 11.3 APAC - Market size and forecast 2024-2029
- Chart on APAC - Market size and forecast 2024-2029 ($ billion)
- Data Table on APAC - Market size and forecast 2024-2029 ($ billion)
- Chart on APAC - Year-over-year growth 2024-2029 (%)
- Data Table on APAC - Year-over-year growth 2024-2029 (%)
- 11.4 Middle East and Africa - Market size and forecast 2024-2029
- Chart on Middle East and Africa - Market size and forecast 2024-2029 ($ billion)
- Data Table on Middle East and Africa - Market size and forecast 2024-2029 ($ billion)
- Chart on Middle East and Africa - Year-over-year growth 2024-2029 (%)
- Data Table on Middle East and Africa - Year-over-year growth 2024-2029 (%)
- 11.5 Europe - Market size and forecast 2024-2029
- Chart on Europe - Market size and forecast 2024-2029 ($ billion)
- Data Table on Europe - Market size and forecast 2024-2029 ($ billion)
- Chart on Europe - Year-over-year growth 2024-2029 (%)
- Data Table on Europe - Year-over-year growth 2024-2029 (%)
- 11.6 North America - Market size and forecast 2024-2029
- Chart on North America - Market size and forecast 2024-2029 ($ billion)
- Data Table on North America - Market size and forecast 2024-2029 ($ billion)
- Chart on North America - Year-over-year growth 2024-2029 (%)
- Data Table on North America - Year-over-year growth 2024-2029 (%)
- 11.7 South America - Market size and forecast 2024-2029
- Chart on South America - Market size and forecast 2024-2029 ($ billion)
- Data Table on South America - Market size and forecast 2024-2029 ($ billion)
- Chart on South America - Year-over-year growth 2024-2029 (%)
- Data Table on South America - Year-over-year growth 2024-2029 (%)
- 11.8 Indonesia - Market size and forecast 2024-2029
- Chart on Indonesia - Market size and forecast 2024-2029 ($ billion)
- Data Table on Indonesia - Market size and forecast 2024-2029 ($ billion)
- Chart on Indonesia - Year-over-year growth 2024-2029 (%)
- Data Table on Indonesia - Year-over-year growth 2024-2029 (%)
- 11.9 India - Market size and forecast 2024-2029
- Chart on India - Market size and forecast 2024-2029 ($ billion)
- Data Table on India - Market size and forecast 2024-2029 ($ billion)
- Chart on India - Year-over-year growth 2024-2029 (%)
- Data Table on India - Year-over-year growth 2024-2029 (%)
- 11.10 China - Market size and forecast 2024-2029
- Chart on China - Market size and forecast 2024-2029 ($ billion)
- Data Table on China - Market size and forecast 2024-2029 ($ billion)
- Chart on China - Year-over-year growth 2024-2029 (%)
- Data Table on China - Year-over-year growth 2024-2029 (%)
- 11.11 Pakistan - Market size and forecast 2024-2029
- Chart on Pakistan - Market size and forecast 2024-2029 ($ billion)
- Data Table on Pakistan - Market size and forecast 2024-2029 ($ billion)
- Chart on Pakistan - Year-over-year growth 2024-2029 (%)
- Data Table on Pakistan - Year-over-year growth 2024-2029 (%)
- 11.12 Malaysia - Market size and forecast 2024-2029
- Chart on Malaysia - Market size and forecast 2024-2029 ($ billion)
- Data Table on Malaysia - Market size and forecast 2024-2029 ($ billion)
- Chart on Malaysia - Year-over-year growth 2024-2029 (%)
- Data Table on Malaysia - Year-over-year growth 2024-2029 (%)
- 11.13 Saudi Arabia - Market size and forecast 2024-2029
- Chart on Saudi Arabia - Market size and forecast 2024-2029 ($ billion)
- Data Table on Saudi Arabia - Market size and forecast 2024-2029 ($ billion)
- Chart on Saudi Arabia - Year-over-year growth 2024-2029 (%)
- Data Table on Saudi Arabia - Year-over-year growth 2024-2029 (%)
- 11.14 UAE - Market size and forecast 2024-2029
- Chart on UAE - Market size and forecast 2024-2029 ($ billion)
- Data Table on UAE - Market size and forecast 2024-2029 ($ billion)
- Chart on UAE - Year-over-year growth 2024-2029 (%)
- Data Table on UAE - Year-over-year growth 2024-2029 (%)
- 11.15 Qatar - Market size and forecast 2024-2029
- Chart on Qatar - Market size and forecast 2024-2029 ($ billion)
- Data Table on Qatar - Market size and forecast 2024-2029 ($ billion)
- Chart on Qatar - Year-over-year growth 2024-2029 (%)
- Data Table on Qatar - Year-over-year growth 2024-2029 (%)
- 11.16 UK - Market size and forecast 2024-2029
- Chart on UK - Market size and forecast 2024-2029 ($ billion)
- Data Table on UK - Market size and forecast 2024-2029 ($ billion)
- Chart on UK - Year-over-year growth 2024-2029 (%)
- Data Table on UK - Year-over-year growth 2024-2029 (%)
- 11.17 Germany - Market size and forecast 2024-2029
- Chart on Germany - Market size and forecast 2024-2029 ($ billion)
- Data Table on Germany - Market size and forecast 2024-2029 ($ billion)
- Chart on Germany - Year-over-year growth 2024-2029 (%)
- Data Table on Germany - Year-over-year growth 2024-2029 (%)
- 11.18 Market opportunity By Geographical Landscape
- Market opportunity By Geographical Landscape ($ billion)
- Data Tables on Market opportunity By Geographical Landscape ($ billion)
12 Drivers, Challenges, and Opportunity/Restraints
- 12.1 Market drivers
- 12.2 Market challenges
- 12.3 Impact of drivers and challenges
- Impact of drivers and challenges in 2024 and 2029
- 12.4 Market opportunities/restraints
13 Competitive Landscape
- 13.1 Overview
- 13.2 Competitive Landscape
- Overview on criticality of inputs and factors of differentiation
- 13.3 Landscape disruption
- Overview on factors of disruption
- 13.4 Industry risks
- Impact of key risks on business
14 Competitive Analysis
- 14.1 Companies profiled
- Companies covered
- 14.2 Company ranking index
- Company ranking index
- 14.3 Market positioning of companies
- Matrix on companies position and classification
- 14.4 Alami Commodities Sdn Bhd
- Alami Commodities Sdn Bhd - Overview
- Alami Commodities Sdn Bhd - Product / Service
- Alami Commodities Sdn Bhd - Key offerings
- SWOT
- 14.5 Alfa Laval AB
- Alfa Laval AB - Overview
- Alfa Laval AB - Business segments
- Alfa Laval AB - Key news
- Alfa Laval AB - Key offerings
- Alfa Laval AB - Segment focus
- SWOT
- 14.6 Archer Daniels Midland Co.
- Archer Daniels Midland Co. - Overview
- Archer Daniels Midland Co. - Business segments
- Archer Daniels Midland Co. - Key news
- Archer Daniels Midland Co. - Key offerings
- Archer Daniels Midland Co. - Segment focus
- SWOT
- 14.7 Asian Agri
- Asian Agri - Overview
- Asian Agri - Product / Service
- Asian Agri - Key offerings
- SWOT
- 14.8 Best Industry Group
- Best Industry Group - Overview
- Best Industry Group - Product / Service
- Best Industry Group - Key offerings
- SWOT
- 14.9 Charleston Holdings Pte Ltd.
- Charleston Holdings Pte Ltd. - Overview
- Charleston Holdings Pte Ltd. - Product / Service
- Charleston Holdings Pte Ltd. - Key offerings
- SWOT
- 14.10 Crowe LLP
- Crowe LLP - Overview
- Crowe LLP - Product / Service
- Crowe LLP - Key offerings
- SWOT
- 14.11 Godrej Agrovet Ltd
- Godrej Agrovet Ltd - Overview
- Godrej Agrovet Ltd - Business segments
- Godrej Agrovet Ltd - Key offerings
- Godrej Agrovet Ltd - Segment focus
- SWOT
- 14.12 Gujarat Ambuja Exports Ltd.
- Gujarat Ambuja Exports Ltd. - Overview
- Gujarat Ambuja Exports Ltd. - Business segments
- Gujarat Ambuja Exports Ltd. - Key offerings
- Gujarat Ambuja Exports Ltd. - Segment focus
- SWOT
- 14.13 IOI Corp. Berhad
- IOI Corp. Berhad - Overview
- IOI Corp. Berhad - Business segments
- IOI Corp. Berhad - Key offerings
- IOI Corp. Berhad - Segment focus
- SWOT
- 14.14 Kuala Lumpur Kepong Berhad
- Kuala Lumpur Kepong Berhad - Overview
- Kuala Lumpur Kepong Berhad - Business segments
- Kuala Lumpur Kepong Berhad - Key offerings
- Kuala Lumpur Kepong Berhad - Segment focus
- SWOT
- 14.15 Oil Palm India Ltd.
- Oil Palm India Ltd. - Overview
- Oil Palm India Ltd. - Product / Service
- Oil Palm India Ltd. - Key offerings
- SWOT
- 14.16 Sime Darby Plantation Berhad
- Sime Darby Plantation Berhad - Overview
- Sime Darby Plantation Berhad - Business segments
- Sime Darby Plantation Berhad - Key news
- Sime Darby Plantation Berhad - Key offerings
- Sime Darby Plantation Berhad - Segment focus
- SWOT
- 14.17 Sinar Mas
- Sinar Mas - Overview
- Sinar Mas - Product / Service
- Sinar Mas - Key offerings
- SWOT
- 14.18 Univanich Palm Oil Public Co. Ltd.
- Univanich Palm Oil Public Co. Ltd. - Overview
- Univanich Palm Oil Public Co. Ltd. - Business segments
- Univanich Palm Oil Public Co. Ltd. - Key offerings
- Univanich Palm Oil Public Co. Ltd. - Segment focus
- SWOT
15 Appendix
- 15.1 Scope of the report
- 15.2 Inclusions and exclusions checklist
- Inclusions checklist
- Exclusions checklist
- 15.3 Currency conversion rates for US$
- Currency conversion rates for US$
- 15.4 Research methodology
- Research methodology
- 15.5 Data procurement
- Information sources
- 15.6 Data validation
- Data validation
- 15.7 Validation techniques employed for market sizing
- Validation techniques employed for market sizing
- 15.8 Data synthesis
- Data synthesis
- 15.9 360 degree market analysis
- 360 degree market analysis
- 15.10 List of abbreviations
- List of abbreviations

