|
|
市場調査レポート
商品コード
1975616
高等教育におけるシミュレーション学習の世界市場 2026年~2030年Global Simulation Learning Market In Higher Education 2026-2030 |
||||||

|
|||||||
カスタマイズ可能
|
|||||||

| 高等教育におけるシミュレーション学習の世界市場 2026年~2030年 |
|
出版日: 2026年03月09日
発行: TechNavio
ページ情報: 英文 277 Pages
納期: 即納可能
|

概要
高等教育分野における世界のシミュレーション学習市場は、2025年から2030年にかけて32億3,310万米ドルの成長が見込まれ、予測期間中のCAGRは23.3%と予測されております。
本報告書では、高等教育分野の世界のシミュレーション学習市場について、包括的な分析、市場規模と予測、動向、成長要因、課題に加え、約25社のベンダー分析を提供しております。
本レポートは、現在の市場状況、最新の動向と促進要因、市場環境全般に関する最新の分析を提供します。市場は、モバイルベースの学習の普及率向上、STEM教育への需要拡大、オンライン高等教育への入学率上昇によって牽引されています。
本調査は、業界の主要関係者からの情報を含む一次情報と二次情報を客観的に組み合わせて実施されました。本レポートには、主要企業の分析に加え、包括的な市場規模データ、地域別分析を伴うセグメント、ベンダー情勢が含まれています。レポートには過去データと予測データが記載されています。
| 市場範囲 | |
|---|---|
| 基準年 | 2026年 |
| 終了年 | 2030年 |
| 予測期間 | 2026-2030 |
| 成長モメンタム | 加速 |
| 前年比2026年 | 18.2% |
| CAGR | 23.3% |
| 増分額 | 32億3,310万米ドル |
本調査では、医療シミュレーションへのAI技術統合が、今後数年間における高等教育分野の世界のシミュレーション学習市場成長を牽引する主要要因の一つであると特定しております。また、仮想現実(VR)および拡張現実(AR)技術の進歩と、カレッジにおける技術導入の増加が、市場における相当な需要創出につながると予測されます。
目次
第1章 エグゼクティブサマリー
第2章 Technavio分析
- 価格・ライフサイクル・顧客購入バスケット・採用率・購入基準の分析
- インプットの重要性と差別化の要因
- 混乱の要因
- 促進要因と課題の影響
第3章 市場情勢
- 市場エコシステム
- 市場の特徴
- バリューチェーン分析
第4章 市場規模
- 市場の定義
- 市場セグメント分析
- 市場規模 2025
- 市場の見通し 2025-2030
第5章 市場規模実績
- 高等教育におけるシミュレーション学習の世界市場 2020-2024
- タイプセグメント分析 2020-2024
- 展開セグメント分析 2020-2024
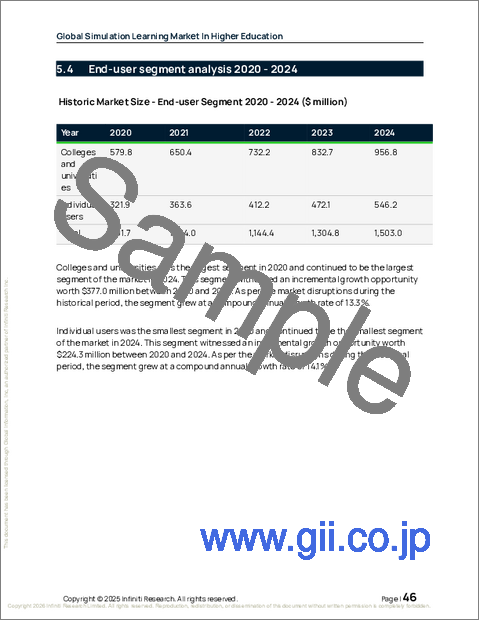
- エンドユーザーセグメント分析 2020-2024
- 地域別セグメント分析 2020-2024
- 国別セグメント分析 2020-2024
第6章 定性分析
- AIの影響:高等教育におけるシミュレーション学習の世界市場
第7章 ファイブフォース分析
- ファイブフォースの要約
- 買い手の交渉力
- 供給企業の交渉力
- 新規参入業者の脅威
- 代替品の脅威
- 競争の脅威
- 市況
第8章 市場セグメンテーション:タイプ別
- 比較:タイプ別
- STEMシミュレーション学習
- 非STEMシミュレーション学習
- 市場機会:タイプ別
第9章 市場セグメンテーション:展開別
- 比較:展開別
- オンプレミス
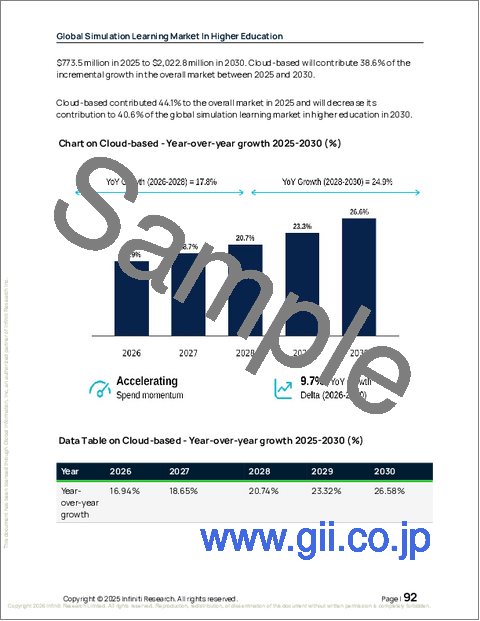
- クラウドベース
- 市場機会:展開別
第10章 市場セグメンテーション:エンドユーザー別
- 比較:エンドユーザー別
- カレッジ・高等教育機関
- 個人ユーザー
- 市場機会:エンドユーザー別
第11章 顧客情勢
第12章 地域別情勢
- 地域別セグメンテーション
- 地域別比較
- 北米
- 米国
- カナダ
- メキシコ
- 欧州
- ドイツ
- 英国
- フランス
- イタリア
- スペイン
- オランダ
- アジア太平洋
- 中国
- 日本
- インド
- 韓国
- オーストラリア
- インドネシア
- 南米
- ブラジル
- アルゼンチン
- コロンビア
- 中東・アフリカ
- サウジアラビア
- アラブ首長国連邦
- 南アフリカ
- イスラエル
- トルコ
- 市場機会:地域別
第13章 促進要因・課題・機会
- 市場促進要因
- 市場の課題
- 促進要因と課題の影響
- 市場機会
第14章 競合情勢
- 概要
- 競合情勢
- 混乱の状況
- 業界のリスク
第15章 競合分析
- 企業プロファイル
- 企業ランキング指標
- 企業の市場ポジショニング
- ANSYS Inc.
- Capsim Management Simulations
- Cesim Oy
- Edufic Digital
- Education Management Solutions
- Gaumard Scientific Co. Inc.
- InfoPro Learning Inc.
- Interpretive Software Inc.
- Laerdal Medical AS
- McGraw Hill LLC
- Oxford Medical Simulation Ltd.
- Pearson Plc
- DBA SchoolSims
- Skillwell
- VictoryXR Inc.
