|
|
市場調査レポート
商品コード
1645653
ホームエクイティレンディングの世界市場 2025~2029年Global Home Equity Lending Market 2025-2029 |
||||||

|
|||||||
カスタマイズ可能
|
|||||||


| ホームエクイティレンディングの世界市場 2025~2029年 |
|
出版日: 2025年01月22日
発行: TechNavio
ページ情報: 英文 191 Pages
納期: 即納可能
|

全表示
- 概要
- 図表
- 目次
ホームエクイティレンディング市場は2024~2029年に481億5,530万米ドル、予測期間中のCAGRは4.7%で成長すると予測されます。
当レポートでは、ホームエクイティレンディング市場の全体的な分析、市場規模・予測、動向、成長促進要因、課題、約25のベンダーを網羅したベンダー分析などを掲載しています。
現在の市場シナリオ、最新動向と促進要因、市場環境全体に関する最新分析を提供しています。市場は、住宅価格の大幅な上昇、ホームエクイティローンのメリット、利払いに対する税控除によって牽引されています。
| 市場範囲 | |
|---|---|
| 基準年 | 2025年 |
| 終了年 | 2029年 |
| 予測期間 | 2025~2029年 |
| 成長モメンタム | 加速 |
| 前年比[2025年] | 4.3% |
| CAGR | 4.7% |
| 増分額 | 481億5,530万米ドル |
本調査では、今後数年間のホームエクイティレンディング市場の成長を牽引する主要要因の一つとして、住宅物件の増加を挙げています。また、他のレンディング方法と比較した場合の支払利息の低さや、ホームエクイティレンディングプロセスの技術的進歩は、市場の大きな需要につながります。
目次
第1章 エグゼクティブサマリー
- 市場概要
第2章 Technavio分析
- 価格・ライフサイクル・顧客購入バスケット・採用率・購入基準の分析
- インプットの重要性と差別化の要因
- 混乱の要因
- 促進要因と課題の影響
第3章 市場情勢
- 市場エコシステム
- 市場の特徴
- バリューチェーン分析
第4章 市場規模
- 市場の定義
- 市場セグメント分析
- 市場規模 2024年
- 市場の展望 2024~2029年
第5章 市場規模実績
- ホームエクイティレンディングの世界市場 2019~2023年
- 供給源別セグメント分析 2019~2023年
- 流通チャネル別セグメント分析 2019~2023年
- 地域別セグメント分析 2019~2023年
- 国別セグメント分析 2019~2023年
第6章 定性分析
- AIの影響:ホームエクイティレンディングの世界市場
第7章 ファイブフォース分析
- ファイブフォースの要約
- 買い手の交渉力
- 供給企業の交渉力
- 新規参入業者の脅威
- 代替品の脅威
- 競争の脅威
- 市況
第8章 市場セグメンテーション:供給源別
- 市場セグメント
- 比較:供給源別
- 住宅ローンと信用組合:市場規模と予測 2024~2029年
- 商業銀行:市場規模と予測 2024~2029年
- その他:市場規模と予測 2024~2029年
- 市場機会:供給源別
第9章 市場セグメンテーション:流通チャネル別
- 市場セグメント
- 比較:流通チャネル別
- オフライン:市場規模と予測 2024~2029年
- オンライン:市場規模と予測 2024~2029年
- 市場機会:流通チャネル別
第10章 顧客情勢
- 顧客情勢概要
第11章 地域別情勢
- 地域別セグメンテーション
- 比較:地域別
- 北米:市場規模と予測 2024~2029年
- 欧州:市場規模と予測 2024~2029年
- アジア太平洋:市場規模と予測 2024~2029年
- 南米:市場規模と予測 2024~2029年
- 中東・アフリカ:市場規模と予測 2024~2029年
- 米国:市場規模と予測 2024~2029年
- 中国:市場規模と予測 2024~2029年
- 日本:市場規模と予測 2024~2029年
- ドイツ:市場規模と予測 2024~2029年
- フランス:市場規模と予測 2024~2029年
- 英国:市場規模と予測 2024~2029年
- オーストラリア:市場規模と予測 2024~2029年
- カナダ:市場規模と予測 2024~2029年
- 韓国:市場規模と予測 2024~2029年
- オランダ:市場規模と予測 2024~2029年
- 地域情勢による市場機会
第12章 促進要因・課題・機会・抑制要因
- 市場促進要因
- 市場課題
- 促進要因と課題の影響
- 市場機会・抑制要因
第13章 競合情勢
- 概要
- 競合情勢
- 混乱の状況
- 産業のリスク
第14章 競合分析
- 企業プロファイル
- 企業ランキング指数
- 企業の市場ポジショニング
- A and A Dukaan Financial Services Pvt. Ltd.
- ABC Finance Ltd.
- Bank of America Corp.
- City Holding Company
- JPMorgan Chase and Co.
- Morgan Stanley
- Navy Federal Credit Union
- nbkc bank
- Pentagon Federal Credit Union
- Regions Financial Corp.
- State Bank of India
- The Goldman Sachs Group Inc.
- THE PNC FINANCIAL SERVICES GROUP INC.
- U.S. Bancorp
- Wells Fargo and Co.
第15章 付録
Exhibits:
- Exhibits1: Executive Summary - Chart on Market Overview
- Exhibits2: Executive Summary - Data Table on Market Overview
- Exhibits3: Executive Summary - Chart on Global Market Characteristics
- Exhibits4: Executive Summary - Chart on Market By Geographical Landscape
- Exhibits5: Executive Summary - Chart on Market Segmentation by Source
- Exhibits6: Executive Summary - Chart on Market Segmentation by Distribution Channel
- Exhibits7: Executive Summary - Chart on Incremental Growth
- Exhibits8: Executive Summary - Data Table on Incremental Growth
- Exhibits9: Executive Summary - Chart on Company Market Positioning
- Exhibits10: Analysis of price sensitivity, lifecycle, customer purchase basket, adoption rates, and purchase criteria
- Exhibits11: Overview on criticality of inputs and factors of differentiation
- Exhibits12: Overview on factors of disruption
- Exhibits13: Impact of drivers and challenges in 2024 and 2029
- Exhibits14: Parent Market
- Exhibits15: Data Table on - Parent Market
- Exhibits16: Market characteristics analysis
- Exhibits17: Value chain analysis
- Exhibits18: Offerings of companies included in the market definition
- Exhibits19: Market segments
- Exhibits20: Chart on Global - Market size and forecast 2024-2029 ($ million)
- Exhibits21: Data Table on Global - Market size and forecast 2024-2029 ($ million)
- Exhibits22: Chart on Global Market: Year-over-year growth 2024-2029 (%)
- Exhibits23: Data Table on Global Market: Year-over-year growth 2024-2029 (%)
- Exhibits24: Historic Market Size - Data Table on Global Home Equity Lending Market 2019 - 2023 ($ million)
- Exhibits25: Historic Market Size - Source Segment 2019 - 2023 ($ million)
- Exhibits26: Historic Market Size - Distribution Channel Segment 2019 - 2023 ($ million)
- Exhibits27: Historic Market Size - Geography Segment 2019 - 2023 ($ million)
- Exhibits28: Historic Market Size - Country Segment 2019 - 2023 ($ million)
- Exhibits29: Five forces analysis - Comparison between 2024 and 2029
- Exhibits30: Bargaining power of buyers - Impact of key factors 2024 and 2029
- Exhibits31: Bargaining power of suppliers - Impact of key factors in 2024 and 2029
- Exhibits32: Threat of new entrants - Impact of key factors in 2024 and 2029
- Exhibits33: Threat of substitutes - Impact of key factors in 2024 and 2029
- Exhibits34: Threat of rivalry - Impact of key factors in 2024 and 2029
- Exhibits35: Chart on Market condition - Five forces 2024 and 2029
- Exhibits36: Chart on Source - Market share 2024-2029 (%)
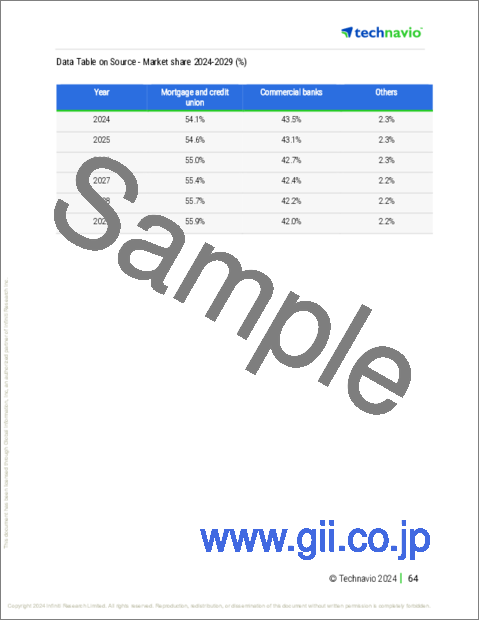
- Exhibits37: Data Table on Source - Market share 2024-2029 (%)
- Exhibits38: Chart on Comparison by Source
- Exhibits39: Data Table on Comparison by Source
- Exhibits40: Chart on Mortgage and credit union - Market size and forecast 2024-2029 ($ million)
- Exhibits41: Data Table on Mortgage and credit union - Market size and forecast 2024-2029 ($ million)
- Exhibits42: Chart on Mortgage and credit union - Year-over-year growth 2024-2029 (%)
- Exhibits43: Data Table on Mortgage and credit union - Year-over-year growth 2024-2029 (%)
- Exhibits44: Chart on Commercial banks - Market size and forecast 2024-2029 ($ million)
- Exhibits45: Data Table on Commercial banks - Market size and forecast 2024-2029 ($ million)
- Exhibits46: Chart on Commercial banks - Year-over-year growth 2024-2029 (%)
- Exhibits47: Data Table on Commercial banks - Year-over-year growth 2024-2029 (%)
- Exhibits48: Chart on Others - Market size and forecast 2024-2029 ($ million)
- Exhibits49: Data Table on Others - Market size and forecast 2024-2029 ($ million)
- Exhibits50: Chart on Others - Year-over-year growth 2024-2029 (%)
- Exhibits51: Data Table on Others - Year-over-year growth 2024-2029 (%)
- Exhibits52: Market opportunity by Source ($ million)
- Exhibits53: Data Table on Market opportunity by Source ($ million)
- Exhibits54: Chart on Distribution Channel - Market share 2024-2029 (%)
- Exhibits55: Data Table on Distribution Channel - Market share 2024-2029 (%)
- Exhibits56: Chart on Comparison by Distribution Channel
- Exhibits57: Data Table on Comparison by Distribution Channel
- Exhibits58: Chart on Offline - Market size and forecast 2024-2029 ($ million)
- Exhibits59: Data Table on Offline - Market size and forecast 2024-2029 ($ million)
- Exhibits60: Chart on Offline - Year-over-year growth 2024-2029 (%)
- Exhibits61: Data Table on Offline - Year-over-year growth 2024-2029 (%)
- Exhibits62: Chart on Online - Market size and forecast 2024-2029 ($ million)
- Exhibits63: Data Table on Online - Market size and forecast 2024-2029 ($ million)
- Exhibits64: Chart on Online - Year-over-year growth 2024-2029 (%)
- Exhibits65: Data Table on Online - Year-over-year growth 2024-2029 (%)
- Exhibits66: Market opportunity by Distribution Channel ($ million)
- Exhibits67: Data Table on Market opportunity by Distribution Channel ($ million)
- Exhibits68: Analysis of price sensitivity, lifecycle, customer purchase basket, adoption rates, and purchase criteria
- Exhibits69: Chart on Market share By Geographical Landscape 2024-2029 (%)
- Exhibits70: Data Table on Market share By Geographical Landscape 2024-2029 (%)
- Exhibits71: Chart on Geographic comparison
- Exhibits72: Data Table on Geographic comparison
- Exhibits73: Chart on North America - Market size and forecast 2024-2029 ($ million)
- Exhibits74: Data Table on North America - Market size and forecast 2024-2029 ($ million)
- Exhibits75: Chart on North America - Year-over-year growth 2024-2029 (%)
- Exhibits76: Data Table on North America - Year-over-year growth 2024-2029 (%)
- Exhibits77: Chart on Europe - Market size and forecast 2024-2029 ($ million)
- Exhibits78: Data Table on Europe - Market size and forecast 2024-2029 ($ million)
- Exhibits79: Chart on Europe - Year-over-year growth 2024-2029 (%)
- Exhibits80: Data Table on Europe - Year-over-year growth 2024-2029 (%)
- Exhibits81: Chart on APAC - Market size and forecast 2024-2029 ($ million)
- Exhibits82: Data Table on APAC - Market size and forecast 2024-2029 ($ million)
- Exhibits83: Chart on APAC - Year-over-year growth 2024-2029 (%)
- Exhibits84: Data Table on APAC - Year-over-year growth 2024-2029 (%)
- Exhibits85: Chart on South America - Market size and forecast 2024-2029 ($ million)
- Exhibits86: Data Table on South America - Market size and forecast 2024-2029 ($ million)
- Exhibits87: Chart on South America - Year-over-year growth 2024-2029 (%)
- Exhibits88: Data Table on South America - Year-over-year growth 2024-2029 (%)
- Exhibits89: Chart on Middle East and Africa - Market size and forecast 2024-2029 ($ million)
- Exhibits90: Data Table on Middle East and Africa - Market size and forecast 2024-2029 ($ million)
- Exhibits91: Chart on Middle East and Africa - Year-over-year growth 2024-2029 (%)
- Exhibits92: Data Table on Middle East and Africa - Year-over-year growth 2024-2029 (%)
- Exhibits93: Chart on US - Market size and forecast 2024-2029 ($ million)
- Exhibits94: Data Table on US - Market size and forecast 2024-2029 ($ million)
- Exhibits95: Chart on US - Year-over-year growth 2024-2029 (%)
- Exhibits96: Data Table on US - Year-over-year growth 2024-2029 (%)
- Exhibits97: Chart on China - Market size and forecast 2024-2029 ($ million)
- Exhibits98: Data Table on China - Market size and forecast 2024-2029 ($ million)
- Exhibits99: Chart on China - Year-over-year growth 2024-2029 (%)
- Exhibits100: Data Table on China - Year-over-year growth 2024-2029 (%)
- Exhibits101: Chart on Japan - Market size and forecast 2024-2029 ($ million)
- Exhibits102: Data Table on Japan - Market size and forecast 2024-2029 ($ million)
- Exhibits103: Chart on Japan - Year-over-year growth 2024-2029 (%)
- Exhibits104: Data Table on Japan - Year-over-year growth 2024-2029 (%)
- Exhibits105: Chart on Germany - Market size and forecast 2024-2029 ($ million)
- Exhibits106: Data Table on Germany - Market size and forecast 2024-2029 ($ million)
- Exhibits107: Chart on Germany - Year-over-year growth 2024-2029 (%)
- Exhibits108: Data Table on Germany - Year-over-year growth 2024-2029 (%)
- Exhibits109: Chart on France - Market size and forecast 2024-2029 ($ million)
- Exhibits110: Data Table on France - Market size and forecast 2024-2029 ($ million)
- Exhibits111: Chart on France - Year-over-year growth 2024-2029 (%)
- Exhibits112: Data Table on France - Year-over-year growth 2024-2029 (%)
- Exhibits113: Chart on UK - Market size and forecast 2024-2029 ($ million)
- Exhibits114: Data Table on UK - Market size and forecast 2024-2029 ($ million)
- Exhibits115: Chart on UK - Year-over-year growth 2024-2029 (%)
- Exhibits116: Data Table on UK - Year-over-year growth 2024-2029 (%)
- Exhibits117: Chart on Australia - Market size and forecast 2024-2029 ($ million)
- Exhibits118: Data Table on Australia - Market size and forecast 2024-2029 ($ million)
- Exhibits119: Chart on Australia - Year-over-year growth 2024-2029 (%)
- Exhibits120: Data Table on Australia - Year-over-year growth 2024-2029 (%)
- Exhibits121: Chart on Canada - Market size and forecast 2024-2029 ($ million)
- Exhibits122: Data Table on Canada - Market size and forecast 2024-2029 ($ million)
- Exhibits123: Chart on Canada - Year-over-year growth 2024-2029 (%)
- Exhibits124: Data Table on Canada - Year-over-year growth 2024-2029 (%)
- Exhibits125: Chart on South Korea - Market size and forecast 2024-2029 ($ million)
- Exhibits126: Data Table on South Korea - Market size and forecast 2024-2029 ($ million)
- Exhibits127: Chart on South Korea - Year-over-year growth 2024-2029 (%)
- Exhibits128: Data Table on South Korea - Year-over-year growth 2024-2029 (%)
- Exhibits129: Chart on The Netherlands - Market size and forecast 2024-2029 ($ million)
- Exhibits130: Data Table on The Netherlands - Market size and forecast 2024-2029 ($ million)
- Exhibits131: Chart on The Netherlands - Year-over-year growth 2024-2029 (%)
- Exhibits132: Data Table on The Netherlands - Year-over-year growth 2024-2029 (%)
- Exhibits133: Market opportunity By Geographical Landscape ($ million)
- Exhibits134: Data Tables on Market opportunity By Geographical Landscape ($ million)
- Exhibits135: Impact of drivers and challenges in 2024 and 2029
- Exhibits136: Overview on criticality of inputs and factors of differentiation
- Exhibits137: Overview on factors of disruption
- Exhibits138: Impact of key risks on business
- Exhibits139: Companies covered
- Exhibits140: Company ranking index
- Exhibits141: Matrix on companies position and classification
- Exhibits142: A and A Dukaan Financial Services Pvt. Ltd. - Overview
- Exhibits143: A and A Dukaan Financial Services Pvt. Ltd. - Product / Service
- Exhibits144: A and A Dukaan Financial Services Pvt. Ltd. - Key offerings
- Exhibits145: SWOT
- Exhibits146: ABC Finance Ltd. - Overview
- Exhibits147: ABC Finance Ltd. - Product / Service
- Exhibits148: ABC Finance Ltd. - Key offerings
- Exhibits149: SWOT
- Exhibits150: Bank of America Corp. - Overview
- Exhibits151: Bank of America Corp. - Business segments
- Exhibits152: Bank of America Corp. - Key news
- Exhibits153: Bank of America Corp. - Key offerings
- Exhibits154: Bank of America Corp. - Segment focus
- Exhibits155: SWOT
- Exhibits156: City Holding Company - Overview
- Exhibits157: City Holding Company - Product / Service
- Exhibits158: City Holding Company - Key offerings
- Exhibits159: SWOT
- Exhibits160: JPMorgan Chase and Co. - Overview
- Exhibits161: JPMorgan Chase and Co. - Business segments
- Exhibits162: JPMorgan Chase and Co. - Key news
- Exhibits163: JPMorgan Chase and Co. - Key offerings
- Exhibits164: JPMorgan Chase and Co. - Segment focus
- Exhibits165: SWOT
- Exhibits166: Morgan Stanley - Overview
- Exhibits167: Morgan Stanley - Business segments
- Exhibits168: Morgan Stanley - Key offerings
- Exhibits169: Morgan Stanley - Segment focus
- Exhibits170: SWOT
- Exhibits171: Navy Federal Credit Union - Overview
- Exhibits172: Navy Federal Credit Union - Product / Service
- Exhibits173: Navy Federal Credit Union - Key offerings
- Exhibits174: SWOT
- Exhibits175: nbkc bank - Overview
- Exhibits176: nbkc bank - Product / Service
- Exhibits177: nbkc bank - Key offerings
- Exhibits178: SWOT
- Exhibits179: Pentagon Federal Credit Union - Overview
- Exhibits180: Pentagon Federal Credit Union - Product / Service
- Exhibits181: Pentagon Federal Credit Union - Key offerings
- Exhibits182: SWOT
- Exhibits183: Regions Financial Corp. - Overview
- Exhibits184: Regions Financial Corp. - Business segments
- Exhibits185: Regions Financial Corp. - Key news
- Exhibits186: Regions Financial Corp. - Key offerings
- Exhibits187: Regions Financial Corp. - Segment focus
- Exhibits188: SWOT
- Exhibits189: State Bank of India - Overview
- Exhibits190: State Bank of India - Business segments
- Exhibits191: State Bank of India - Key offerings
- Exhibits192: State Bank of India - Segment focus
- Exhibits193: SWOT
- Exhibits194: The Goldman Sachs Group Inc. - Overview
- Exhibits195: The Goldman Sachs Group Inc. - Business segments
- Exhibits196: The Goldman Sachs Group Inc. - Key news
- Exhibits197: The Goldman Sachs Group Inc. - Key offerings
- Exhibits198: The Goldman Sachs Group Inc. - Segment focus
- Exhibits199: SWOT
- Exhibits200: THE PNC FINANCIAL SERVICES GROUP INC. - Overview
- Exhibits201: THE PNC FINANCIAL SERVICES GROUP INC. - Business segments
- Exhibits202: THE PNC FINANCIAL SERVICES GROUP INC. - Key offerings
- Exhibits203: THE PNC FINANCIAL SERVICES GROUP INC. - Segment focus
- Exhibits204: SWOT
- Exhibits205: U.S. Bancorp - Overview
- Exhibits206: U.S. Bancorp - Business segments
- Exhibits207: U.S. Bancorp - Key offerings
- Exhibits208: U.S. Bancorp - Segment focus
- Exhibits209: SWOT
- Exhibits210: Wells Fargo and Co. - Overview
- Exhibits211: Wells Fargo and Co. - Business segments
- Exhibits212: Wells Fargo and Co. - Key offerings
- Exhibits213: Wells Fargo and Co. - Segment focus
- Exhibits214: SWOT
- Exhibits215: Inclusions checklist
- Exhibits216: Exclusions checklist
- Exhibits217: Currency conversion rates for US$
- Exhibits218: Research methodology
- Exhibits219: Information sources
- Exhibits220: Data validation
- Exhibits221: Validation techniques employed for market sizing
- Exhibits222: Data synthesis
- Exhibits223: 360 degree market analysis
- Exhibits224: List of abbreviations
The home equity lending market is forecasted to grow by USD 48155.3 mn during 2024-2029, accelerating at a CAGR of 4.7% during the forecast period. The report on the home equity lending market provides a holistic analysis, market size and forecast, trends, growth drivers, and challenges, as well as vendor analysis covering around 25 vendors.
The report offers an up-to-date analysis regarding the current market scenario, the latest trends and drivers, and the overall market environment. The market is driven by massive increase in home prices, benefits of home equity loan, and tax deductions for interest payments.
| Market Scope | |
|---|---|
| Base Year | 2025 |
| End Year | 2029 |
| Series Year | 2025-2029 |
| Growth Momentum | Accelerate |
| YOY 2025 | 4.3% |
| CAGR | 4.7% |
| Incremental Value | $48155.3 mn |
Technavio's home equity lending market is segmented as below:
By Source
- Mortgage and credit union
- Commercial banks
- Others
By Distribution Channel
- Offline
- Online
By Geographical Landscape
- North America
- Europe
- APAC
- South America
- Middle East and Africa
This study identifies the increase in residential properties as one of the prime reasons driving the home equity lending market growth during the next few years. Also, lower interest payments when compared to other borrowing methods and technological advancements in home equity borrowing process will lead to sizable demand in the market.
The report on the home equity lending market covers the following areas:
- Home Equity Lending Market sizing
- Home Equity Lending Market forecast
- Home Equity Lending Market industry analysis
The robust vendor analysis is designed to help clients improve their market position, and in line with this, this report provides a detailed analysis of several leading home equity lending market vendors that include A and A Dukaan Financial Services Pvt. Ltd., ABC Finance Ltd., Australia and New Zealand Banking Group Ltd., Bank of America Corp., Barclays PLC, City Holding Company, Commonwealth Bank of Australia, HSBC Holdings PLC, JPMorgan Chase and Co., Morgan Stanley, Navy Federal Credit Union, nbkc bank, Pentagon Federal Credit Union, Police and Nurses Ltd., Regions Financial Corp., State Bank of India, The Goldman Sachs Group Inc., THE PNC FINANCIAL SERVICES GROUP INC., U.S. Bancorp, and Wells Fargo and Co.. Also, the home equity lending market analysis report includes information on upcoming trends and challenges that will influence market growth. This is to help companies strategize and leverage all forthcoming growth opportunities.
The study was conducted using an objective combination of primary and secondary information including inputs from key participants in the industry. The report contains a comprehensive market and vendor landscape in addition to an analysis of the key vendors.
The publisher presents a detailed picture of the market by the way of study, synthesis, and summation of data from multiple sources by an analysis of key parameters such as profit, pricing, competition, and promotions. It presents various market facets by identifying the key industry influencers. The data presented is comprehensive, reliable, and a result of extensive primary and secondary research. The market research reports provide a complete competitive landscape and an in-depth vendor selection methodology and analysis using qualitative and quantitative research to forecast accurate market growth.
Table of Contents
1 Executive Summary
- 1.1 Market overview
- Executive Summary - Chart on Market Overview
- Executive Summary - Data Table on Market Overview
- Executive Summary - Chart on Global Market Characteristics
- Executive Summary - Chart on Market By Geographical Landscape
- Executive Summary - Chart on Market Segmentation by Source
- Executive Summary - Chart on Market Segmentation by Distribution Channel
- Executive Summary - Chart on Incremental Growth
- Executive Summary - Data Table on Incremental Growth
- Executive Summary - Chart on Company Market Positioning
2 Technavio Analysis
- 2.1 Analysis of price sensitivity, lifecycle, customer purchase basket, adoption rates, and purchase criteria
- Analysis of price sensitivity, lifecycle, customer purchase basket, adoption rates, and purchase criteria
- 2.2 Criticality of inputs and Factors of differentiation
- Overview on criticality of inputs and factors of differentiation
- 2.3 Factors of disruption
- Overview on factors of disruption
- 2.4 Impact of drivers and challenges
- Impact of drivers and challenges in 2024 and 2029
3 Market Landscape
- 3.1 Market ecosystem
- Parent Market
- Data Table on - Parent Market
- 3.2 Market characteristics
- Market characteristics analysis
- 3.3 Value chain analysis
- Value chain analysis
4 Market Sizing
- 4.1 Market definition
- Offerings of companies included in the market definition
- 4.2 Market segment analysis
- Market segments
- 4.3 Market size 2024
- 4.4 Market outlook: Forecast for 2024-2029
- Chart on Global - Market size and forecast 2024-2029 ($ million)
- Data Table on Global - Market size and forecast 2024-2029 ($ million)
- Chart on Global Market: Year-over-year growth 2024-2029 (%)
- Data Table on Global Market: Year-over-year growth 2024-2029 (%)
5 Historic Market Size
- 5.1 Global Home Equity Lending Market 2019 - 2023
- Historic Market Size - Data Table on Global Home Equity Lending Market 2019 - 2023 ($ million)
- 5.2 Source segment analysis 2019 - 2023
- Historic Market Size - Source Segment 2019 - 2023 ($ million)
- 5.3 Distribution Channel segment analysis 2019 - 2023
- Historic Market Size - Distribution Channel Segment 2019 - 2023 ($ million)
- 5.4 Geography segment analysis 2019 - 2023
- Historic Market Size - Geography Segment 2019 - 2023 ($ million)
- 5.5 Country segment analysis 2019 - 2023
- Historic Market Size - Country Segment 2019 - 2023 ($ million)
6 Qualitative Analysis
- 6.1 The AI impact on Global Home Equity Lending Market
7 Five Forces Analysis
- 7.1 Five forces summary
- Five forces analysis - Comparison between 2024 and 2029
- 7.2 Bargaining power of buyers
- Bargaining power of buyers - Impact of key factors 2024 and 2029
- 7.3 Bargaining power of suppliers
- Bargaining power of suppliers - Impact of key factors in 2024 and 2029
- 7.4 Threat of new entrants
- Threat of new entrants - Impact of key factors in 2024 and 2029
- 7.5 Threat of substitutes
- Threat of substitutes - Impact of key factors in 2024 and 2029
- 7.6 Threat of rivalry
- Threat of rivalry - Impact of key factors in 2024 and 2029
- 7.7 Market condition
- Chart on Market condition - Five forces 2024 and 2029
8 Market Segmentation by Source
- 8.1 Market segments
- Chart on Source - Market share 2024-2029 (%)
- Data Table on Source - Market share 2024-2029 (%)
- 8.2 Comparison by Source
- Chart on Comparison by Source
- Data Table on Comparison by Source
- 8.3 Mortgage and credit union - Market size and forecast 2024-2029
- Chart on Mortgage and credit union - Market size and forecast 2024-2029 ($ million)
- Data Table on Mortgage and credit union - Market size and forecast 2024-2029 ($ million)
- Chart on Mortgage and credit union - Year-over-year growth 2024-2029 (%)
- Data Table on Mortgage and credit union - Year-over-year growth 2024-2029 (%)
- 8.4 Commercial banks - Market size and forecast 2024-2029
- Chart on Commercial banks - Market size and forecast 2024-2029 ($ million)
- Data Table on Commercial banks - Market size and forecast 2024-2029 ($ million)
- Chart on Commercial banks - Year-over-year growth 2024-2029 (%)
- Data Table on Commercial banks - Year-over-year growth 2024-2029 (%)
- 8.5 Others - Market size and forecast 2024-2029
- Chart on Others - Market size and forecast 2024-2029 ($ million)
- Data Table on Others - Market size and forecast 2024-2029 ($ million)
- Chart on Others - Year-over-year growth 2024-2029 (%)
- Data Table on Others - Year-over-year growth 2024-2029 (%)
- 8.6 Market opportunity by Source
- Market opportunity by Source ($ million)
- Data Table on Market opportunity by Source ($ million)
9 Market Segmentation by Distribution Channel
- 9.1 Market segments
- Chart on Distribution Channel - Market share 2024-2029 (%)
- Data Table on Distribution Channel - Market share 2024-2029 (%)
- 9.2 Comparison by Distribution Channel
- Chart on Comparison by Distribution Channel
- Data Table on Comparison by Distribution Channel
- 9.3 Offline - Market size and forecast 2024-2029
- Chart on Offline - Market size and forecast 2024-2029 ($ million)
- Data Table on Offline - Market size and forecast 2024-2029 ($ million)
- Chart on Offline - Year-over-year growth 2024-2029 (%)
- Data Table on Offline - Year-over-year growth 2024-2029 (%)
- 9.4 Online - Market size and forecast 2024-2029
- Chart on Online - Market size and forecast 2024-2029 ($ million)
- Data Table on Online - Market size and forecast 2024-2029 ($ million)
- Chart on Online - Year-over-year growth 2024-2029 (%)
- Data Table on Online - Year-over-year growth 2024-2029 (%)
- 9.5 Market opportunity by Distribution Channel
- Market opportunity by Distribution Channel ($ million)
- Data Table on Market opportunity by Distribution Channel ($ million)
10 Customer Landscape
- 10.1 Customer landscape overview
- Analysis of price sensitivity, lifecycle, customer purchase basket, adoption rates, and purchase criteria
11 Geographic Landscape
- 11.1 Geographic segmentation
- Chart on Market share By Geographical Landscape 2024-2029 (%)
- Data Table on Market share By Geographical Landscape 2024-2029 (%)
- 11.2 Geographic comparison
- Chart on Geographic comparison
- Data Table on Geographic comparison
- 11.3 North America - Market size and forecast 2024-2029
- Chart on North America - Market size and forecast 2024-2029 ($ million)
- Data Table on North America - Market size and forecast 2024-2029 ($ million)
- Chart on North America - Year-over-year growth 2024-2029 (%)
- Data Table on North America - Year-over-year growth 2024-2029 (%)
- 11.4 Europe - Market size and forecast 2024-2029
- Chart on Europe - Market size and forecast 2024-2029 ($ million)
- Data Table on Europe - Market size and forecast 2024-2029 ($ million)
- Chart on Europe - Year-over-year growth 2024-2029 (%)
- Data Table on Europe - Year-over-year growth 2024-2029 (%)
- 11.5 APAC - Market size and forecast 2024-2029
- Chart on APAC - Market size and forecast 2024-2029 ($ million)
- Data Table on APAC - Market size and forecast 2024-2029 ($ million)
- Chart on APAC - Year-over-year growth 2024-2029 (%)
- Data Table on APAC - Year-over-year growth 2024-2029 (%)
- 11.6 South America - Market size and forecast 2024-2029
- Chart on South America - Market size and forecast 2024-2029 ($ million)
- Data Table on South America - Market size and forecast 2024-2029 ($ million)
- Chart on South America - Year-over-year growth 2024-2029 (%)
- Data Table on South America - Year-over-year growth 2024-2029 (%)
- 11.7 Middle East and Africa - Market size and forecast 2024-2029
- Chart on Middle East and Africa - Market size and forecast 2024-2029 ($ million)
- Data Table on Middle East and Africa - Market size and forecast 2024-2029 ($ million)
- Chart on Middle East and Africa - Year-over-year growth 2024-2029 (%)
- Data Table on Middle East and Africa - Year-over-year growth 2024-2029 (%)
- 11.8 US - Market size and forecast 2024-2029
- Chart on US - Market size and forecast 2024-2029 ($ million)
- Data Table on US - Market size and forecast 2024-2029 ($ million)
- Chart on US - Year-over-year growth 2024-2029 (%)
- Data Table on US - Year-over-year growth 2024-2029 (%)
- 11.9 China - Market size and forecast 2024-2029
- Chart on China - Market size and forecast 2024-2029 ($ million)
- Data Table on China - Market size and forecast 2024-2029 ($ million)
- Chart on China - Year-over-year growth 2024-2029 (%)
- Data Table on China - Year-over-year growth 2024-2029 (%)
- 11.10 Japan - Market size and forecast 2024-2029
- Chart on Japan - Market size and forecast 2024-2029 ($ million)
- Data Table on Japan - Market size and forecast 2024-2029 ($ million)
- Chart on Japan - Year-over-year growth 2024-2029 (%)
- Data Table on Japan - Year-over-year growth 2024-2029 (%)
- 11.11 Germany - Market size and forecast 2024-2029
- Chart on Germany - Market size and forecast 2024-2029 ($ million)
- Data Table on Germany - Market size and forecast 2024-2029 ($ million)
- Chart on Germany - Year-over-year growth 2024-2029 (%)
- Data Table on Germany - Year-over-year growth 2024-2029 (%)
- 11.12 France - Market size and forecast 2024-2029
- Chart on France - Market size and forecast 2024-2029 ($ million)
- Data Table on France - Market size and forecast 2024-2029 ($ million)
- Chart on France - Year-over-year growth 2024-2029 (%)
- Data Table on France - Year-over-year growth 2024-2029 (%)
- 11.13 UK - Market size and forecast 2024-2029
- Chart on UK - Market size and forecast 2024-2029 ($ million)
- Data Table on UK - Market size and forecast 2024-2029 ($ million)
- Chart on UK - Year-over-year growth 2024-2029 (%)
- Data Table on UK - Year-over-year growth 2024-2029 (%)
- 11.14 Australia - Market size and forecast 2024-2029
- Chart on Australia - Market size and forecast 2024-2029 ($ million)
- Data Table on Australia - Market size and forecast 2024-2029 ($ million)
- Chart on Australia - Year-over-year growth 2024-2029 (%)
- Data Table on Australia - Year-over-year growth 2024-2029 (%)
- 11.15 Canada - Market size and forecast 2024-2029
- Chart on Canada - Market size and forecast 2024-2029 ($ million)
- Data Table on Canada - Market size and forecast 2024-2029 ($ million)
- Chart on Canada - Year-over-year growth 2024-2029 (%)
- Data Table on Canada - Year-over-year growth 2024-2029 (%)
- 11.16 South Korea - Market size and forecast 2024-2029
- Chart on South Korea - Market size and forecast 2024-2029 ($ million)
- Data Table on South Korea - Market size and forecast 2024-2029 ($ million)
- Chart on South Korea - Year-over-year growth 2024-2029 (%)
- Data Table on South Korea - Year-over-year growth 2024-2029 (%)
- 11.17 The Netherlands - Market size and forecast 2024-2029
- Chart on The Netherlands - Market size and forecast 2024-2029 ($ million)
- Data Table on The Netherlands - Market size and forecast 2024-2029 ($ million)
- Chart on The Netherlands - Year-over-year growth 2024-2029 (%)
- Data Table on The Netherlands - Year-over-year growth 2024-2029 (%)
- 11.18 Market opportunity By Geographical Landscape
- Market opportunity By Geographical Landscape ($ million)
- Data Tables on Market opportunity By Geographical Landscape ($ million)
12 Drivers, Challenges, and Opportunity/Restraints
- 12.1 Market drivers
- 12.2 Market challenges
- 12.3 Impact of drivers and challenges
- Impact of drivers and challenges in 2024 and 2029
- 12.4 Market opportunities/restraints
13 Competitive Landscape
- 13.1 Overview
- 13.2 Competitive Landscape
- Overview on criticality of inputs and factors of differentiation
- 13.3 Landscape disruption
- Overview on factors of disruption
- 13.4 Industry risks
- Impact of key risks on business
14 Competitive Analysis
- 14.1 Companies profiled
- Companies covered
- 14.2 Company ranking index
- Company ranking index
- 14.3 Market positioning of companies
- Matrix on companies position and classification
- 14.4 A and A Dukaan Financial Services Pvt. Ltd.
- A and A Dukaan Financial Services Pvt. Ltd. - Overview
- A and A Dukaan Financial Services Pvt. Ltd. - Product / Service
- A and A Dukaan Financial Services Pvt. Ltd. - Key offerings
- SWOT
- 14.5 ABC Finance Ltd.
- ABC Finance Ltd. - Overview
- ABC Finance Ltd. - Product / Service
- ABC Finance Ltd. - Key offerings
- SWOT
- 14.6 Bank of America Corp.
- Bank of America Corp. - Overview
- Bank of America Corp. - Business segments
- Bank of America Corp. - Key news
- Bank of America Corp. - Key offerings
- Bank of America Corp. - Segment focus
- SWOT
- 14.7 City Holding Company
- City Holding Company - Overview
- City Holding Company - Product / Service
- City Holding Company - Key offerings
- SWOT
- 14.8 JPMorgan Chase and Co.
- JPMorgan Chase and Co. - Overview
- JPMorgan Chase and Co. - Business segments
- JPMorgan Chase and Co. - Key news
- JPMorgan Chase and Co. - Key offerings
- JPMorgan Chase and Co. - Segment focus
- SWOT
- 14.9 Morgan Stanley
- Morgan Stanley - Overview
- Morgan Stanley - Business segments
- Morgan Stanley - Key offerings
- Morgan Stanley - Segment focus
- SWOT
- 14.10 Navy Federal Credit Union
- Navy Federal Credit Union - Overview
- Navy Federal Credit Union - Product / Service
- Navy Federal Credit Union - Key offerings
- SWOT
- 14.11 nbkc bank
- nbkc bank - Overview
- nbkc bank - Product / Service
- nbkc bank - Key offerings
- SWOT
- 14.12 Pentagon Federal Credit Union
- Pentagon Federal Credit Union - Overview
- Pentagon Federal Credit Union - Product / Service
- Pentagon Federal Credit Union - Key offerings
- SWOT
- 14.13 Regions Financial Corp.
- Regions Financial Corp. - Overview
- Regions Financial Corp. - Business segments
- Regions Financial Corp. - Key news
- Regions Financial Corp. - Key offerings
- Regions Financial Corp. - Segment focus
- SWOT
- 14.14 State Bank of India
- State Bank of India - Overview
- State Bank of India - Business segments
- State Bank of India - Key offerings
- State Bank of India - Segment focus
- SWOT
- 14.15 The Goldman Sachs Group Inc.
- The Goldman Sachs Group Inc. - Overview
- The Goldman Sachs Group Inc. - Business segments
- The Goldman Sachs Group Inc. - Key news
- The Goldman Sachs Group Inc. - Key offerings
- The Goldman Sachs Group Inc. - Segment focus
- SWOT
- 14.16 THE PNC FINANCIAL SERVICES GROUP INC.
- THE PNC FINANCIAL SERVICES GROUP INC. - Overview
- THE PNC FINANCIAL SERVICES GROUP INC. - Business segments
- THE PNC FINANCIAL SERVICES GROUP INC. - Key offerings
- THE PNC FINANCIAL SERVICES GROUP INC. - Segment focus
- SWOT
- 14.17 U.S. Bancorp
- U.S. Bancorp - Overview
- U.S. Bancorp - Business segments
- U.S. Bancorp - Key offerings
- U.S. Bancorp - Segment focus
- SWOT
- 14.18 Wells Fargo and Co.
- Wells Fargo and Co. - Overview
- Wells Fargo and Co. - Business segments
- Wells Fargo and Co. - Key offerings
- Wells Fargo and Co. - Segment focus
- SWOT
15 Appendix
- 15.1 Scope of the report
- 15.2 Inclusions and exclusions checklist
- Inclusions checklist
- Exclusions checklist
- 15.3 Currency conversion rates for US$
- Currency conversion rates for US$
- 15.4 Research methodology
- Research methodology
- 15.5 Data procurement
- Information sources
- 15.6 Data validation
- Data validation
- 15.7 Validation techniques employed for market sizing
- Validation techniques employed for market sizing
- 15.8 Data synthesis
- Data synthesis
- 15.9 360 degree market analysis
- 360 degree market analysis
- 15.10 List of abbreviations
- List of abbreviations

