|
|
市場調査レポート
商品コード
1627039
臓器保存の世界市場、2024~2028年Global Organ Preservation Market 2024-2028 |
||||||
|
|||||||
カスタマイズ可能
|
|||||||


| 臓器保存の世界市場、2024~2028年 |
|
出版日: 2024年07月31日
発行: TechNavio
ページ情報: 英文 152 Pages
納期: 即納可能
|

全表示
- 概要
- 図表
- 目次
臓器保存市場、2024~2028年
臓器保存市場は2023~2028年に1億1,140万米ドル、予測期間中のCAGRは6.79%で成長すると予測されます。当レポートでは、臓器保存市場の全体的な分析、市場規模・予測、動向、成長促進要因、課題、約25のベンダーを網羅したベンダー分析などを掲載しています。
現在の市場シナリオ、最新動向と促進要因、市場環境全体に関する最新分析を提供しています。臓器移植の需要拡大、保存技術の進歩、臓器提供やドナープログラムに対する意識の高まりなどが市場を牽引しています。
| 市場範囲 | |
|---|---|
| 基準年 | 2024年 |
| 終了年 | 2028年 |
| 予測期間 | 2024~2028年 |
| 成長モメンタム | 加速 |
| 前年比[2024年] | 6.25% |
| CAGR | 6.79% |
| 増分額 | 1億1,140万米ドル |
本調査では、今後数年間の臓器保存市場成長を促進する主要理由の1つとして、常温灌流システムの注目度が高まっていることを挙げています。また、機械学習とAIの統合、生体工学と3Dプリンティングの進歩は、市場の大きな需要につながります。
目次
第1章 エグゼクティブサマリー
- 市場概要
第2章 市場情勢
- 市場エコシステム
- 市場の特徴
- バリューチェーン分析
第3章 市場規模
- 市場の定義
- 市場セグメント分析
- 市場規模 2023年
- 市場の展望 2023~2028年
第4章 市場規模実績
- 臓器保存の世界市場 2018~2022年
- タイプ別セグメント分析 2018~2022年
- エンドユーザー別セグメント分析 2018~2022年
- 地域別セグメント分析 2018~2022年
- 国別セグメント分析 2018~2022年
第5章 ファイブフォース分析
- ファイブフォースの要約
- 買い手の交渉力
- 供給企業の交渉力
- 新規参入業者の脅威
- 代替品の脅威
- 競争の脅威
- 市況
第6章 市場セグメンテーション:タイプ別
- 市場セグメント
- 比較:タイプ別
- 生体臓器提供:市場規模と予測 2023~2028年
- 死体臓器提供:市場規模と予測 2023~2028年
- 市場機会:タイプ別
第7章 市場セグメンテーション:エンドユーザー別
- 市場セグメント
- 比較:エンドユーザー別
- 病院とクリニック:市場規模と予測 2023~2028年
- 臓器バンク:市場規模と予測 2023~2028年
- その他:市場規模と予測 2023~2028年
- 市場機会:エンドユーザー別
第8章 顧客情勢
- 顧客情勢概要
第9章 地域別情勢
- 地域別セグメンテーション
- 比較:地域別
- 北米:市場規模と予測 2023~2028年
- 欧州:市場規模と予測 2023~2028年
- アジア:市場規模と予測 2023~2028年
- その他:市場規模と予測 2023~2028年
- 米国:市場規模と予測 2023~2028年
- 中国:市場規模と予測 2023~2028年
- ドイツ:市場規模と予測 2023~2028年
- フランス:市場規模と予測 2023~2028年
- インド:市場規模と予測 2023~2028年
- 地域情勢による市場機会
第10章 促進要因・課題・機会・抑制要因
- 市場促進要因
- 市場課題
- 促進要因と課題の影響
- 市場機会・抑制要因
第11章 競合情勢
- 概要
- 競合情勢
- 混乱の状況
- 産業のリスク
第12章 競合分析
- 企業プロファイル
- 企業の市場ポジショニング
- Accord Healthcare Ltd.
- BioLife Solutions Inc.
- Bridge to Life Ltd.
- Carnamedica
- dr. Franz Koehler Chemie GmbH
- EBERS MEDICAL TECHNOLOGY SL
- Global Transplant Solutions
- Organ Recovery Systems Inc.
- Paragonix Technologies Inc.
- Preservation Solution Inc.
- SALF SpA
- TransMedics Inc.
- Waters Medical Systems LLC
- XVIVO Perfusion AB
第13章 付録
Exhibits:
- Exhibits1: Executive Summary - Chart on Market Overview
- Exhibits2: Executive Summary - Data Table on Market Overview
- Exhibits3: Executive Summary - Chart on Global Market Characteristics
- Exhibits4: Executive Summary - Chart on Market By Geographical Landscape
- Exhibits5: Executive Summary - Chart on Market Segmentation by Type
- Exhibits6: Executive Summary - Chart on Market Segmentation by End-user
- Exhibits7: Executive Summary - Chart on Incremental Growth
- Exhibits8: Executive Summary - Data Table on Incremental Growth
- Exhibits9: Executive Summary - Chart on Company Market Positioning
- Exhibits10: Parent Market
- Exhibits11: Data Table on - Parent Market
- Exhibits12: Market characteristics analysis
- Exhibits13: Value Chain Analysis
- Exhibits14: Offerings of companies included in the market definition
- Exhibits15: Market segments
- Exhibits16: Chart on Global - Market size and forecast 2023-2028 ($ million)
- Exhibits17: Data Table on Global - Market size and forecast 2023-2028 ($ million)
- Exhibits18: Chart on Global Market: Year-over-year growth 2023-2028 (%)
- Exhibits19: Data Table on Global Market: Year-over-year growth 2023-2028 (%)
- Exhibits20: Historic Market Size - Data Table on Global Organ Preservation Market 2018 - 2022 ($ million)
- Exhibits21: Historic Market Size - Type Segment 2018 - 2022 ($ million)
- Exhibits22: Historic Market Size - End-user Segment 2018 - 2022 ($ million)
- Exhibits23: Historic Market Size - Geography Segment 2018 - 2022 ($ million)
- Exhibits24: Historic Market Size - Country Segment 2018 - 2022 ($ million)
- Exhibits25: Five forces analysis - Comparison between 2023 and 2028
- Exhibits26: Bargaining power of buyers - Impact of key factors 2023 and 2028
- Exhibits27: Bargaining power of suppliers - Impact of key factors in 2023 and 2028
- Exhibits28: Threat of new entrants - Impact of key factors in 2023 and 2028
- Exhibits29: Threat of substitutes - Impact of key factors in 2023 and 2028
- Exhibits30: Threat of rivalry - Impact of key factors in 2023 and 2028
- Exhibits31: Chart on Market condition - Five forces 2023 and 2028
- Exhibits32: Chart on Type - Market share 2023-2028 (%)
- Exhibits33: Data Table on Type - Market share 2023-2028 (%)
- Exhibits34: Chart on Comparison by Type
- Exhibits35: Data Table on Comparison by Type
- Exhibits36: Chart on Living organ donation - Market size and forecast 2023-2028 ($ million)
- Exhibits37: Data Table on Living organ donation - Market size and forecast 2023-2028 ($ million)
- Exhibits38: Chart on Living organ donation - Year-over-year growth 2023-2028 (%)
- Exhibits39: Data Table on Living organ donation - Year-over-year growth 2023-2028 (%)
- Exhibits40: Chart on Deceased organ donation - Market size and forecast 2023-2028 ($ million)
- Exhibits41: Data Table on Deceased organ donation - Market size and forecast 2023-2028 ($ million)
- Exhibits42: Chart on Deceased organ donation - Year-over-year growth 2023-2028 (%)
- Exhibits43: Data Table on Deceased organ donation - Year-over-year growth 2023-2028 (%)
- Exhibits44: Market opportunity by Type ($ million)
- Exhibits45: Data Table on Market opportunity by Type ($ million)
- Exhibits46: Chart on End-user - Market share 2023-2028 (%)
- Exhibits47: Data Table on End-user - Market share 2023-2028 (%)
- Exhibits48: Chart on Comparison by End-user
- Exhibits49: Data Table on Comparison by End-user
- Exhibits50: Chart on Hospitals and clinics - Market size and forecast 2023-2028 ($ million)
- Exhibits51: Data Table on Hospitals and clinics - Market size and forecast 2023-2028 ($ million)
- Exhibits52: Chart on Hospitals and clinics - Year-over-year growth 2023-2028 (%)
- Exhibits53: Data Table on Hospitals and clinics - Year-over-year growth 2023-2028 (%)
- Exhibits54: Chart on Organ banks - Market size and forecast 2023-2028 ($ million)
- Exhibits55: Data Table on Organ banks - Market size and forecast 2023-2028 ($ million)
- Exhibits56: Chart on Organ banks - Year-over-year growth 2023-2028 (%)
- Exhibits57: Data Table on Organ banks - Year-over-year growth 2023-2028 (%)
- Exhibits58: Chart on Others - Market size and forecast 2023-2028 ($ million)
- Exhibits59: Data Table on Others - Market size and forecast 2023-2028 ($ million)
- Exhibits60: Chart on Others - Year-over-year growth 2023-2028 (%)
- Exhibits61: Data Table on Others - Year-over-year growth 2023-2028 (%)
- Exhibits62: Market opportunity by End-user ($ million)
- Exhibits63: Data Table on Market opportunity by End-user ($ million)
- Exhibits64: Analysis of price sensitivity, lifecycle, customer purchase basket, adoption rates, and purchase criteria
- Exhibits65: Chart on Market share By Geographical Landscape 2023-2028 (%)
- Exhibits66: Data Table on Market share By Geographical Landscape 2023-2028 (%)
- Exhibits67: Chart on Geographic comparison
- Exhibits68: Data Table on Geographic comparison
- Exhibits69: Chart on North America - Market size and forecast 2023-2028 ($ million)
- Exhibits70: Data Table on North America - Market size and forecast 2023-2028 ($ million)
- Exhibits71: Chart on North America - Year-over-year growth 2023-2028 (%)
- Exhibits72: Data Table on North America - Year-over-year growth 2023-2028 (%)
- Exhibits73: Chart on Europe - Market size and forecast 2023-2028 ($ million)
- Exhibits74: Data Table on Europe - Market size and forecast 2023-2028 ($ million)
- Exhibits75: Chart on Europe - Year-over-year growth 2023-2028 (%)
- Exhibits76: Data Table on Europe - Year-over-year growth 2023-2028 (%)
- Exhibits77: Chart on Asia - Market size and forecast 2023-2028 ($ million)
- Exhibits78: Data Table on Asia - Market size and forecast 2023-2028 ($ million)
- Exhibits79: Chart on Asia - Year-over-year growth 2023-2028 (%)
- Exhibits80: Data Table on Asia - Year-over-year growth 2023-2028 (%)
- Exhibits81: Chart on Rest of World (ROW) - Market size and forecast 2023-2028 ($ million)
- Exhibits82: Data Table on Rest of World (ROW) - Market size and forecast 2023-2028 ($ million)
- Exhibits83: Chart on Rest of World (ROW) - Year-over-year growth 2023-2028 (%)
- Exhibits84: Data Table on Rest of World (ROW) - Year-over-year growth 2023-2028 (%)
- Exhibits85: Chart on US - Market size and forecast 2023-2028 ($ million)
- Exhibits86: Data Table on US - Market size and forecast 2023-2028 ($ million)
- Exhibits87: Chart on US - Year-over-year growth 2023-2028 (%)
- Exhibits88: Data Table on US - Year-over-year growth 2023-2028 (%)
- Exhibits89: Chart on China - Market size and forecast 2023-2028 ($ million)
- Exhibits90: Data Table on China - Market size and forecast 2023-2028 ($ million)
- Exhibits91: Chart on China - Year-over-year growth 2023-2028 (%)
- Exhibits92: Data Table on China - Year-over-year growth 2023-2028 (%)
- Exhibits93: Chart on Germany - Market size and forecast 2023-2028 ($ million)
- Exhibits94: Data Table on Germany - Market size and forecast 2023-2028 ($ million)
- Exhibits95: Chart on Germany - Year-over-year growth 2023-2028 (%)
- Exhibits96: Data Table on Germany - Year-over-year growth 2023-2028 (%)
- Exhibits97: Chart on France - Market size and forecast 2023-2028 ($ million)
- Exhibits98: Data Table on France - Market size and forecast 2023-2028 ($ million)
- Exhibits99: Chart on France - Year-over-year growth 2023-2028 (%)
- Exhibits100: Data Table on France - Year-over-year growth 2023-2028 (%)
- Exhibits101: Chart on India - Market size and forecast 2023-2028 ($ million)
- Exhibits102: Data Table on India - Market size and forecast 2023-2028 ($ million)
- Exhibits103: Chart on India - Year-over-year growth 2023-2028 (%)
- Exhibits104: Data Table on India - Year-over-year growth 2023-2028 (%)
- Exhibits105: Market opportunity By Geographical Landscape ($ million)
- Exhibits106: Data Tables on Market opportunity By Geographical Landscape ($ million)
- Exhibits107: Impact of drivers and challenges in 2023 and 2028
- Exhibits108: Overview on criticality of inputs and factors of differentiation
- Exhibits109: Overview on factors of disruption
- Exhibits110: Impact of key risks on business
- Exhibits111: Companies covered
- Exhibits112: Matrix on companies position and classification
- Exhibits113: 21st Century Medicine - Overview
- Exhibits114: 21st Century Medicine - Product / Service
- Exhibits115: 21st Century Medicine - Key offerings
- Exhibits116: Accord Healthcare Ltd. - Overview
- Exhibits117: Accord Healthcare Ltd. - Product / Service
- Exhibits118: Accord Healthcare Ltd. - Key offerings
- Exhibits119: BioLife Solutions Inc. - Overview
- Exhibits120: BioLife Solutions Inc. - Product / Service
- Exhibits121: BioLife Solutions Inc. - Key offerings
- Exhibits122: Bridge to Life Ltd. - Overview
- Exhibits123: Bridge to Life Ltd. - Product / Service
- Exhibits124: Bridge to Life Ltd. - Key offerings
- Exhibits125: Carnamedica - Overview
- Exhibits126: Carnamedica - Product / Service
- Exhibits127: Carnamedica - Key offerings
- Exhibits128: dr. Franz Koehler Chemie GmbH - Overview
- Exhibits129: dr. Franz Koehler Chemie GmbH - Product / Service
- Exhibits130: dr. Franz Koehler Chemie GmbH - Key offerings
- Exhibits131: EBERS MEDICAL TECHNOLOGY SL - Overview
- Exhibits132: EBERS MEDICAL TECHNOLOGY SL - Product / Service
- Exhibits133: EBERS MEDICAL TECHNOLOGY SL - Key offerings
- Exhibits134: Global Transplant Solutions - Overview
- Exhibits135: Global Transplant Solutions - Product / Service
- Exhibits136: Global Transplant Solutions - Key offerings
- Exhibits137: Organ Recovery Systems Inc. - Overview
- Exhibits138: Organ Recovery Systems Inc. - Product / Service
- Exhibits139: Organ Recovery Systems Inc. - Key offerings
- Exhibits140: Paragonix Technologies Inc. - Overview
- Exhibits141: Paragonix Technologies Inc. - Product / Service
- Exhibits142: Paragonix Technologies Inc. - Key offerings
- Exhibits143: Preservation Solution Inc. - Overview
- Exhibits144: Preservation Solution Inc. - Product / Service
- Exhibits145: Preservation Solution Inc. - Key offerings
- Exhibits146: SALF SpA - Overview
- Exhibits147: SALF SpA - Product / Service
- Exhibits148: SALF SpA - Key offerings
- Exhibits149: TransMedics Inc. - Overview
- Exhibits150: TransMedics Inc. - Product / Service
- Exhibits151: TransMedics Inc. - Key offerings
- Exhibits152: Waters Medical Systems LLC - Overview
- Exhibits153: Waters Medical Systems LLC - Product / Service
- Exhibits154: Waters Medical Systems LLC - Key offerings
- Exhibits155: XVIVO Perfusion AB - Overview
- Exhibits156: XVIVO Perfusion AB - Business segments
- Exhibits157: XVIVO Perfusion AB - Key offerings
- Exhibits158: XVIVO Perfusion AB - Segment focus
- Exhibits159: Inclusions checklist
- Exhibits160: Exclusions checklist
- Exhibits161: Currency conversion rates for US$
- Exhibits162: Research methodology
- Exhibits163: Information sources
- Exhibits164: Data validation
- Exhibits165: Validation techniques employed for market sizing
- Exhibits166: Data synthesis
- Exhibits167: 360 degree market analysis
- Exhibits168: List of abbreviations
Organ Preservation Market 2024-2028
The organ preservation market is forecasted to grow by USD 111.4 mn during 2023-2028, accelerating at a CAGR of 6.79% during the forecast period. The report on the organ preservation market provides a holistic analysis, market size and forecast, trends, growth drivers, and challenges, as well as vendor analysis covering around 25 vendors.
The report offers an up-to-date analysis regarding the current market scenario, the latest trends and drivers, and the overall market environment. The market is driven by growing demand for organ transplants, advancements in preservation techniques, and increasing awareness of organ donation and donor programs.
| Market Scope | |
|---|---|
| Base Year | 2024 |
| End Year | 2028 |
| Series Year | 2024-2028 |
| Growth Momentum | Accelerate |
| YOY 2024 | 6.25% |
| CAGR | 6.79% |
| Incremental Value | $111.4 mn |
Technavio's organ preservation market is segmented as below:
By Type
- Living organ donation
- Deceased organ donation
By End-user
- Hospitals and clinics
- Organ banks
- Others
By Geographical Landscape
- North America
- Europe
- Asia
- Rest of World (ROW)
This study identifies the increasing prominence of normothermic perfusion systems as one of the prime reasons driving the organ preservation market growth during the next few years. Also, integration of machine learning and AI and advances in bioengineering and 3D printing will lead to sizable demand in the market.
The report on the organ preservation market covers the following areas:
- Organ Preservation Market sizing
- Organ Preservation Market forecast
- Organ Preservation Market industry analysis
The robust vendor analysis is designed to help clients improve their market position, and in line with this, this report provides a detailed analysis of several leading organ preservation market vendors that include 21st Century Medicine, Accord Healthcare Ltd., Biochefa Pharmaceutical Research And Production Plant Ltd., BioLife Solutions Inc., Bridge to Life Ltd., Carnamedica, DR. Franz Koehler Chemie GmbH, EBERS MEDICAL TECHNOLOGY SL, Global Transplant Solutions, Organ Recovery Systems Inc., OrganOx Ltd., Paragonix Technologies Inc., Preservation Solution Inc., Revive Organtech Inc., SALF SpA, Stellantis NV, TransMedics Inc., TX Innovations, Waters Medical Systems LLC , and XVIVO Perfusion AB. Also, the organ preservation market analysis report includes information on upcoming trends and challenges that will influence market growth. This is to help companies strategize and leverage all forthcoming growth opportunities.
The study was conducted using an objective combination of primary and secondary information including inputs from key participants in the industry. The report contains a comprehensive market and vendor landscape in addition to an analysis of the key vendors.
The publisher presents a detailed picture of the market by the way of study, synthesis, and summation of data from multiple sources by an analysis of key parameters such as profit, pricing, competition, and promotions. It presents various market facets by identifying the key industry influencers. The data presented is comprehensive, reliable, and a result of extensive primary and secondary research. The market research reports provide a complete competitive landscape and an in-depth vendor selection methodology and analysis using qualitative and quantitative research to forecast accurate market growth.
Table of Contents
1 Executive Summary
- 1.1 Market overview
- Executive Summary - Chart on Market Overview
- Executive Summary - Data Table on Market Overview
- Executive Summary - Chart on Global Market Characteristics
- Executive Summary - Chart on Market By Geographical Landscape
- Executive Summary - Chart on Market Segmentation by Type
- Executive Summary - Chart on Market Segmentation by End-user
- Executive Summary - Chart on Incremental Growth
- Executive Summary - Data Table on Incremental Growth
- Executive Summary - Chart on Company Market Positioning
2 Market Landscape
- 2.1 Market ecosystem
- Parent Market
- Data Table on - Parent Market
- 2.2 Market characteristics
- Market characteristics analysis
- 2.3 Value chain analysis
- Value Chain Analysis
3 Market Sizing
- 3.1 Market definition
- Offerings of companies included in the market definition
- 3.2 Market segment analysis
- Market segments
- 3.3 Market size 2023
- 3.4 Market outlook: Forecast for 2023-2028
- Chart on Global - Market size and forecast 2023-2028 ($ million)
- Data Table on Global - Market size and forecast 2023-2028 ($ million)
- Chart on Global Market: Year-over-year growth 2023-2028 (%)
- Data Table on Global Market: Year-over-year growth 2023-2028 (%)
4 Historic Market Size
- 4.1 Global Organ Preservation Market 2018 - 2022
- Historic Market Size - Data Table on Global Organ Preservation Market 2018 - 2022 ($ million)
- 4.2 Type segment analysis 2018 - 2022
- Historic Market Size - Type Segment 2018 - 2022 ($ million)
- 4.3 End-user segment analysis 2018 - 2022
- Historic Market Size - End-user Segment 2018 - 2022 ($ million)
- 4.4 Geography segment analysis 2018 - 2022
- Historic Market Size - Geography Segment 2018 - 2022 ($ million)
- 4.5 Country segment analysis 2018 - 2022
- Historic Market Size - Country Segment 2018 - 2022 ($ million)
5 Five Forces Analysis
- 5.1 Five forces summary
- Five forces analysis - Comparison between 2023 and 2028
- 5.2 Bargaining power of buyers
- Bargaining power of buyers - Impact of key factors 2023 and 2028
- 5.3 Bargaining power of suppliers
- Bargaining power of suppliers - Impact of key factors in 2023 and 2028
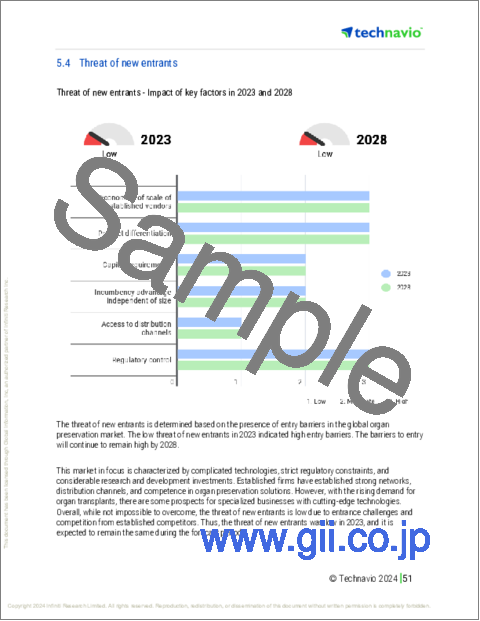
- 5.4 Threat of new entrants
- Threat of new entrants - Impact of key factors in 2023 and 2028
- 5.5 Threat of substitutes
- Threat of substitutes - Impact of key factors in 2023 and 2028
- 5.6 Threat of rivalry
- Threat of rivalry - Impact of key factors in 2023 and 2028
- 5.7 Market condition
- Chart on Market condition - Five forces 2023 and 2028
6 Market Segmentation by Type
- 6.1 Market segments
- Chart on Type - Market share 2023-2028 (%)
- Data Table on Type - Market share 2023-2028 (%)
- 6.2 Comparison by Type
- Chart on Comparison by Type
- Data Table on Comparison by Type
- 6.3 Living organ donation - Market size and forecast 2023-2028
- Chart on Living organ donation - Market size and forecast 2023-2028 ($ million)
- Data Table on Living organ donation - Market size and forecast 2023-2028 ($ million)
- Chart on Living organ donation - Year-over-year growth 2023-2028 (%)
- Data Table on Living organ donation - Year-over-year growth 2023-2028 (%)
- 6.4 Deceased organ donation - Market size and forecast 2023-2028
- Chart on Deceased organ donation - Market size and forecast 2023-2028 ($ million)
- Data Table on Deceased organ donation - Market size and forecast 2023-2028 ($ million)
- Chart on Deceased organ donation - Year-over-year growth 2023-2028 (%)
- Data Table on Deceased organ donation - Year-over-year growth 2023-2028 (%)
- 6.5 Market opportunity by Type
- Market opportunity by Type ($ million)
- Data Table on Market opportunity by Type ($ million)
7 Market Segmentation by End-user
- 7.1 Market segments
- Chart on End-user - Market share 2023-2028 (%)
- Data Table on End-user - Market share 2023-2028 (%)
- 7.2 Comparison by End-user
- Chart on Comparison by End-user
- Data Table on Comparison by End-user
- 7.3 Hospitals and clinics - Market size and forecast 2023-2028
- Chart on Hospitals and clinics - Market size and forecast 2023-2028 ($ million)
- Data Table on Hospitals and clinics - Market size and forecast 2023-2028 ($ million)
- Chart on Hospitals and clinics - Year-over-year growth 2023-2028 (%)
- Data Table on Hospitals and clinics - Year-over-year growth 2023-2028 (%)
- 7.4 Organ banks - Market size and forecast 2023-2028
- Chart on Organ banks - Market size and forecast 2023-2028 ($ million)
- Data Table on Organ banks - Market size and forecast 2023-2028 ($ million)
- Chart on Organ banks - Year-over-year growth 2023-2028 (%)
- Data Table on Organ banks - Year-over-year growth 2023-2028 (%)
- 7.5 Others - Market size and forecast 2023-2028
- Chart on Others - Market size and forecast 2023-2028 ($ million)
- Data Table on Others - Market size and forecast 2023-2028 ($ million)
- Chart on Others - Year-over-year growth 2023-2028 (%)
- Data Table on Others - Year-over-year growth 2023-2028 (%)
- 7.6 Market opportunity by End-user
- Market opportunity by End-user ($ million)
- Data Table on Market opportunity by End-user ($ million)
8 Customer Landscape
- 8.1 Customer landscape overview
- Analysis of price sensitivity, lifecycle, customer purchase basket, adoption rates, and purchase criteria
9 Geographic Landscape
- 9.1 Geographic segmentation
- Chart on Market share By Geographical Landscape 2023-2028 (%)
- Data Table on Market share By Geographical Landscape 2023-2028 (%)
- 9.2 Geographic comparison
- Chart on Geographic comparison
- Data Table on Geographic comparison
- 9.3 North America - Market size and forecast 2023-2028
- Chart on North America - Market size and forecast 2023-2028 ($ million)
- Data Table on North America - Market size and forecast 2023-2028 ($ million)
- Chart on North America - Year-over-year growth 2023-2028 (%)
- Data Table on North America - Year-over-year growth 2023-2028 (%)
- 9.4 Europe - Market size and forecast 2023-2028
- Chart on Europe - Market size and forecast 2023-2028 ($ million)
- Data Table on Europe - Market size and forecast 2023-2028 ($ million)
- Chart on Europe - Year-over-year growth 2023-2028 (%)
- Data Table on Europe - Year-over-year growth 2023-2028 (%)
- 9.5 Asia - Market size and forecast 2023-2028
- Chart on Asia - Market size and forecast 2023-2028 ($ million)
- Data Table on Asia - Market size and forecast 2023-2028 ($ million)
- Chart on Asia - Year-over-year growth 2023-2028 (%)
- Data Table on Asia - Year-over-year growth 2023-2028 (%)
- 9.6 Rest of World (ROW) - Market size and forecast 2023-2028
- Chart on Rest of World (ROW) - Market size and forecast 2023-2028 ($ million)
- Data Table on Rest of World (ROW) - Market size and forecast 2023-2028 ($ million)
- Chart on Rest of World (ROW) - Year-over-year growth 2023-2028 (%)
- Data Table on Rest of World (ROW) - Year-over-year growth 2023-2028 (%)
- 9.7 US - Market size and forecast 2023-2028
- Chart on US - Market size and forecast 2023-2028 ($ million)
- Data Table on US - Market size and forecast 2023-2028 ($ million)
- Chart on US - Year-over-year growth 2023-2028 (%)
- Data Table on US - Year-over-year growth 2023-2028 (%)
- 9.8 China - Market size and forecast 2023-2028
- Chart on China - Market size and forecast 2023-2028 ($ million)
- Data Table on China - Market size and forecast 2023-2028 ($ million)
- Chart on China - Year-over-year growth 2023-2028 (%)
- Data Table on China - Year-over-year growth 2023-2028 (%)
- 9.9 Germany - Market size and forecast 2023-2028
- Chart on Germany - Market size and forecast 2023-2028 ($ million)
- Data Table on Germany - Market size and forecast 2023-2028 ($ million)
- Chart on Germany - Year-over-year growth 2023-2028 (%)
- Data Table on Germany - Year-over-year growth 2023-2028 (%)
- 9.10 France - Market size and forecast 2023-2028
- Chart on France - Market size and forecast 2023-2028 ($ million)
- Data Table on France - Market size and forecast 2023-2028 ($ million)
- Chart on France - Year-over-year growth 2023-2028 (%)
- Data Table on France - Year-over-year growth 2023-2028 (%)
- 9.11 India - Market size and forecast 2023-2028
- Chart on India - Market size and forecast 2023-2028 ($ million)
- Data Table on India - Market size and forecast 2023-2028 ($ million)
- Chart on India - Year-over-year growth 2023-2028 (%)
- Data Table on India - Year-over-year growth 2023-2028 (%)
- 9.12 Market opportunity By Geographical Landscape
- Market opportunity By Geographical Landscape ($ million)
- Data Tables on Market opportunity By Geographical Landscape ($ million)
10 Drivers, Challenges, and Opportunity/Restraints
- 10.1 Market drivers
- 10.2 Market challenges
- 10.3 Impact of drivers and challenges
- Impact of drivers and challenges in 2023 and 2028
- 10.4 Market opportunities/restraints
11 Competitive Landscape
- 11.1 Overview
- 11.2 Competitive Landscape
- Overview on criticality of inputs and factors of differentiation
- 11.3 Landscape disruption
- Overview on factors of disruption
- 11.4 Industry risks
- Impact of key risks on business
12 Competitive Analysis
- 12.1 Companies profiled
- Companies covered
- 12.2 Market positioning of companies
- Matrix on companies position and classification
- 21st Century Medicine
- 21st Century Medicine - Overview
- 21st Century Medicine - Product / Service
- 21st Century Medicine - Key offerings
- 12.4 Accord Healthcare Ltd.
- Accord Healthcare Ltd. - Overview
- Accord Healthcare Ltd. - Product / Service
- Accord Healthcare Ltd. - Key offerings
- 12.5 BioLife Solutions Inc.
- BioLife Solutions Inc. - Overview
- BioLife Solutions Inc. - Product / Service
- BioLife Solutions Inc. - Key offerings
- 12.6 Bridge to Life Ltd.
- Bridge to Life Ltd. - Overview
- Bridge to Life Ltd. - Product / Service
- Bridge to Life Ltd. - Key offerings
- 12.7 Carnamedica
- Carnamedica - Overview
- Carnamedica - Product / Service
- Carnamedica - Key offerings
- 12.8 dr. Franz Koehler Chemie GmbH
- dr. Franz Koehler Chemie GmbH - Overview
- dr. Franz Koehler Chemie GmbH - Product / Service
- dr. Franz Koehler Chemie GmbH - Key offerings
- 12.9 EBERS MEDICAL TECHNOLOGY SL
- EBERS MEDICAL TECHNOLOGY SL - Overview
- EBERS MEDICAL TECHNOLOGY SL - Product / Service
- EBERS MEDICAL TECHNOLOGY SL - Key offerings
- 12.10 Global Transplant Solutions
- Global Transplant Solutions - Overview
- Global Transplant Solutions - Product / Service
- Global Transplant Solutions - Key offerings
- 12.11 Organ Recovery Systems Inc.
- Organ Recovery Systems Inc. - Overview
- Organ Recovery Systems Inc. - Product / Service
- Organ Recovery Systems Inc. - Key offerings
- 12.12 Paragonix Technologies Inc.
- Paragonix Technologies Inc. - Overview
- Paragonix Technologies Inc. - Product / Service
- Paragonix Technologies Inc. - Key offerings
- 12.13 Preservation Solution Inc.
- Preservation Solution Inc. - Overview
- Preservation Solution Inc. - Product / Service
- Preservation Solution Inc. - Key offerings
- 12.14 SALF SpA
- SALF SpA - Overview
- SALF SpA - Product / Service
- SALF SpA - Key offerings
- 12.15 TransMedics Inc.
- TransMedics Inc. - Overview
- TransMedics Inc. - Product / Service
- TransMedics Inc. - Key offerings
- 12.16 Waters Medical Systems LLC
- Waters Medical Systems LLC - Overview
- Waters Medical Systems LLC - Product / Service
- Waters Medical Systems LLC - Key offerings
- 12.17 XVIVO Perfusion AB
- XVIVO Perfusion AB - Overview
- XVIVO Perfusion AB - Business segments
- XVIVO Perfusion AB - Key offerings
- XVIVO Perfusion AB - Segment focus
13 Appendix
- 13.1 Scope of the report
- 13.2 Inclusions and exclusions checklist
- Inclusions checklist
- Exclusions checklist
- 13.3 Currency conversion rates for US$
- Currency conversion rates for US$
- 13.4 Research methodology
- Research methodology
- 13.5 Data procurement
- Information sources
- 13.6 Data validation
- Data validation
- 13.7 Validation techniques employed for market sizing
- Validation techniques employed for market sizing
- 13.8 Data synthesis
- Data synthesis
- 13.9 360 degree market analysis
- 360 degree market analysis
- 13.10 List of abbreviations
- List of abbreviations

