|
|
市場調査レポート
商品コード
1626800
ヘルシースナックの世界市場 2025-2029年Global Healthy Snack Market 2025-2029 |
||||||

|
|||||||
カスタマイズ可能
|
|||||||


| ヘルシースナックの世界市場 2025-2029年 |
|
出版日: 2024年12月18日
発行: TechNavio
ページ情報: 英文 213 Pages
納期: 即納可能
|

全表示
- 概要
- 図表
- 目次
ヘルシースナック市場 2025-2029年
ヘルシースナック市場は2024-2029年に2,700万米ドル、予測期間中のCAGRは5.1%で成長すると予測されます。当レポートでは、ヘルシースナック市場の全体的な分析、市場規模・予測、動向、成長促進要因、課題、約25のベンダーを網羅したベンダー分析などを掲載しています。
現在の市場シナリオ、最新動向と促進要因、市場環境全体に関する最新分析を提供しています。可処分所得の増加とライフスタイルの変化、味覚嗜好の進化、健康的なスナックへの志向の高まりが市場を牽引しています。
| 市場範囲 | |
|---|---|
| 基準年 | 2025 |
| 終了年 | 2029 |
| 予測期間 | 2025-2029 |
| 成長モメンタム | 加速 |
| 前年比2025年 | 4.9% |
| CAGR | 5.1% |
| 増分額 | 2,700万米ドル |
本調査では、オンライン小売の成長が今後数年間のヘルシースナック市場成長を牽引する主要因の1つであるとしています。また、食事をヘルシーなスナックに置き換える増加や、植物ベースの食生活の消費拡大も、市場の大きな需要につながります。
目次
第1章 エグゼクティブサマリー
- 市場概要
第2章 Technavio別分析
- 価格・ライフサイクル・顧客購入バスケット・採用率・購入基準の分析
- インプットの重要性と差別化の要因
- 混乱の要因
- 促進要因と課題の影響
第3章 市場情勢
- 市場エコシステム
- 市場の特徴
- バリューチェーン分析
第4章 市場規模
- 市場の定義
- 市場セグメント分析
- 市場規模 2024
- 市場の見通し 2024-2029
第5章 市場規模実績
- ヘルシースナックの世界市場 2019-2023
- 流通チャネル別セグメント分析 2019-2023
- 製品別セグメント分析 2019-2023
- 地域別セグメント分析 2019-2023
- 国別セグメント分析 2019-2023
第6章 定性分析
- AIの影響:ヘルシースナックの世界市場
第7章 ファイブフォース分析
- ファイブフォースの要約
- 買い手の交渉力
- 供給企業の交渉力
- 新規参入業者の脅威
- 代替品の脅威
- 競争の脅威
- 市況
第8章 市場セグメンテーション:流通チャネル別
- 市場セグメント
- 比較:流通チャネル別
- スーパーマーケットとハイパーマーケット:市場規模と予測 2024-2029
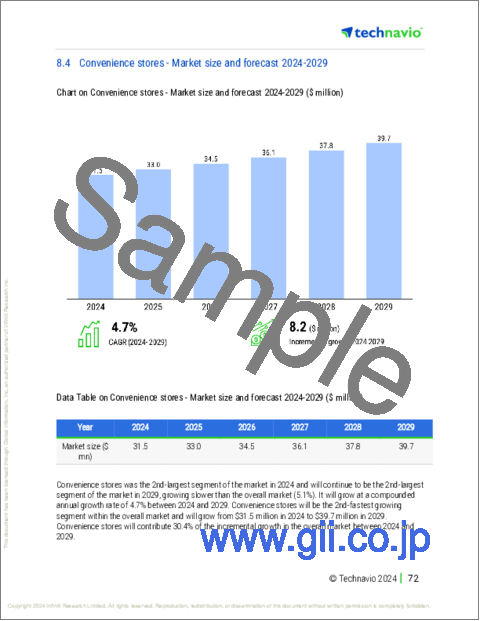
- コンビニエンスストア:市場規模と予測 2024-2029
- オンライン:市場規模と予測 2024-2029
- 市場機会:流通チャネル別
第9章 市場セグメンテーション:製品別
- 市場セグメント
- 比較:製品別
- 甘くない:市場規模と予測 2024-2029
- ベーカリー:市場規模と予測 2024-2029
- フルーツ:市場規模と予測 2024-2029
- 乳製品:市場規模と予測 2024-2029
- その他:市場規模と予測 2024-2029
- 市場機会:製品別
第10章 顧客情勢
- 顧客情勢の概要
第11章 地域別情勢
- 地域別セグメンテーション
- 地域別比較
- 北米:市場規模と予測 2024-2029
- 欧州:市場規模と予測 2024-2029
- アジア太平洋:市場規模と予測 2024-2029
- 南米:市場規模と予測 2024-2029
- 中東・アフリカ:市場規模と予測 2024-2029
- 米国:市場規模と予測 2024-2029
- 中国:市場規模と予測 2024-2029
- 英国:市場規模と予測 2024-2029
- ドイツ:市場規模と予測 2024-2029
- カナダ:市場規模と予測 2024-2029
- 日本:市場規模と予測 2024-2029
- インド:市場規模と予測 2024-2029
- 韓国:市場規模と予測 2024-2029
- フランス:市場規模と予測 2024-2029
- イタリア:市場規模と予測 2024-2029
- 市場機会:地域情勢別
第12章 促進要因・課題・機会・抑制要因
- 市場促進要因
- 市場の課題
- 促進要因と課題の影響
- 市場の機会・抑制要因
第13章 競合情勢
- 概要
- 競合情勢
- 混乱の状況
- 業界のリスク
第14章 競合分析
- 企業プロファイル
- 企業ランキング指数
- 企業の市場ポジショニング
- B and G Foods Inc.
- Calbee Inc.
- Danone SA
- Del Monte Foods Inc.
- Dole Packaged Foods LLC
- General Mills Inc.
- Hormel Foods Corp.
- Kellogg Co.
- LT Foods Ltd.
- Mondelez International Inc.
- Monsoon Harvest
- PepsiCo Inc.
- Select Harvests Ltd.
- Sun Maid Growers of California
- Tyson Foods Inc.
第15章 付録
Exhibits:
- Exhibits1: Executive Summary - Chart on Market Overview
- Exhibits2: Executive Summary - Data Table on Market Overview
- Exhibits3: Executive Summary - Chart on Global Market Characteristics
- Exhibits4: Executive Summary - Chart on Market By Geographical Landscape
- Exhibits5: Executive Summary - Chart on Market Segmentation by Distribution Channel
- Exhibits6: Executive Summary - Chart on Market Segmentation by Product
- Exhibits7: Executive Summary - Chart on Incremental Growth
- Exhibits8: Executive Summary - Data Table on Incremental Growth
- Exhibits9: Executive Summary - Chart on Company Market Positioning
- Exhibits10: Analysis of price sensitivity, lifecycle, customer purchase basket, adoption rates, and purchase criteria
- Exhibits11: Overview on criticality of inputs and factors of differentiation
- Exhibits12: Overview on factors of disruption
- Exhibits13: Impact of drivers and challenges in 2024 and 2029
- Exhibits14: Parent Market
- Exhibits15: Data Table on - Parent Market
- Exhibits16: Market characteristics analysis
- Exhibits17: Value chain analysis
- Exhibits18: Offerings of companies included in the market definition
- Exhibits19: Market segments
- Exhibits20: Chart on Global - Market size and forecast 2024-2029 ($ million)
- Exhibits21: Data Table on Global - Market size and forecast 2024-2029 ($ million)
- Exhibits22: Chart on Global Market: Year-over-year growth 2024-2029 (%)
- Exhibits23: Data Table on Global Market: Year-over-year growth 2024-2029 (%)
- Exhibits24: Historic Market Size - Data Table on Global Healthy Snack Market 2019 - 2023 ($ million)
- Exhibits25: Historic Market Size - Distribution Channel Segment 2019 - 2023 ($ million)
- Exhibits26: Historic Market Size - Product Segment 2019 - 2023 ($ million)
- Exhibits27: Historic Market Size - Geography Segment 2019 - 2023 ($ million)
- Exhibits28: Historic Market Size - Country Segment 2019 - 2023 ($ million)
- Exhibits29: Five forces analysis - Comparison between 2024 and 2029
- Exhibits30: Bargaining power of buyers - Impact of key factors 2024 and 2029
- Exhibits31: Bargaining power of suppliers - Impact of key factors in 2024 and 2029
- Exhibits32: Threat of new entrants - Impact of key factors in 2024 and 2029
- Exhibits33: Threat of substitutes - Impact of key factors in 2024 and 2029
- Exhibits34: Threat of rivalry - Impact of key factors in 2024 and 2029
- Exhibits35: Chart on Market condition - Five forces 2024 and 2029
- Exhibits36: Chart on Distribution Channel - Market share 2024-2029 (%)
- Exhibits37: Data Table on Distribution Channel - Market share 2024-2029 (%)
- Exhibits38: Chart on Comparison by Distribution Channel
- Exhibits39: Data Table on Comparison by Distribution Channel
- Exhibits40: Chart on Supermarkets and hypermarkets - Market size and forecast 2024-2029 ($ million)
- Exhibits41: Data Table on Supermarkets and hypermarkets - Market size and forecast 2024-2029 ($ million)
- Exhibits42: Chart on Supermarkets and hypermarkets - Year-over-year growth 2024-2029 (%)
- Exhibits43: Data Table on Supermarkets and hypermarkets - Year-over-year growth 2024-2029 (%)
- Exhibits44: Chart on Convenience stores - Market size and forecast 2024-2029 ($ million)
- Exhibits45: Data Table on Convenience stores - Market size and forecast 2024-2029 ($ million)
- Exhibits46: Chart on Convenience stores - Year-over-year growth 2024-2029 (%)
- Exhibits47: Data Table on Convenience stores - Year-over-year growth 2024-2029 (%)
- Exhibits48: Chart on Online - Market size and forecast 2024-2029 ($ million)
- Exhibits49: Data Table on Online - Market size and forecast 2024-2029 ($ million)
- Exhibits50: Chart on Online - Year-over-year growth 2024-2029 (%)
- Exhibits51: Data Table on Online - Year-over-year growth 2024-2029 (%)
- Exhibits52: Market opportunity by Distribution Channel ($ million)
- Exhibits53: Data Table on Market opportunity by Distribution Channel ($ million)
- Exhibits54: Chart on Product - Market share 2024-2029 (%)
- Exhibits55: Data Table on Product - Market share 2024-2029 (%)
- Exhibits56: Chart on Comparison by Product
- Exhibits57: Data Table on Comparison by Product
- Exhibits58: Chart on Savory - Market size and forecast 2024-2029 ($ million)
- Exhibits59: Data Table on Savory - Market size and forecast 2024-2029 ($ million)
- Exhibits60: Chart on Savory - Year-over-year growth 2024-2029 (%)
- Exhibits61: Data Table on Savory - Year-over-year growth 2024-2029 (%)
- Exhibits62: Chart on Bakery - Market size and forecast 2024-2029 ($ million)
- Exhibits63: Data Table on Bakery - Market size and forecast 2024-2029 ($ million)
- Exhibits64: Chart on Bakery - Year-over-year growth 2024-2029 (%)
- Exhibits65: Data Table on Bakery - Year-over-year growth 2024-2029 (%)
- Exhibits66: Chart on Fruit - Market size and forecast 2024-2029 ($ million)
- Exhibits67: Data Table on Fruit - Market size and forecast 2024-2029 ($ million)
- Exhibits68: Chart on Fruit - Year-over-year growth 2024-2029 (%)
- Exhibits69: Data Table on Fruit - Year-over-year growth 2024-2029 (%)
- Exhibits70: Chart on Dairy - Market size and forecast 2024-2029 ($ million)
- Exhibits71: Data Table on Dairy - Market size and forecast 2024-2029 ($ million)
- Exhibits72: Chart on Dairy - Year-over-year growth 2024-2029 (%)
- Exhibits73: Data Table on Dairy - Year-over-year growth 2024-2029 (%)
- Exhibits74: Chart on Others - Market size and forecast 2024-2029 ($ million)
- Exhibits75: Data Table on Others - Market size and forecast 2024-2029 ($ million)
- Exhibits76: Chart on Others - Year-over-year growth 2024-2029 (%)
- Exhibits77: Data Table on Others - Year-over-year growth 2024-2029 (%)
- Exhibits78: Market opportunity by Product ($ million)
- Exhibits79: Data Table on Market opportunity by Product ($ million)
- Exhibits80: Analysis of price sensitivity, lifecycle, customer purchase basket, adoption rates, and purchase criteria
- Exhibits81: Chart on Market share By Geographical Landscape 2024-2029 (%)
- Exhibits82: Data Table on Market share By Geographical Landscape 2024-2029 (%)
- Exhibits83: Chart on Geographic comparison
- Exhibits84: Data Table on Geographic comparison
- Exhibits85: Chart on North America - Market size and forecast 2024-2029 ($ million)
- Exhibits86: Data Table on North America - Market size and forecast 2024-2029 ($ million)
- Exhibits87: Chart on North America - Year-over-year growth 2024-2029 (%)
- Exhibits88: Data Table on North America - Year-over-year growth 2024-2029 (%)
- Exhibits89: Chart on Europe - Market size and forecast 2024-2029 ($ million)
- Exhibits90: Data Table on Europe - Market size and forecast 2024-2029 ($ million)
- Exhibits91: Chart on Europe - Year-over-year growth 2024-2029 (%)
- Exhibits92: Data Table on Europe - Year-over-year growth 2024-2029 (%)
- Exhibits93: Chart on APAC - Market size and forecast 2024-2029 ($ million)
- Exhibits94: Data Table on APAC - Market size and forecast 2024-2029 ($ million)
- Exhibits95: Chart on APAC - Year-over-year growth 2024-2029 (%)
- Exhibits96: Data Table on APAC - Year-over-year growth 2024-2029 (%)
- Exhibits97: Chart on South America - Market size and forecast 2024-2029 ($ million)
- Exhibits98: Data Table on South America - Market size and forecast 2024-2029 ($ million)
- Exhibits99: Chart on South America - Year-over-year growth 2024-2029 (%)
- Exhibits100: Data Table on South America - Year-over-year growth 2024-2029 (%)
- Exhibits101: Chart on Middle East and Africa - Market size and forecast 2024-2029 ($ million)
- Exhibits102: Data Table on Middle East and Africa - Market size and forecast 2024-2029 ($ million)
- Exhibits103: Chart on Middle East and Africa - Year-over-year growth 2024-2029 (%)
- Exhibits104: Data Table on Middle East and Africa - Year-over-year growth 2024-2029 (%)
- Exhibits105: Chart on US - Market size and forecast 2024-2029 ($ million)
- Exhibits106: Data Table on US - Market size and forecast 2024-2029 ($ million)
- Exhibits107: Chart on US - Year-over-year growth 2024-2029 (%)
- Exhibits108: Data Table on US - Year-over-year growth 2024-2029 (%)
- Exhibits109: Chart on China - Market size and forecast 2024-2029 ($ million)
- Exhibits110: Data Table on China - Market size and forecast 2024-2029 ($ million)
- Exhibits111: Chart on China - Year-over-year growth 2024-2029 (%)
- Exhibits112: Data Table on China - Year-over-year growth 2024-2029 (%)
- Exhibits113: Chart on UK - Market size and forecast 2024-2029 ($ million)
- Exhibits114: Data Table on UK - Market size and forecast 2024-2029 ($ million)
- Exhibits115: Chart on UK - Year-over-year growth 2024-2029 (%)
- Exhibits116: Data Table on UK - Year-over-year growth 2024-2029 (%)
- Exhibits117: Chart on Germany - Market size and forecast 2024-2029 ($ million)
- Exhibits118: Data Table on Germany - Market size and forecast 2024-2029 ($ million)
- Exhibits119: Chart on Germany - Year-over-year growth 2024-2029 (%)
- Exhibits120: Data Table on Germany - Year-over-year growth 2024-2029 (%)
- Exhibits121: Chart on Canada - Market size and forecast 2024-2029 ($ million)
- Exhibits122: Data Table on Canada - Market size and forecast 2024-2029 ($ million)
- Exhibits123: Chart on Canada - Year-over-year growth 2024-2029 (%)
- Exhibits124: Data Table on Canada - Year-over-year growth 2024-2029 (%)
- Exhibits125: Chart on Japan - Market size and forecast 2024-2029 ($ million)
- Exhibits126: Data Table on Japan - Market size and forecast 2024-2029 ($ million)
- Exhibits127: Chart on Japan - Year-over-year growth 2024-2029 (%)
- Exhibits128: Data Table on Japan - Year-over-year growth 2024-2029 (%)
- Exhibits129: Chart on India - Market size and forecast 2024-2029 ($ million)
- Exhibits130: Data Table on India - Market size and forecast 2024-2029 ($ million)
- Exhibits131: Chart on India - Year-over-year growth 2024-2029 (%)
- Exhibits132: Data Table on India - Year-over-year growth 2024-2029 (%)
- Exhibits133: Chart on South Korea - Market size and forecast 2024-2029 ($ million)
- Exhibits134: Data Table on South Korea - Market size and forecast 2024-2029 ($ million)
- Exhibits135: Chart on South Korea - Year-over-year growth 2024-2029 (%)
- Exhibits136: Data Table on South Korea - Year-over-year growth 2024-2029 (%)
- Exhibits137: Chart on France - Market size and forecast 2024-2029 ($ million)
- Exhibits138: Data Table on France - Market size and forecast 2024-2029 ($ million)
- Exhibits139: Chart on France - Year-over-year growth 2024-2029 (%)
- Exhibits140: Data Table on France - Year-over-year growth 2024-2029 (%)
- Exhibits141: Chart on Italy - Market size and forecast 2024-2029 ($ million)
- Exhibits142: Data Table on Italy - Market size and forecast 2024-2029 ($ million)
- Exhibits143: Chart on Italy - Year-over-year growth 2024-2029 (%)
- Exhibits144: Data Table on Italy - Year-over-year growth 2024-2029 (%)
- Exhibits145: Market opportunity By Geographical Landscape ($ million)
- Exhibits146: Data Tables on Market opportunity By Geographical Landscape ($ million)
- Exhibits147: Impact of drivers and challenges in 2024 and 2029
- Exhibits148: Overview on criticality of inputs and factors of differentiation
- Exhibits149: Overview on factors of disruption
- Exhibits150: Impact of key risks on business
- Exhibits151: Companies covered
- Exhibits152: Company ranking index
- Exhibits153: Matrix on companies position and classification
- Exhibits154: B and G Foods Inc. - Overview
- Exhibits155: B and G Foods Inc. - Product / Service
- Exhibits156: B and G Foods Inc. - Key offerings
- Exhibits157: SWOT
- Exhibits158: Calbee Inc. - Overview
- Exhibits159: Calbee Inc. - Product / Service
- Exhibits160: Calbee Inc. - Key offerings
- Exhibits161: SWOT
- Exhibits162: Danone SA - Overview
- Exhibits163: Danone SA - Business segments
- Exhibits164: Danone SA - Key news
- Exhibits165: Danone SA - Key offerings
- Exhibits166: Danone SA - Segment focus
- Exhibits167: SWOT
- Exhibits168: Del Monte Foods Inc. - Overview
- Exhibits169: Del Monte Foods Inc. - Product / Service
- Exhibits170: Del Monte Foods Inc. - Key offerings
- Exhibits171: SWOT
- Exhibits172: Dole Packaged Foods LLC - Overview
- Exhibits173: Dole Packaged Foods LLC - Product / Service
- Exhibits174: Dole Packaged Foods LLC - Key offerings
- Exhibits175: SWOT
- Exhibits176: General Mills Inc. - Overview
- Exhibits177: General Mills Inc. - Business segments
- Exhibits178: General Mills Inc. - Key news
- Exhibits179: General Mills Inc. - Key offerings
- Exhibits180: General Mills Inc. - Segment focus
- Exhibits181: SWOT
- Exhibits182: Hormel Foods Corp. - Overview
- Exhibits183: Hormel Foods Corp. - Business segments
- Exhibits184: Hormel Foods Corp. - Key news
- Exhibits185: Hormel Foods Corp. - Key offerings
- Exhibits186: Hormel Foods Corp. - Segment focus
- Exhibits187: SWOT
- Exhibits188: Kellogg Co. - Overview
- Exhibits189: Kellogg Co. - Business segments
- Exhibits190: Kellogg Co. - Key news
- Exhibits191: Kellogg Co. - Key offerings
- Exhibits192: Kellogg Co. - Segment focus
- Exhibits193: SWOT
- Exhibits194: LT Foods Ltd. - Overview
- Exhibits195: LT Foods Ltd. - Product / Service
- Exhibits196: LT Foods Ltd. - Key offerings
- Exhibits197: SWOT
- Exhibits198: Mondelez International Inc. - Overview
- Exhibits199: Mondelez International Inc. - Business segments
- Exhibits200: Mondelez International Inc. - Key news
- Exhibits201: Mondelez International Inc. - Key offerings
- Exhibits202: Mondelez International Inc. - Segment focus
- Exhibits203: SWOT
- Exhibits204: Monsoon Harvest - Overview
- Exhibits205: Monsoon Harvest - Product / Service
- Exhibits206: Monsoon Harvest - Key offerings
- Exhibits207: SWOT
- Exhibits208: PepsiCo Inc. - Overview
- Exhibits209: PepsiCo Inc. - Business segments
- Exhibits210: PepsiCo Inc. - Key news
- Exhibits211: PepsiCo Inc. - Key offerings
- Exhibits212: PepsiCo Inc. - Segment focus
- Exhibits213: SWOT
- Exhibits214: Select Harvests Ltd. - Overview
- Exhibits215: Select Harvests Ltd. - Product / Service
- Exhibits216: Select Harvests Ltd. - Key offerings
- Exhibits217: SWOT
- Exhibits218: Sun Maid Growers of California - Overview
- Exhibits219: Sun Maid Growers of California - Product / Service
- Exhibits220: Sun Maid Growers of California - Key offerings
- Exhibits221: SWOT
- Exhibits222: Tyson Foods Inc. - Overview
- Exhibits223: Tyson Foods Inc. - Business segments
- Exhibits224: Tyson Foods Inc. - Key news
- Exhibits225: Tyson Foods Inc. - Key offerings
- Exhibits226: Tyson Foods Inc. - Segment focus
- Exhibits227: SWOT
- Exhibits228: Inclusions checklist
- Exhibits229: Exclusions checklist
- Exhibits230: Currency conversion rates for US$
- Exhibits231: Research methodology
- Exhibits232: Information sources
- Exhibits233: Data validation
- Exhibits234: Validation techniques employed for market sizing
- Exhibits235: Data synthesis
- Exhibits236: 360 degree market analysis
- Exhibits237: List of abbreviations
Healthy Snack Market 2025-2029
The healthy snack market is forecasted to grow by USD 27 mn during 2024-2029, accelerating at a CAGR of 5.1% during the forecast period. The report on the healthy snack market provides a holistic analysis, market size and forecast, trends, growth drivers, and challenges, as well as vendor analysis covering around 25 vendors.
The report offers an up-to-date analysis regarding the current market scenario, the latest trends and drivers, and the overall market environment. The market is driven by rise in disposable income and change in lifestyle, evolving taste preferences, and growing inclination toward healthy snacks.
| Market Scope | |
|---|---|
| Base Year | 2025 |
| End Year | 2029 |
| Series Year | 2025-2029 |
| Growth Momentum | Accelerate |
| YOY 2025 | 4.9% |
| CAGR | 5.1% |
| Incremental Value | $27 mn |
Technavio's healthy snack market is segmented as below:
By Distribution Channel
- Supermarkets and hypermarkets
- Convenience stores
- Online
By Product
- Savory
- Bakery
- Fruit
- Dairy
- Others
By Geographical Landscape
- North America
- Europe
- APAC
- South America
- Middle East and Africa
This study identifies the growth of online retailing as one of the prime reasons driving the healthy snack market growth during the next few years. Also, increasing replacement of meals with healthy snacks and increasing consumption of plant-based diets will lead to sizable demand in the market.
The report on the healthy snack market covers the following areas:
- Healthy Snack Market sizing
- Healthy Snack Market forecast
- Healthy Snack Market industry analysis
The robust vendor analysis is designed to help clients improve their market position, and in line with this, this report provides a detailed analysis of several leading healthy snack market vendors that include B and G Foods Inc., Calbee Inc., Campbell Soup Co., Danone SA, Del Monte Foods Inc., Dole Packaged Foods LLC, General Mills Inc., Happytizers Pvt Ltd, Hormel Foods Corp., Kellogg Co., LT Foods Ltd., Mondelez International Inc., Monsoon Harvest, Nestle SA, PepsiCo Inc., Select Harvests Ltd., Sun Maid Growers of California, The Hain Celestial Group Inc., Tyson Foods Inc., and Warrell Corp.. Also, the healthy snack market analysis report includes information on upcoming trends and challenges that will influence market growth. This is to help companies strategize and leverage all forthcoming growth opportunities.
The study was conducted using an objective combination of primary and secondary information including inputs from key participants in the industry. The report contains a comprehensive market and vendor landscape in addition to an analysis of the key vendors.
The publisher presents a detailed picture of the market by the way of study, synthesis, and summation of data from multiple sources by an analysis of key parameters such as profit, pricing, competition, and promotions. It presents various market facets by identifying the key industry influencers. The data presented is comprehensive, reliable, and a result of extensive primary and secondary research. The market research reports provide a complete competitive landscape and an in-depth vendor selection methodology and analysis using qualitative and quantitative research to forecast accurate market growth.
Table of Contents
1 Executive Summary
- 1.1 Market overview
- Executive Summary - Chart on Market Overview
- Executive Summary - Data Table on Market Overview
- Executive Summary - Chart on Global Market Characteristics
- Executive Summary - Chart on Market By Geographical Landscape
- Executive Summary - Chart on Market Segmentation by Distribution Channel
- Executive Summary - Chart on Market Segmentation by Product
- Executive Summary - Chart on Incremental Growth
- Executive Summary - Data Table on Incremental Growth
- Executive Summary - Chart on Company Market Positioning
2 Technavio Analysis
- 2.1 Analysis of price sensitivity, lifecycle, customer purchase basket, adoption rates, and purchase criteria
- Analysis of price sensitivity, lifecycle, customer purchase basket, adoption rates, and purchase criteria
- 2.2 Criticality of inputs and Factors of differentiation
- Overview on criticality of inputs and factors of differentiation
- 2.3 Factors of disruption
- Overview on factors of disruption
- 2.4 Impact of drivers and challenges
- Impact of drivers and challenges in 2024 and 2029
3 Market Landscape
- 3.1 Market ecosystem
- Parent Market
- Data Table on - Parent Market
- 3.2 Market characteristics
- Market characteristics analysis
- 3.3 Value chain analysis
- Value chain analysis
4 Market Sizing
- 4.1 Market definition
- Offerings of companies included in the market definition
- 4.2 Market segment analysis
- Market segments
- 4.3 Market size 2024
- 4.4 Market outlook: Forecast for 2024-2029
- Chart on Global - Market size and forecast 2024-2029 ($ million)
- Data Table on Global - Market size and forecast 2024-2029 ($ million)
- Chart on Global Market: Year-over-year growth 2024-2029 (%)
- Data Table on Global Market: Year-over-year growth 2024-2029 (%)
5 Historic Market Size
- 5.1 Global Healthy Snack Market 2019 - 2023
- Historic Market Size - Data Table on Global Healthy Snack Market 2019 - 2023 ($ million)
- 5.2 Distribution Channel segment analysis 2019 - 2023
- Historic Market Size - Distribution Channel Segment 2019 - 2023 ($ million)
- 5.3 Product segment analysis 2019 - 2023
- Historic Market Size - Product Segment 2019 - 2023 ($ million)
- 5.4 Geography segment analysis 2019 - 2023
- Historic Market Size - Geography Segment 2019 - 2023 ($ million)
- 5.5 Country segment analysis 2019 - 2023
- Historic Market Size - Country Segment 2019 - 2023 ($ million)
6 Qualitative Analysis
- 6.1 Impact of AI on the Global Healthy Snack Market
7 Five Forces Analysis
- 7.1 Five forces summary
- Five forces analysis - Comparison between 2024 and 2029
- 7.2 Bargaining power of buyers
- Bargaining power of buyers - Impact of key factors 2024 and 2029
- 7.3 Bargaining power of suppliers
- Bargaining power of suppliers - Impact of key factors in 2024 and 2029
- 7.4 Threat of new entrants
- Threat of new entrants - Impact of key factors in 2024 and 2029
- 7.5 Threat of substitutes
- Threat of substitutes - Impact of key factors in 2024 and 2029
- 7.6 Threat of rivalry
- Threat of rivalry - Impact of key factors in 2024 and 2029
- 7.7 Market condition
- Chart on Market condition - Five forces 2024 and 2029
8 Market Segmentation by Distribution Channel
- 8.1 Market segments
- Chart on Distribution Channel - Market share 2024-2029 (%)
- Data Table on Distribution Channel - Market share 2024-2029 (%)
- 8.2 Comparison by Distribution Channel
- Chart on Comparison by Distribution Channel
- Data Table on Comparison by Distribution Channel
- 8.3 Supermarkets and hypermarkets - Market size and forecast 2024-2029
- Chart on Supermarkets and hypermarkets - Market size and forecast 2024-2029 ($ million)
- Data Table on Supermarkets and hypermarkets - Market size and forecast 2024-2029 ($ million)
- Chart on Supermarkets and hypermarkets - Year-over-year growth 2024-2029 (%)
- Data Table on Supermarkets and hypermarkets - Year-over-year growth 2024-2029 (%)
- 8.4 Convenience stores - Market size and forecast 2024-2029
- Chart on Convenience stores - Market size and forecast 2024-2029 ($ million)
- Data Table on Convenience stores - Market size and forecast 2024-2029 ($ million)
- Chart on Convenience stores - Year-over-year growth 2024-2029 (%)
- Data Table on Convenience stores - Year-over-year growth 2024-2029 (%)
- 8.5 Online - Market size and forecast 2024-2029
- Chart on Online - Market size and forecast 2024-2029 ($ million)
- Data Table on Online - Market size and forecast 2024-2029 ($ million)
- Chart on Online - Year-over-year growth 2024-2029 (%)
- Data Table on Online - Year-over-year growth 2024-2029 (%)
- 8.6 Market opportunity by Distribution Channel
- Market opportunity by Distribution Channel ($ million)
- Data Table on Market opportunity by Distribution Channel ($ million)
9 Market Segmentation by Product
- 9.1 Market segments
- Chart on Product - Market share 2024-2029 (%)
- Data Table on Product - Market share 2024-2029 (%)
- 9.2 Comparison by Product
- Chart on Comparison by Product
- Data Table on Comparison by Product
- 9.3 Savory - Market size and forecast 2024-2029
- Chart on Savory - Market size and forecast 2024-2029 ($ million)
- Data Table on Savory - Market size and forecast 2024-2029 ($ million)
- Chart on Savory - Year-over-year growth 2024-2029 (%)
- Data Table on Savory - Year-over-year growth 2024-2029 (%)
- 9.4 Bakery - Market size and forecast 2024-2029
- Chart on Bakery - Market size and forecast 2024-2029 ($ million)
- Data Table on Bakery - Market size and forecast 2024-2029 ($ million)
- Chart on Bakery - Year-over-year growth 2024-2029 (%)
- Data Table on Bakery - Year-over-year growth 2024-2029 (%)
- 9.5 Fruit - Market size and forecast 2024-2029
- Chart on Fruit - Market size and forecast 2024-2029 ($ million)
- Data Table on Fruit - Market size and forecast 2024-2029 ($ million)
- Chart on Fruit - Year-over-year growth 2024-2029 (%)
- Data Table on Fruit - Year-over-year growth 2024-2029 (%)
- 9.6 Dairy - Market size and forecast 2024-2029
- Chart on Dairy - Market size and forecast 2024-2029 ($ million)
- Data Table on Dairy - Market size and forecast 2024-2029 ($ million)
- Chart on Dairy - Year-over-year growth 2024-2029 (%)
- Data Table on Dairy - Year-over-year growth 2024-2029 (%)
- 9.7 Others - Market size and forecast 2024-2029
- Chart on Others - Market size and forecast 2024-2029 ($ million)
- Data Table on Others - Market size and forecast 2024-2029 ($ million)
- Chart on Others - Year-over-year growth 2024-2029 (%)
- Data Table on Others - Year-over-year growth 2024-2029 (%)
- 9.8 Market opportunity by Product
- Market opportunity by Product ($ million)
- Data Table on Market opportunity by Product ($ million)
10 Customer Landscape
- 10.1 Customer landscape overview
- Analysis of price sensitivity, lifecycle, customer purchase basket, adoption rates, and purchase criteria
11 Geographic Landscape
- 11.1 Geographic segmentation
- Chart on Market share By Geographical Landscape 2024-2029 (%)
- Data Table on Market share By Geographical Landscape 2024-2029 (%)
- 11.2 Geographic comparison
- Chart on Geographic comparison
- Data Table on Geographic comparison
- 11.3 North America - Market size and forecast 2024-2029
- Chart on North America - Market size and forecast 2024-2029 ($ million)
- Data Table on North America - Market size and forecast 2024-2029 ($ million)
- Chart on North America - Year-over-year growth 2024-2029 (%)
- Data Table on North America - Year-over-year growth 2024-2029 (%)
- 11.4 Europe - Market size and forecast 2024-2029
- Chart on Europe - Market size and forecast 2024-2029 ($ million)
- Data Table on Europe - Market size and forecast 2024-2029 ($ million)
- Chart on Europe - Year-over-year growth 2024-2029 (%)
- Data Table on Europe - Year-over-year growth 2024-2029 (%)
- 11.5 APAC - Market size and forecast 2024-2029
- Chart on APAC - Market size and forecast 2024-2029 ($ million)
- Data Table on APAC - Market size and forecast 2024-2029 ($ million)
- Chart on APAC - Year-over-year growth 2024-2029 (%)
- Data Table on APAC - Year-over-year growth 2024-2029 (%)
- 11.6 South America - Market size and forecast 2024-2029
- Chart on South America - Market size and forecast 2024-2029 ($ million)
- Data Table on South America - Market size and forecast 2024-2029 ($ million)
- Chart on South America - Year-over-year growth 2024-2029 (%)
- Data Table on South America - Year-over-year growth 2024-2029 (%)
- 11.7 Middle East and Africa - Market size and forecast 2024-2029
- Chart on Middle East and Africa - Market size and forecast 2024-2029 ($ million)
- Data Table on Middle East and Africa - Market size and forecast 2024-2029 ($ million)
- Chart on Middle East and Africa - Year-over-year growth 2024-2029 (%)
- Data Table on Middle East and Africa - Year-over-year growth 2024-2029 (%)
- 11.8 US - Market size and forecast 2024-2029
- Chart on US - Market size and forecast 2024-2029 ($ million)
- Data Table on US - Market size and forecast 2024-2029 ($ million)
- Chart on US - Year-over-year growth 2024-2029 (%)
- Data Table on US - Year-over-year growth 2024-2029 (%)
- 11.9 China - Market size and forecast 2024-2029
- Chart on China - Market size and forecast 2024-2029 ($ million)
- Data Table on China - Market size and forecast 2024-2029 ($ million)
- Chart on China - Year-over-year growth 2024-2029 (%)
- Data Table on China - Year-over-year growth 2024-2029 (%)
- 11.10 UK - Market size and forecast 2024-2029
- Chart on UK - Market size and forecast 2024-2029 ($ million)
- Data Table on UK - Market size and forecast 2024-2029 ($ million)
- Chart on UK - Year-over-year growth 2024-2029 (%)
- Data Table on UK - Year-over-year growth 2024-2029 (%)
- 11.11 Germany - Market size and forecast 2024-2029
- Chart on Germany - Market size and forecast 2024-2029 ($ million)
- Data Table on Germany - Market size and forecast 2024-2029 ($ million)
- Chart on Germany - Year-over-year growth 2024-2029 (%)
- Data Table on Germany - Year-over-year growth 2024-2029 (%)
- 11.12 Canada - Market size and forecast 2024-2029
- Chart on Canada - Market size and forecast 2024-2029 ($ million)
- Data Table on Canada - Market size and forecast 2024-2029 ($ million)
- Chart on Canada - Year-over-year growth 2024-2029 (%)
- Data Table on Canada - Year-over-year growth 2024-2029 (%)
- 11.13 Japan - Market size and forecast 2024-2029
- Chart on Japan - Market size and forecast 2024-2029 ($ million)
- Data Table on Japan - Market size and forecast 2024-2029 ($ million)
- Chart on Japan - Year-over-year growth 2024-2029 (%)
- Data Table on Japan - Year-over-year growth 2024-2029 (%)
- 11.14 India - Market size and forecast 2024-2029
- Chart on India - Market size and forecast 2024-2029 ($ million)
- Data Table on India - Market size and forecast 2024-2029 ($ million)
- Chart on India - Year-over-year growth 2024-2029 (%)
- Data Table on India - Year-over-year growth 2024-2029 (%)
- 11.15 South Korea - Market size and forecast 2024-2029
- Chart on South Korea - Market size and forecast 2024-2029 ($ million)
- Data Table on South Korea - Market size and forecast 2024-2029 ($ million)
- Chart on South Korea - Year-over-year growth 2024-2029 (%)
- Data Table on South Korea - Year-over-year growth 2024-2029 (%)
- 11.16 France - Market size and forecast 2024-2029
- Chart on France - Market size and forecast 2024-2029 ($ million)
- Data Table on France - Market size and forecast 2024-2029 ($ million)
- Chart on France - Year-over-year growth 2024-2029 (%)
- Data Table on France - Year-over-year growth 2024-2029 (%)
- 11.17 Italy - Market size and forecast 2024-2029
- Chart on Italy - Market size and forecast 2024-2029 ($ million)
- Data Table on Italy - Market size and forecast 2024-2029 ($ million)
- Chart on Italy - Year-over-year growth 2024-2029 (%)
- Data Table on Italy - Year-over-year growth 2024-2029 (%)
- 11.18 Market opportunity By Geographical Landscape
- Market opportunity By Geographical Landscape ($ million)
- Data Tables on Market opportunity By Geographical Landscape ($ million)
12 Drivers, Challenges, and Opportunity/Restraints
- 12.1 Market drivers
- 12.2 Market challenges
- 12.3 Impact of drivers and challenges
- Impact of drivers and challenges in 2024 and 2029
- 12.4 Market opportunities/restraints
13 Competitive Landscape
- 13.1 Overview
- 13.2 Competitive Landscape
- Overview on criticality of inputs and factors of differentiation
- 13.3 Landscape disruption
- Overview on factors of disruption
- 13.4 Industry risks
- Impact of key risks on business
14 Competitive Analysis
- 14.1 Companies profiled
- Companies covered
- 14.2 Company ranking index
- Company ranking index
- 14.3 Market positioning of companies
- Matrix on companies position and classification
- 14.4 B and G Foods Inc.
- B and G Foods Inc. - Overview
- B and G Foods Inc. - Product / Service
- B and G Foods Inc. - Key offerings
- SWOT
- 14.5 Calbee Inc.
- Calbee Inc. - Overview
- Calbee Inc. - Product / Service
- Calbee Inc. - Key offerings
- SWOT
- 14.6 Danone SA
- Danone SA - Overview
- Danone SA - Business segments
- Danone SA - Key news
- Danone SA - Key offerings
- Danone SA - Segment focus
- SWOT
- 14.7 Del Monte Foods Inc.
- Del Monte Foods Inc. - Overview
- Del Monte Foods Inc. - Product / Service
- Del Monte Foods Inc. - Key offerings
- SWOT
- 14.8 Dole Packaged Foods LLC
- Dole Packaged Foods LLC - Overview
- Dole Packaged Foods LLC - Product / Service
- Dole Packaged Foods LLC - Key offerings
- SWOT
- 14.9 General Mills Inc.
- General Mills Inc. - Overview
- General Mills Inc. - Business segments
- General Mills Inc. - Key news
- General Mills Inc. - Key offerings
- General Mills Inc. - Segment focus
- SWOT
- 14.10 Hormel Foods Corp.
- Hormel Foods Corp. - Overview
- Hormel Foods Corp. - Business segments
- Hormel Foods Corp. - Key news
- Hormel Foods Corp. - Key offerings
- Hormel Foods Corp. - Segment focus
- SWOT
- 14.11 Kellogg Co.
- Kellogg Co. - Overview
- Kellogg Co. - Business segments
- Kellogg Co. - Key news
- Kellogg Co. - Key offerings
- Kellogg Co. - Segment focus
- SWOT
- 14.12 LT Foods Ltd.
- LT Foods Ltd. - Overview
- LT Foods Ltd. - Product / Service
- LT Foods Ltd. - Key offerings
- SWOT
- 14.13 Mondelez International Inc.
- Mondelez International Inc. - Overview
- Mondelez International Inc. - Business segments
- Mondelez International Inc. - Key news
- Mondelez International Inc. - Key offerings
- Mondelez International Inc. - Segment focus
- SWOT
- 14.14 Monsoon Harvest
- Monsoon Harvest - Overview
- Monsoon Harvest - Product / Service
- Monsoon Harvest - Key offerings
- SWOT
- 14.15 PepsiCo Inc.
- PepsiCo Inc. - Overview
- PepsiCo Inc. - Business segments
- PepsiCo Inc. - Key news
- PepsiCo Inc. - Key offerings
- PepsiCo Inc. - Segment focus
- SWOT
- 14.16 Select Harvests Ltd.
- Select Harvests Ltd. - Overview
- Select Harvests Ltd. - Product / Service
- Select Harvests Ltd. - Key offerings
- SWOT
- 14.17 Sun Maid Growers of California
- Sun Maid Growers of California - Overview
- Sun Maid Growers of California - Product / Service
- Sun Maid Growers of California - Key offerings
- SWOT
- 14.18 Tyson Foods Inc.
- Tyson Foods Inc. - Overview
- Tyson Foods Inc. - Business segments
- Tyson Foods Inc. - Key news
- Tyson Foods Inc. - Key offerings
- Tyson Foods Inc. - Segment focus
- SWOT
15 Appendix
- 15.1 Scope of the report
- 15.2 Inclusions and exclusions checklist
- Inclusions checklist
- Exclusions checklist
- 15.3 Currency conversion rates for US$
- Currency conversion rates for US$
- 15.4 Research methodology
- Research methodology
- 15.5 Data procurement
- Information sources
- 15.6 Data validation
- Data validation
- 15.7 Validation techniques employed for market sizing
- Validation techniques employed for market sizing
- 15.8 Data synthesis
- Data synthesis
- 15.9 360 degree market analysis
- 360 degree market analysis
- 15.10 List of abbreviations
- List of abbreviations
