|
|
市場調査レポート
商品コード
1626680
コンテンツマーケティングの世界市場 2025-2029年Global Content Marketing Market 2025-2029 |
||||||

|
|||||||
カスタマイズ可能
|
|||||||


| コンテンツマーケティングの世界市場 2025-2029年 |
|
出版日: 2024年12月28日
発行: TechNavio
ページ情報: 英文 233 Pages
納期: 即納可能
|

全表示
- 概要
- 図表
- 目次
コンテンツマーケティングの世界市場 2025-2029年
コンテンツマーケティング市場は2024-2029年に5億3,930万米ドル、予測期間中のCAGRは13.9%で成長すると予測されます。当レポートでは、コンテンツマーケティング市場の全体的な分析、市場規模・予測、動向、成長促進要因・課題、約25のベンダーを網羅したベンダー分析などを掲載しています。
現在の市場シナリオ、最新動向と促進要因、市場環境全体に関する最新分析を提供しています。ソーシャルメディア利用者の増加、デジタル雑誌の需要拡大、モバイルコンピューティングデバイスの普及率上昇などが市場を牽引しています。
| 市場範囲 | |
|---|---|
| 基準年 | 2025 |
| 終了年 | 2029 |
| 予測期間 | 2025-2029 |
| 成長モメンタム | 加速 |
| 前年比2025年 | 12.2% |
| CAGR | 13.9% |
| 増分額 | 5億3,930万米ドル |
本調査では、ソーシャルメディア管理ソフトウェアによるaiの利用が、今後数年間のコンテンツマーケティング市場の成長を促進する主な要因の1つであるとしています。また、コンテンツマーケティングにおけるアナリティクスの利用や、コンテンツマーケティングにおけるライブ動画の利用は、市場の大きな需要につながると思われます。
目次
第1章 エグゼクティブサマリー
- 市場概要
第2章 Technavio別分析
- 価格・ライフサイクル・顧客購入バスケット・採用率・購入基準の分析
- インプットの重要性と差別化の要因
- 混乱の要因
- 促進要因と課題の影響
第3章 市場情勢
- 市場エコシステム
- 市場の特徴
- バリューチェーン分析
第4章 市場規模
- 市場の定義
- 市場セグメント分析
- 市場規模 2024
- 市場の見通し 2024-2029
第5章 市場規模実績
- コンテンツマーケティングの世界市場 2019-2023
- エンドユーザー別セグメント分析 2019-2023
- プラットフォーム別セグメント分析 2019-2023
- 目的別セグメント分析 2019-2023
- 地域別セグメント分析 2019-2023
- 国別セグメント分析 2019-2023
第6章 定性分析
- AIの影響コンテンツマーケティングの世界市場
第7章 ファイブフォース分析
- ファイブフォースの要約
- 買い手の交渉力
- 供給企業の交渉力
- 新規参入業者の脅威
- 代替品の脅威
- 競争の脅威
- 市況
第8章 市場セグメンテーション:エンドユーザー別
- 市場セグメント
- 比較:エンドユーザー別
- 小売り:市場規模と予測 2024-2029
- 自動車:市場規模と予測 2024-2029
- 金融サービス:市場規模と予測 2024-2029
- 通信:市場規模と予測 2024-2029
- その他:市場規模と予測 2024-2029
- 市場機会:エンドユーザー別
第9章 市場セグメンテーション:プラットフォーム別
- 市場セグメント
- 比較:プラットフォーム別
- ブログ:市場規模と予測 2024-2029
- ビデオ:市場規模と予測 2024-2029
- インフォグラフィック:市場規模と予測 2024-2029
- ケーススタディ:市場規模と予測 2024-2029
- その他:市場規模と予測 2024-2029
- 市場機会:プラットフォーム別
第10章 市場セグメンテーション:目的別
- 市場セグメント
- 比較:目的別
- リードジェネレーション:市場規模と予測 2024-2029
- ブランド認知度:市場規模と予測 2024-2029
- 思想的リーダーシップ:市場規模と予測 2024-2029
- その他:市場規模と予測 2024-2029
- 市場機会:目的別
第11章 顧客情勢
- 顧客情勢の概要
第12章 地域別情勢
- 地域別セグメンテーション
- 比較:地域別
- アジア太平洋:市場規模と予測 2024-2029
- 北米:市場規模と予測 2024-2029
- 欧州:市場規模と予測 2024-2029
- 南米:市場規模と予測 2024-2029
- 中東・アフリカ:市場規模と予測 2024-2029
- 米国:市場規模と予測 2024-2029
- 中国:市場規模と予測 2024-2029
- 日本:市場規模と予測 2024-2029
- ドイツ:市場規模と予測 2024-2029
- カナダ:市場規模と予測 2024-2029
- インド:市場規模と予測 2024-2029
- ブラジル:市場規模と予測 2024-2029
- サウジアラビア:市場規模と予測 2024-2029
- アルゼンチン:市場規模と予測 2024-2029
- アラブ首長国連邦:市場規模と予測 2024-2029
- 市場機会:地域情勢別
第13章 促進要因・課題・機会・抑制要因
- 市場促進要因
- 市場の課題
- 促進要因と課題の影響
- 市場の機会・抑制要因
第14章 競合情勢
- 概要
- 競合情勢
- 混乱の状況
- 業界のリスク
第15章 競合分析
- 企業プロファイル
- 企業ランキング指数
- 企業の市場ポジショニング
- Adobe Inc.
- Alma Media Corp.
- Brafton Inc.
- Contently Inc.
- Contentoo B.V.
- CoSchedule LLC
- Eucalypt LLC
- Hootsuite Inc
- HubSpot Inc.
- Influence and Co.
- Rock Content
- Seismic Software Inc.
- Skyword Inc.
- Sprinklr Inc.
- Upland Software Inc.
第16章 付録
Exhibits:
- Exhibits1: Executive Summary - Chart on Market Overview
- Exhibits2: Executive Summary - Data Table on Market Overview
- Exhibits3: Executive Summary - Chart on Global Market Characteristics
- Exhibits4: Executive Summary - Chart on Market By Geographical Landscape
- Exhibits5: Executive Summary - Chart on Market Segmentation by End-user
- Exhibits6: Executive Summary - Chart on Market Segmentation by Platform
- Exhibits7: Executive Summary - Chart on Market Segmentation by Objective
- Exhibits8: Executive Summary - Chart on Incremental Growth
- Exhibits9: Executive Summary - Data Table on Incremental Growth
- Exhibits10: Executive Summary - Chart on Company Market Positioning
- Exhibits11: Analysis of price sensitivity, lifecycle, customer purchase basket, adoption rates, and purchase criteria
- Exhibits12: Overview on criticality of inputs and factors of differentiation
- Exhibits13: Overview on factors of disruption
- Exhibits14: Impact of drivers and challenges in 2024 and 2029
- Exhibits15: Parent Market
- Exhibits16: Data Table on - Parent Market
- Exhibits17: Market characteristics analysis
- Exhibits18: Value chain analysis
- Exhibits19: Offerings of companies included in the market definition
- Exhibits20: Market segments
- Exhibits21: Chart on Global - Market size and forecast 2024-2029 ($ million)
- Exhibits22: Data Table on Global - Market size and forecast 2024-2029 ($ million)
- Exhibits23: Chart on Global Market: Year-over-year growth 2024-2029 (%)
- Exhibits24: Data Table on Global Market: Year-over-year growth 2024-2029 (%)
- Exhibits25: Historic Market Size - Data Table on Global Content Marketing Market 2019 - 2023 ($ million)
- Exhibits26: Historic Market Size - End-user Segment 2019 - 2023 ($ million)
- Exhibits27: Historic Market Size - Platform Segment 2019 - 2023 ($ million)
- Exhibits28: Historic Market Size - Objective Segment 2019 - 2023 ($ million)
- Exhibits29: Historic Market Size - Geography Segment 2019 - 2023 ($ million)
- Exhibits30: Historic Market Size - Country Segment 2019 - 2023 ($ million)
- Exhibits31: Five forces analysis - Comparison between 2024 and 2029
- Exhibits32: Bargaining power of buyers - Impact of key factors 2024 and 2029
- Exhibits33: Bargaining power of suppliers - Impact of key factors in 2024 and 2029
- Exhibits34: Threat of new entrants - Impact of key factors in 2024 and 2029
- Exhibits35: Threat of substitutes - Impact of key factors in 2024 and 2029
- Exhibits36: Threat of rivalry - Impact of key factors in 2024 and 2029
- Exhibits37: Chart on Market condition - Five forces 2024 and 2029
- Exhibits38: Chart on End-user - Market share 2024-2029 (%)
- Exhibits39: Data Table on End-user - Market share 2024-2029 (%)
- Exhibits40: Chart on Comparison by End-user
- Exhibits41: Data Table on Comparison by End-user
- Exhibits42: Chart on Retail - Market size and forecast 2024-2029 ($ million)
- Exhibits43: Data Table on Retail - Market size and forecast 2024-2029 ($ million)
- Exhibits44: Chart on Retail - Year-over-year growth 2024-2029 (%)
- Exhibits45: Data Table on Retail - Year-over-year growth 2024-2029 (%)
- Exhibits46: Chart on Automotive - Market size and forecast 2024-2029 ($ million)
- Exhibits47: Data Table on Automotive - Market size and forecast 2024-2029 ($ million)
- Exhibits48: Chart on Automotive - Year-over-year growth 2024-2029 (%)
- Exhibits49: Data Table on Automotive - Year-over-year growth 2024-2029 (%)
- Exhibits50: Chart on Financial services - Market size and forecast 2024-2029 ($ million)
- Exhibits51: Data Table on Financial services - Market size and forecast 2024-2029 ($ million)
- Exhibits52: Chart on Financial services - Year-over-year growth 2024-2029 (%)
- Exhibits53: Data Table on Financial services - Year-over-year growth 2024-2029 (%)
- Exhibits54: Chart on Telecom - Market size and forecast 2024-2029 ($ million)
- Exhibits55: Data Table on Telecom - Market size and forecast 2024-2029 ($ million)
- Exhibits56: Chart on Telecom - Year-over-year growth 2024-2029 (%)
- Exhibits57: Data Table on Telecom - Year-over-year growth 2024-2029 (%)
- Exhibits58: Chart on Others - Market size and forecast 2024-2029 ($ million)
- Exhibits59: Data Table on Others - Market size and forecast 2024-2029 ($ million)
- Exhibits60: Chart on Others - Year-over-year growth 2024-2029 (%)
- Exhibits61: Data Table on Others - Year-over-year growth 2024-2029 (%)
- Exhibits62: Market opportunity by End-user ($ million)
- Exhibits63: Data Table on Market opportunity by End-user ($ million)
- Exhibits64: Chart on Platform - Market share 2024-2029 (%)
- Exhibits65: Data Table on Platform - Market share 2024-2029 (%)
- Exhibits66: Chart on Comparison by Platform
- Exhibits67: Data Table on Comparison by Platform
- Exhibits68: Chart on Blogging - Market size and forecast 2024-2029 ($ million)
- Exhibits69: Data Table on Blogging - Market size and forecast 2024-2029 ($ million)
- Exhibits70: Chart on Blogging - Year-over-year growth 2024-2029 (%)
- Exhibits71: Data Table on Blogging - Year-over-year growth 2024-2029 (%)
- Exhibits72: Chart on Videos - Market size and forecast 2024-2029 ($ million)
- Exhibits73: Data Table on Videos - Market size and forecast 2024-2029 ($ million)
- Exhibits74: Chart on Videos - Year-over-year growth 2024-2029 (%)
- Exhibits75: Data Table on Videos - Year-over-year growth 2024-2029 (%)
- Exhibits76: Chart on Infographics - Market size and forecast 2024-2029 ($ million)
- Exhibits77: Data Table on Infographics - Market size and forecast 2024-2029 ($ million)
- Exhibits78: Chart on Infographics - Year-over-year growth 2024-2029 (%)
- Exhibits79: Data Table on Infographics - Year-over-year growth 2024-2029 (%)
- Exhibits80: Chart on Case studies - Market size and forecast 2024-2029 ($ million)
- Exhibits81: Data Table on Case studies - Market size and forecast 2024-2029 ($ million)
- Exhibits82: Chart on Case studies - Year-over-year growth 2024-2029 (%)
- Exhibits83: Data Table on Case studies - Year-over-year growth 2024-2029 (%)
- Exhibits84: Chart on Others - Market size and forecast 2024-2029 ($ million)
- Exhibits85: Data Table on Others - Market size and forecast 2024-2029 ($ million)
- Exhibits86: Chart on Others - Year-over-year growth 2024-2029 (%)
- Exhibits87: Data Table on Others - Year-over-year growth 2024-2029 (%)
- Exhibits88: Market opportunity by Platform ($ million)
- Exhibits89: Data Table on Market opportunity by Platform ($ million)
- Exhibits90: Chart on Objective - Market share 2024-2029 (%)
- Exhibits91: Data Table on Objective - Market share 2024-2029 (%)
- Exhibits92: Chart on Comparison by Objective
- Exhibits93: Data Table on Comparison by Objective
- Exhibits94: Chart on Lead generation - Market size and forecast 2024-2029 ($ million)
- Exhibits95: Data Table on Lead generation - Market size and forecast 2024-2029 ($ million)
- Exhibits96: Chart on Lead generation - Year-over-year growth 2024-2029 (%)
- Exhibits97: Data Table on Lead generation - Year-over-year growth 2024-2029 (%)
- Exhibits98: Chart on Brand awareness - Market size and forecast 2024-2029 ($ million)
- Exhibits99: Data Table on Brand awareness - Market size and forecast 2024-2029 ($ million)
- Exhibits100: Chart on Brand awareness - Year-over-year growth 2024-2029 (%)
- Exhibits101: Data Table on Brand awareness - Year-over-year growth 2024-2029 (%)
- Exhibits102: Chart on Thought leadership - Market size and forecast 2024-2029 ($ million)
- Exhibits103: Data Table on Thought leadership - Market size and forecast 2024-2029 ($ million)
- Exhibits104: Chart on Thought leadership - Year-over-year growth 2024-2029 (%)
- Exhibits105: Data Table on Thought leadership - Year-over-year growth 2024-2029 (%)
- Exhibits106: Chart on Others - Market size and forecast 2024-2029 ($ million)
- Exhibits107: Data Table on Others - Market size and forecast 2024-2029 ($ million)
- Exhibits108: Chart on Others - Year-over-year growth 2024-2029 (%)
- Exhibits109: Data Table on Others - Year-over-year growth 2024-2029 (%)
- Exhibits110: Market opportunity by Objective ($ million)
- Exhibits111: Data Table on Market opportunity by Objective ($ million)
- Exhibits112: Analysis of price sensitivity, lifecycle, customer purchase basket, adoption rates, and purchase criteria
- Exhibits113: Chart on Market share By Geographical Landscape 2024-2029 (%)
- Exhibits114: Data Table on Market share By Geographical Landscape 2024-2029 (%)
- Exhibits115: Chart on Geographic comparison
- Exhibits116: Data Table on Geographic comparison
- Exhibits117: Chart on APAC - Market size and forecast 2024-2029 ($ million)
- Exhibits118: Data Table on APAC - Market size and forecast 2024-2029 ($ million)
- Exhibits119: Chart on APAC - Year-over-year growth 2024-2029 (%)
- Exhibits120: Data Table on APAC - Year-over-year growth 2024-2029 (%)
- Exhibits121: Chart on North America - Market size and forecast 2024-2029 ($ million)
- Exhibits122: Data Table on North America - Market size and forecast 2024-2029 ($ million)
- Exhibits123: Chart on North America - Year-over-year growth 2024-2029 (%)
- Exhibits124: Data Table on North America - Year-over-year growth 2024-2029 (%)
- Exhibits125: Chart on Europe - Market size and forecast 2024-2029 ($ million)
- Exhibits126: Data Table on Europe - Market size and forecast 2024-2029 ($ million)
- Exhibits127: Chart on Europe - Year-over-year growth 2024-2029 (%)
- Exhibits128: Data Table on Europe - Year-over-year growth 2024-2029 (%)
- Exhibits129: Chart on South America - Market size and forecast 2024-2029 ($ million)
- Exhibits130: Data Table on South America - Market size and forecast 2024-2029 ($ million)
- Exhibits131: Chart on South America - Year-over-year growth 2024-2029 (%)
- Exhibits132: Data Table on South America - Year-over-year growth 2024-2029 (%)
- Exhibits133: Chart on Middle East and Africa - Market size and forecast 2024-2029 ($ million)
- Exhibits134: Data Table on Middle East and Africa - Market size and forecast 2024-2029 ($ million)
- Exhibits135: Chart on Middle East and Africa - Year-over-year growth 2024-2029 (%)
- Exhibits136: Data Table on Middle East and Africa - Year-over-year growth 2024-2029 (%)
- Exhibits137: Chart on US - Market size and forecast 2024-2029 ($ million)
- Exhibits138: Data Table on US - Market size and forecast 2024-2029 ($ million)
- Exhibits139: Chart on US - Year-over-year growth 2024-2029 (%)
- Exhibits140: Data Table on US - Year-over-year growth 2024-2029 (%)
- Exhibits141: Chart on China - Market size and forecast 2024-2029 ($ million)
- Exhibits142: Data Table on China - Market size and forecast 2024-2029 ($ million)
- Exhibits143: Chart on China - Year-over-year growth 2024-2029 (%)
- Exhibits144: Data Table on China - Year-over-year growth 2024-2029 (%)
- Exhibits145: Chart on Japan - Market size and forecast 2024-2029 ($ million)
- Exhibits146: Data Table on Japan - Market size and forecast 2024-2029 ($ million)
- Exhibits147: Chart on Japan - Year-over-year growth 2024-2029 (%)
- Exhibits148: Data Table on Japan - Year-over-year growth 2024-2029 (%)
- Exhibits149: Chart on Germany - Market size and forecast 2024-2029 ($ million)
- Exhibits150: Data Table on Germany - Market size and forecast 2024-2029 ($ million)
- Exhibits151: Chart on Germany - Year-over-year growth 2024-2029 (%)
- Exhibits152: Data Table on Germany - Year-over-year growth 2024-2029 (%)
- Exhibits153: Chart on Canada - Market size and forecast 2024-2029 ($ million)
- Exhibits154: Data Table on Canada - Market size and forecast 2024-2029 ($ million)
- Exhibits155: Chart on Canada - Year-over-year growth 2024-2029 (%)
- Exhibits156: Data Table on Canada - Year-over-year growth 2024-2029 (%)
- Exhibits157: Chart on India - Market size and forecast 2024-2029 ($ million)
- Exhibits158: Data Table on India - Market size and forecast 2024-2029 ($ million)
- Exhibits159: Chart on India - Year-over-year growth 2024-2029 (%)
- Exhibits160: Data Table on India - Year-over-year growth 2024-2029 (%)
- Exhibits161: Chart on Brazil - Market size and forecast 2024-2029 ($ million)
- Exhibits162: Data Table on Brazil - Market size and forecast 2024-2029 ($ million)
- Exhibits163: Chart on Brazil - Year-over-year growth 2024-2029 (%)
- Exhibits164: Data Table on Brazil - Year-over-year growth 2024-2029 (%)
- Exhibits165: Chart on Saudi Arabia - Market size and forecast 2024-2029 ($ million)
- Exhibits166: Data Table on Saudi Arabia - Market size and forecast 2024-2029 ($ million)
- Exhibits167: Chart on Saudi Arabia - Year-over-year growth 2024-2029 (%)
- Exhibits168: Data Table on Saudi Arabia - Year-over-year growth 2024-2029 (%)
- Exhibits169: Chart on Argentina - Market size and forecast 2024-2029 ($ million)
- Exhibits170: Data Table on Argentina - Market size and forecast 2024-2029 ($ million)
- Exhibits171: Chart on Argentina - Year-over-year growth 2024-2029 (%)
- Exhibits172: Data Table on Argentina - Year-over-year growth 2024-2029 (%)
- Exhibits173: Chart on UAE - Market size and forecast 2024-2029 ($ million)
- Exhibits174: Data Table on UAE - Market size and forecast 2024-2029 ($ million)
- Exhibits175: Chart on UAE - Year-over-year growth 2024-2029 (%)
- Exhibits176: Data Table on UAE - Year-over-year growth 2024-2029 (%)
- Exhibits177: Market opportunity By Geographical Landscape ($ million)
- Exhibits178: Data Tables on Market opportunity By Geographical Landscape ($ million)
- Exhibits179: Impact of drivers and challenges in 2024 and 2029
- Exhibits180: Overview on criticality of inputs and factors of differentiation
- Exhibits181: Overview on factors of disruption
- Exhibits182: Impact of key risks on business
- Exhibits183: Companies covered
- Exhibits184: Company ranking index
- Exhibits185: Matrix on companies position a
Contenting Market 2025-2029
The contenting market is forecasted to grow by USD 539.3 mn during 2024-2029, accelerating at a CAGR of 13.9% during the forecast period. The report on the contenting market provides a holistic analysis, market size and forecast, trends, growth drivers, and challenges, as well as vendor analysis covering around 25 vendors.
The report offers an up-to-date analysis regarding the current market scenario, the latest trends and drivers, and the overall market environment. The market is driven by rise in number of users on social media, growing demand for digital magazines, and rising penetration of mobile computing devices.
| Market Scope | |
|---|---|
| Base Year | 2025 |
| End Year | 2029 |
| Series Year | 2025-2029 |
| Growth Momentum | Accelerate |
| YOY 2025 | 12.2% |
| CAGR | 13.9% |
| Incremental Value | $539.3 mn |
Technavio's contenting market is segmented as below:
By End-user
- Retail
- Automotive
- Financial services
- Telecom
- Others
By Platform
- Blogging
- Videos
- Infographics
- Case studies
- Others
By Objective
- Lead generation
- Brand awareness
- Thought leadership
- Others
By Geographical Landscape
- APAC
- North America
- Europe
- South America
- Middle East and Africa
This study identifies the use of ai with social media management software as one of the prime reasons driving the contenting market growth during the next few years. Also, use of analytics in content marketing and use of live videos for content marketing will lead to sizable demand in the market.
The report on the contenting market covers the following areas:
- Contenting Market sizing
- Contenting Market forecast
- Contenting Market industry analysis
The robust vendor analysis is designed to help clients improve their market position, and in line with this, this report provides a detailed analysis of several leading contenting market vendors that include Adobe Inc., Aghreni Technologies Pvt. Ltd., Alma Media Corp., Brafton Inc., ClearVoice Inc., Contently Inc., Contentoo B.V., CoSchedule LLC, Eucalypt LLC, Hootsuite Inc, HubSpot Inc., Influence and Co., Interact Marketing, IZEA Worldwide Inc., Rock Content, Seismic Software Inc., Skyword Inc., Sprinklr Inc., Upland Software Inc., and Vendasta Technologies Inc.. Also, the contenting market analysis report includes information on upcoming trends and challenges that will influence market growth. This is to help companies strategize and leverage all forthcoming growth opportunities.
The study was conducted using an objective combination of primary and secondary information including inputs from key participants in the industry. The report contains a comprehensive market and vendor landscape in addition to an analysis of the key vendors.
The publisher presents a detailed picture of the market by the way of study, synthesis, and summation of data from multiple sources by an analysis of key parameters such as profit, pricing, competition, and promotions. It presents various market facets by identifying the key industry influencers. The data presented is comprehensive, reliable, and a result of extensive primary and secondary research. The market research reports provide a complete competitive landscape and an in-depth vendor selection methodology and analysis using qualitative and quantitative research to forecast accurate market growth.
Table of Contents
1 Executive Summary
- 1.1 Market overview
- Executive Summary - Chart on Market Overview
- Executive Summary - Data Table on Market Overview
- Executive Summary - Chart on Global Market Characteristics
- Executive Summary - Chart on Market By Geographical Landscape
- Executive Summary - Chart on Market Segmentation by End-user
- Executive Summary - Chart on Market Segmentation by Platform
- Executive Summary - Chart on Market Segmentation by Objective
- Executive Summary - Chart on Incremental Growth
- Executive Summary - Data Table on Incremental Growth
- Executive Summary - Chart on Company Market Positioning
2 Technavio Analysis
- 2.1 Analysis of price sensitivity, lifecycle, customer purchase basket, adoption rates, and purchase criteria
- Analysis of price sensitivity, lifecycle, customer purchase basket, adoption rates, and purchase criteria
- 2.2 Criticality of inputs and Factors of differentiation
- Overview on criticality of inputs and factors of differentiation
- 2.3 Factors of disruption
- Overview on factors of disruption
- 2.4 Impact of drivers and challenges
- Impact of drivers and challenges in 2024 and 2029
3 Market Landscape
- 3.1 Market ecosystem
- Parent Market
- Data Table on - Parent Market
- 3.2 Market characteristics
- Market characteristics analysis
- 3.3 Value chain analysis
- Value chain analysis
4 Market Sizing
- 4.1 Market definition
- Offerings of companies included in the market definition
- 4.2 Market segment analysis
- Market segments
- 4.3 Market size 2024
- 4.4 Market outlook: Forecast for 2024-2029
- Chart on Global - Market size and forecast 2024-2029 ($ million)
- Data Table on Global - Market size and forecast 2024-2029 ($ million)
- Chart on Global Market: Year-over-year growth 2024-2029 (%)
- Data Table on Global Market: Year-over-year growth 2024-2029 (%)
5 Historic Market Size
- 5.1 Global Content Marketing Market 2019 - 2023
- Historic Market Size - Data Table on Global Content Marketing Market 2019 - 2023 ($ million)
- 5.2 End-user segment analysis 2019 - 2023
- Historic Market Size - End-user Segment 2019 - 2023 ($ million)
- 5.3 Platform segment analysis 2019 - 2023
- Historic Market Size - Platform Segment 2019 - 2023 ($ million)
- 5.4 Objective segment analysis 2019 - 2023
- Historic Market Size - Objective Segment 2019 - 2023 ($ million)
- 5.5 Geography segment analysis 2019 - 2023
- Historic Market Size - Geography Segment 2019 - 2023 ($ million)
- 5.6 Country segment analysis 2019 - 2023
- Historic Market Size - Country Segment 2019 - 2023 ($ million)
6 Qualitative Analysis
- 6.1 The impact of AI in Global Content Marketing Market
7 Five Forces Analysis
- 7.1 Five forces summary
- Five forces analysis - Comparison between 2024 and 2029
- 7.2 Bargaining power of buyers
- Bargaining power of buyers - Impact of key factors 2024 and 2029
- 7.3 Bargaining power of suppliers
- Bargaining power of suppliers - Impact of key factors in 2024 and 2029
- 7.4 Threat of new entrants
- Threat of new entrants - Impact of key factors in 2024 and 2029
- 7.5 Threat of substitutes
- Threat of substitutes - Impact of key factors in 2024 and 2029
- 7.6 Threat of rivalry
- Threat of rivalry - Impact of key factors in 2024 and 2029
- 7.7 Market condition
- Chart on Market condition - Five forces 2024 and 2029
8 Market Segmentation by End-user
- 8.1 Market segments
- Chart on End-user - Market share 2024-2029 (%)
- Data Table on End-user - Market share 2024-2029 (%)
- 8.2 Comparison by End-user
- Chart on Comparison by End-user
- Data Table on Comparison by End-user
- 8.3 Retail - Market size and forecast 2024-2029
- Chart on Retail - Market size and forecast 2024-2029 ($ million)
- Data Table on Retail - Market size and forecast 2024-2029 ($ million)
- Chart on Retail - Year-over-year growth 2024-2029 (%)
- Data Table on Retail - Year-over-year growth 2024-2029 (%)
- 8.4 Automotive - Market size and forecast 2024-2029
- Chart on Automotive - Market size and forecast 2024-2029 ($ million)
- Data Table on Automotive - Market size and forecast 2024-2029 ($ million)
- Chart on Automotive - Year-over-year growth 2024-2029 (%)
- Data Table on Automotive - Year-over-year growth 2024-2029 (%)
- 8.5 Financial services - Market size and forecast 2024-2029
- Chart on Financial services - Market size and forecast 2024-2029 ($ million)
- Data Table on Financial services - Market size and forecast 2024-2029 ($ million)
- Chart on Financial services - Year-over-year growth 2024-2029 (%)
- Data Table on Financial services - Year-over-year growth 2024-2029 (%)
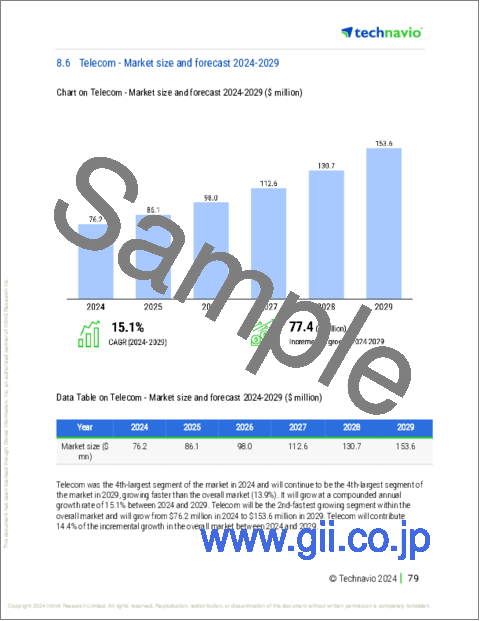
- 8.6 Telecom - Market size and forecast 2024-2029
- Chart on Telecom - Market size and forecast 2024-2029 ($ million)
- Data Table on Telecom - Market size and forecast 2024-2029 ($ million)
- Chart on Telecom - Year-over-year growth 2024-2029 (%)
- Data Table on Telecom - Year-over-year growth 2024-2029 (%)
- 8.7 Others - Market size and forecast 2024-2029
- Chart on Others - Market size and forecast 2024-2029 ($ million)
- Data Table on Others - Market size and forecast 2024-2029 ($ million)
- Chart on Others - Year-over-year growth 2024-2029 (%)
- Data Table on Others - Year-over-year growth 2024-2029 (%)
- 8.8 Market opportunity by End-user
- Market opportunity by End-user ($ million)
- Data Table on Market opportunity by End-user ($ million)
9 Market Segmentation by Platform
- 9.1 Market segments
- Chart on Platform - Market share 2024-2029 (%)
- Data Table on Platform - Market share 2024-2029 (%)
- 9.2 Comparison by Platform
- Chart on Comparison by Platform
- Data Table on Comparison by Platform
- 9.3 Blogging - Market size and forecast 2024-2029
- Chart on Blogging - Market size and forecast 2024-2029 ($ million)
- Data Table on Blogging - Market size and forecast 2024-2029 ($ million)
- Chart on Blogging - Year-over-year growth 2024-2029 (%)
- Data Table on Blogging - Year-over-year growth 2024-2029 (%)
- 9.4 Videos - Market size and forecast 2024-2029
- Chart on Videos - Market size and forecast 2024-2029 ($ million)
- Data Table on Videos - Market size and forecast 2024-2029 ($ million)
- Chart on Videos - Year-over-year growth 2024-2029 (%)
- Data Table on Videos - Year-over-year growth 2024-2029 (%)
- 9.5 Infographics - Market size and forecast 2024-2029
- Chart on Infographics - Market size and forecast 2024-2029 ($ million)
- Data Table on Infographics - Market size and forecast 2024-2029 ($ million)
- Chart on Infographics - Year-over-year growth 2024-2029 (%)
- Data Table on Infographics - Year-over-year growth 2024-2029 (%)
- 9.6 Case studies - Market size and forecast 2024-2029
- Chart on Case studies - Market size and forecast 2024-2029 ($ million)
- Data Table on Case studies - Market size and forecast 2024-2029 ($ million)
- Chart on Case studies - Year-over-year growth 2024-2029 (%)
- Data Table on Case studies - Year-over-year growth 2024-2029 (%)
- 9.7 Others - Market size and forecast 2024-2029
- Chart on Others - Market size and forecast 2024-2029 ($ million)
- Data Table on Others - Market size and forecast 2024-2029 ($ million)
- Chart on Others - Year-over-year growth 2024-2029 (%)
- Data Table on Others - Year-over-year growth 2024-2029 (%)
- 9.8 Market opportunity by Platform
- Market opportunity by Platform ($ million)
- Data Table on Market opportunity by Platform ($ million)
10 Market Segmentation by Objective
- 10.1 Market segments
- Chart on Objective - Market share 2024-2029 (%)
- Data Table on Objective - Market share 2024-2029 (%)
- 10.2 Comparison by Objective
- Chart on Comparison by Objective
- Data Table on Comparison by Objective
- 10.3 Lead generation - Market size and forecast 2024-2029
- Chart on Lead generation - Market size and forecast 2024-2029 ($ million)
- Data Table on Lead generation - Market size and forecast 2024-2029 ($ million)
- Chart on Lead generation - Year-over-year growth 2024-2029 (%)
- Data Table on Lead generation - Year-over-year growth 2024-2029 (%)
- 10.4 Brand awareness - Market size and forecast 2024-2029
- Chart on Brand awareness - Market size and forecast 2024-2029 ($ million)
- Data Table on Brand awareness - Market size and forecast 2024-2029 ($ million)
- Chart on Brand awareness - Year-over-year growth 2024-2029 (%)
- Data Table on Brand awareness - Year-over-year growth 2024-2029 (%)
- 10.5 Thought leadership - Market size and forecast 2024-2029
- Chart on Thought leadership - Market size and forecast 2024-2029 ($ million)
- Data Table on Thought leadership - Market size and forecast 2024-2029 ($ million)
- Chart on Thought leadership - Year-over-year growth 2024-2029 (%)
- Data Table on Thought leadership - Year-over-year growth 2024-2029 (%)
- 10.6 Others - Market size and forecast 2024-2029
- Chart on Others - Market size and forecast 2024-2029 ($ million)
- Data Table on Others - Market size and forecast 2024-2029 ($ million)
- Chart on Others - Year-over-year growth 2024-2029 (%)
- Data Table on Others - Year-over-year growth 2024-2029 (%)
- 10.7 Market opportunity by Objective
- Market opportunity by Objective ($ million)
- Data Table on Market opportunity by Objective ($ million)
11 Customer Landscape
- 11.1 Customer landscape overview
- Analysis of price sensitivity, lifecycle, customer purchase basket, adoption rates, and purchase criteria
12 Geographic Landscape
- 12.1 Geographic segmentation
- Chart on Market share By Geographical Landscape 2024-2029 (%)
- Data Table on Market share By Geographical Landscape 2024-2029 (%)
- 12.2 Geographic comparison
- Chart on Geographic comparison
- Data Table on Geographic comparison
- 12.3 APAC - Market size and forecast 2024-2029
- Chart on APAC - Market size and forecast 2024-2029 ($ million)
- Data Table on APAC - Market size and forecast 2024-2029 ($ million)
- Chart on APAC - Year-over-year growth 2024-2029 (%)
- Data Table on APAC - Year-over-year growth 2024-2029 (%)
- 12.4 North America - Market size and forecast 2024-2029
- Chart on North America - Market size and forecast 2024-2029 ($ million)
- Data Table on North America - Market size and forecast 2024-2029 ($ million)
- Chart on North America - Year-over-year growth 2024-2029 (%)
- Data Table on North America - Year-over-year growth 2024-2029 (%)
- 12.5 Europe - Market size and forecast 2024-2029
- Chart on Europe - Market size and forecast 2024-2029 ($ million)
- Data Table on Europe - Market size and forecast 2024-2029 ($ million)
- Chart on Europe - Year-over-year growth 2024-2029 (%)
- Data Table on Europe - Year-over-year growth 2024-2029 (%)
- 12.6 South America - Market size and forecast 2024-2029
- Chart on South America - Market size and forecast 2024-2029 ($ million)
- Data Table on South America - Market size and forecast 2024-2029 ($ million)
- Chart on South America - Year-over-year growth 2024-2029 (%)
- Data Table on South America - Year-over-year growth 2024-2029 (%)
- 12.7 Middle East and Africa - Market size and forecast 2024-2029
- Chart on Middle East and Africa - Market size and forecast 2024-2029 ($ million)
- Data Table on Middle East and Africa - Market size and forecast 2024-2029 ($ million)
- Chart on Middle East and Africa - Year-over-year growth 2024-2029 (%)
- Data Table on Middle East and Africa - Year-over-year growth 2024-2029 (%)
- 12.8 US - Market size and forecast 2024-2029
- Chart on US - Market size and forecast 2024-2029 ($ million)
- Data Table on US - Market size and forecast 2024-2029 ($ million)
- Chart on US - Year-over-year growth 2024-2029 (%)
- Data Table on US - Year-over-year growth 2024-2029 (%)
- 12.9 China - Market size and forecast 2024-2029
- Chart on China - Market size and forecast 2024-2029 ($ million)
- Data Table on China - Market size and forecast 2024-2029 ($ million)
- Chart on China - Year-over-year growth 2024-2029 (%)
- Data Table on China - Year-over-year growth 2024-2029 (%)
- 12.10 Japan - Market size and forecast 2024-2029
- Chart on Japan - Market size and forecast 2024-2029 ($ million)
- Data Table on Japan - Market size and forecast 2024-2029 ($ million)
- Chart on Japan - Year-over-year growth 2024-2029 (%)
- Data Table on Japan - Year-over-year growth 2024-2029 (%)
- 12.11 Germany - Market size and forecast 2024-2029
- Chart on Germany - Market size and forecast 2024-2029 ($ million)
- Data Table on Germany - Market size and forecast 2024-2029 ($ million)
- Chart on Germany - Year-over-year growth 2024-2029 (%)
- Data Table on Germany - Year-over-year growth 2024-2029 (%)
- 12.12 Canada - Market size and forecast 2024-2029
- Chart on Canada - Market size and forecast 2024-2029 ($ million)
- Data Table on Canada - Market size and forecast 2024-2029 ($ million)
- Chart on Canada - Year-over-year growth 2024-2029 (%)
- Data Table on Canada - Year-over-year growth 2024-2029 (%)
- 12.13 India - Market size and forecast 2024-2029
- Chart on India - Market size and forecast 2024-2029 ($ million)
- Data Table on India - Market size and forecast 2024-2029 ($ million)
- Chart on India - Year-over-year growth 2024-2029 (%)
- Data Table on India - Year-over-year growth 2024-2029 (%)
- 12.14 Brazil - Market size and forecast 2024-2029
- Chart on Brazil - Market size and forecast 2024-2029 ($ million)
- Data Table on Brazil - Market size and forecast 2024-2029 ($ million)
- Chart on Brazil - Year-over-year growth 2024-2029 (%)
- Data Table on Brazil - Year-over-year growth 2024-2029 (%)
- 12.15 Saudi Arabia - Market size and forecast 2024-2029
- Chart on Saudi Arabia - Market size and forecast 2024-2029 ($ million)
- Data Table on Saudi Arabia - Market size and forecast 2024-2029 ($ million)
- Chart on Saudi Arabia - Year-over-year growth 2024-2029 (%)
- Data Table on Saudi Arabia - Year-over-year growth 2024-2029 (%)
- 12.16 Argentina - Market size and forecast 2024-2029
- Chart on Argentina - Market size and forecast 2024-2029 ($ million)
- Data Table on Argentina - Market size and forecast 2024-2029 ($ million)
- Chart on Argentina - Year-over-year growth 2024-2029 (%)
- Data Table on Argentina - Year-over-year growth 2024-2029 (%)
- 12.17 UAE - Market size and forecast 2024-2029
- Chart on UAE - Market size and forecast 2024-2029 ($ million)
- Data Table on UAE - Market size and forecast 2024-2029 ($ million)
- Chart on UAE - Year-over-year growth 2024-2029 (%)
- Data Table on UAE - Year-over-year growth 2024-2029 (%)
- 12.18 Market opportunity By Geographical Landscape
- Market opportunity By Geographical Landscape ($ million)
- Data Tables on Market opportunity By Geographical Landscape ($ million)
13 Drivers, Challenges, and Opportunity/Restraints
- 13.1 Market drivers
- 13.2 Market challenges
- 13.3 Impact of drivers and challenges
- Impact of drivers and challenges in 2024 and 2029
- 13.4 Market opportunities/restraints
14 Competitive Landscape
- 14.1 Overview
- 14.2 Competitive Landscape
- Overview on criticality of inputs and factors of differentiation
- 14.3 Landscape disruption
- Overview on factors of disruption
- 14.4 Industry risks
- Impact of key risks on business
15 Competitive Analysis
- 15.1 Companies profiled
- Companies covered
- 15.2 Company ranking index
- Company ranking index
- 15.3 Market positioning of companies
- Matrix on companies position and classification
- 15.4 Adobe Inc.
- Adobe Inc. - Overview
- Adobe Inc. - Business segments
- Adobe Inc. - Key news
- Adobe Inc. - Key offerings
- Adobe Inc. - Segment focus
- SWOT
- 15.5 Alma Media Corp.
- Alma Media Corp. - Overview
- Alma Media Corp. - Business segments
- Alma Media Corp. - Key offerings
- Alma Media Corp. - Segment focus
- SWOT
- 15.6 Brafton Inc.
- Brafton Inc. - Overview
- Brafton Inc. - Product / Service
- Brafton Inc. - Key offerings
- SWOT
- 15.7 Contently Inc.
- Contently Inc. - Overview
- Contently Inc. - Product / Service
- Contently Inc. - Key offerings
- SWOT
- 15.8 Contentoo B.V.
- Contentoo B.V. - Overview
- Contentoo B.V. - Product / Service
- Contentoo B.V. - Key offerings
- SWOT
- 15.9 CoSchedule LLC
- CoSchedule LLC - Overview
- CoSchedule LLC - Product / Service
- CoSchedule LLC - Key offerings
- SWOT
- 15.10 Eucalypt LLC
- Eucalypt LLC - Overview
- Eucalypt LLC - Product / Service
- Eucalypt LLC - Key offerings
- SWOT
- 15.11 Hootsuite Inc
- Hootsuite Inc - Overview
- Hootsuite Inc - Product / Service
- Hootsuite Inc - Key offerings
- SWOT
- 15.12 HubSpot Inc.
- HubSpot Inc. - Overview
- HubSpot Inc. - Product / Service
- HubSpot Inc. - Key news
- HubSpot Inc. - Key offerings
- SWOT
- 15.13 Influence and Co.
- Influence and Co. - Overview
- Influence and Co. - Product / Service
- Influence and Co. - Key offerings
- SWOT
- 15.14 Rock Content
- Rock Content - Overview
- Rock Content - Product / Service
- Rock Content - Key offerings
- SWOT
- 15.15 Seismic Software Inc.
- Seismic Software Inc. - Overview
- Seismic Software Inc. - Product / Service
- Seismic Software Inc. - Key offerings
- SWOT
- 15.16 Skyword Inc.
- Skyword Inc. - Overview
- Skyword Inc. - Product / Service
- Skyword Inc. - Key offerings
- SWOT
- 15.17 Sprinklr Inc.
- Sprinklr Inc. - Overview
- Sprinklr Inc. - Product / Service
- Sprinklr Inc. - Key offerings
- SWOT
- 15.18 Upland Software Inc.
- Upland Software Inc. - Overview
- Upland Software Inc. - Product / Service
- Upland Software Inc. - Key news
- Upland Software Inc. - Key offerings
- SWOT
16 Appendix
- 16.1 Scope of the report
- 16.2 Inclusions and exclusions checklist
- Inclusions checklist
- Exclusions checklist
- 16.3 Currency conversion rates for US$
- Currency conversion rates for US$
- 16.4 Research methodology
- Research methodology
- 16.5 Data procurement
- Information sources
- 16.6 Data validation
- Data validation
- 16.7 Validation techniques employed for market sizing
- Validation techniques employed for market sizing
- 16.8 Data synthesis
- Data synthesis
- 16.9 360 degree market analysis
- 360 degree market analysis
- 16.10 List of abbreviations
- List of abbreviations
