|
|
市場調査レポート
商品コード
1626289
創薬における人工知能の世界市場、2025~2029年Global Artificial Intelligence Market in Drug Discovery 2025-2029 |
||||||

|
|||||||
カスタマイズ可能
|
|||||||

| 創薬における人工知能の世界市場、2025~2029年 |
|
出版日: 2024年12月28日
発行: TechNavio
ページ情報: 英文 207 Pages
納期: 即納可能
|

全表示
- 概要
- 図表
- 目次
創薬における人工知能市場は2024~2029年に43億1,840万米ドル、予測期間中のCAGRは25.7%で成長すると予測されます。
当レポートでは、創薬における人工知能市場の全体的な分析、市場規模と予測、動向、成長促進要因、約25のベンダーを網羅したベンダー分析などを掲載しています。
現在の市場シナリオ、最新動向と促進要因、市場環境全体に関する最新分析を提供しています。市場は、資金調達の可能性、政府のイニシアティブ、バイオテクノロジーセグメントの拡大によって牽引されています。
| 市場範囲 | |
|---|---|
| 基準年 | 2025年 |
| 終了年 | 2029年 |
| 予測期間 | 2025~2029年 |
| 成長モメンタム | 加速 |
| 前年比[2025年] | 24.3% |
| CAGR | 25.7% |
| 増分額 | 43億1,840万米ドル |
本調査では、戦略的パートナーシップは、今後数年間の創薬人工知能市場の成長を促進する主要な理由の1つであると特定しています。また、製品の発売や技術革新は、市場の大きな需要につながります。
目次
第1章 エグゼクティブサマリー
- 市場概要
第2章 Technavio分析
- 価格・ライフサイクル・顧客購入バスケット・採用率・購入基準の分析
- インプットの重要性と差別化の要因
- 混乱の要因
- 促進要因と課題の影響
第3章 市場情勢
- 市場エコシステム
- 市場の特徴
- バリューチェーン分析
第4章 市場規模
- 市場の定義
- 市場セグメント分析
- 市場規模 2024年
- 市場の展望 2024~2029年
第5章 市場規模実績
- 創薬における人工知能の世界市場 2019~2023年
- 展開別セグメント分析 2019~2023年
- 治療領域セグメント分析 2019~2023年
- 地域別セグメント分析 2019~2023年
- 国別セグメント分析 2019~2023年
第6章 定性分析
- AIの影響-創薬における人工知能の世界市場
第7章 ファイブフォース分析
- ファイブフォースの要約
- 買い手の交渉力
- 供給企業の交渉力
- 新規参入業者の脅威
- 代替品の脅威
- 競争の脅威
- 市況
第8章 市場セグメンテーション:展開別
- 市場セグメント
- 比較:展開別
- クラウドベース:市場規模と予測 2024~2029年
- オンプレミス:市場規模と予測 2024~2029年
- 市場機会:展開別
第9章 市場セグメンテーション:治療領域別
- 市場セグメント
- 比較:治療領域別
- 腫瘍学:市場規模と予測 2024~2029年
- 感染症:市場規模と予測 2024~2029年
- 神経学:市場規模と予測 2024~2029年
- 代謝性疾患:市場規模と予測 2024~2029年
- その他:市場規模と予測 2024~2029年
- 市場機会:治療領域別
第10章 顧客情勢
- 顧客情勢概要
第11章 地域別情勢
- 地域別セグメンテーション
- 比較:地域別
- 北米:市場規模と予測 2024~2029年
- 欧州:市場規模と予測 2024~2029年
- アジア太平洋:市場規模と予測 2024~2029年
- 南米:市場規模と予測 2024~2029年
- 中東・アフリカ:市場規模と予測 2024~2029年
- 米国:市場規模と予測 2024~2029年
- 中国:市場規模と予測 2024~2029年
- 英国:市場規模と予測 2024~2029年
- ドイツ:市場規模と予測 2024~2029年
- カナダ:市場規模と予測 2024~2029年
- インド:市場規模と予測 2024~2029年
- オーストラリア:市場規模と予測 2024~2029年
- アラブ首長国連邦:市場規模と予測 2024~2029年
- フランス:市場規模と予測 2024~2029年
- 韓国:市場規模と予測 2024~2029年
- 地域情勢による市場機会
第12章 促進要因・課題・機会・抑制要因
- 市場促進要因
- 市場課題
- 促進要因と課題の影響
- 市場機会・抑制要因
第13章 競合情勢
- 概要
- 競合情勢
- 混乱の状況
- 産業のリスク
第14章 競合分析
- 企業プロファイル
- 企業ランキング指数
- 企業の市場ポジショニング
- Atomwise Inc.
- BenevolentAI
- C4X Discovery Holdings PLC
- Deep Genomics Inc.
- Enamine Ltd
- Evotec SE
- GNS Healthcare Inc.
- Insilico Medicine
- PathAI Inc.
- Phenomic AI Inc.
- Recursion Pharmaceuticals
- Roivant Sciences Ltd.
- Schrodinger Inc.
- Verge Analytics Inc.
- Zoetis Inc.
第15章 付録
Exhibits:
- Exhibits1: Executive Summary - Chart on Market Overview
- Exhibits2: Executive Summary - Data Table on Market Overview
- Exhibits3: Executive Summary - Chart on Global Market Characteristics
- Exhibits4: Executive Summary - Chart on Market By Geographical Landscape
- Exhibits5: Executive Summary - Chart on Market Segmentation by Deployment
- Exhibits6: Executive Summary - Chart on Market Segmentation by Therapeutic Area
- Exhibits7: Executive Summary - Chart on Incremental Growth
- Exhibits8: Executive Summary - Data Table on Incremental Growth
- Exhibits9: Executive Summary - Chart on Company Market Positioning
- Exhibits10: Analysis of price sensitivity, lifecycle, customer purchase basket, adoption rates, and purchase criteria
- Exhibits11: Overview on criticality of inputs and factors of differentiation
- Exhibits12: Overview on factors of disruption
- Exhibits13: Impact of drivers and challenges in 2024 and 2029
- Exhibits14: Parent Market
- Exhibits15: Data Table on - Parent Market
- Exhibits16: Market characteristics analysis
- Exhibits17: Value chain analysis
- Exhibits18: Offerings of companies included in the market definition
- Exhibits19: Market segments
- Exhibits20: Chart on Global - Market size and forecast 2024-2029 ($ million)
- Exhibits21: Data Table on Global - Market size and forecast 2024-2029 ($ million)
- Exhibits22: Chart on Global Market: Year-over-year growth 2024-2029 (%)
- Exhibits23: Data Table on Global Market: Year-over-year growth 2024-2029 (%)
- Exhibits24: Historic Market Size - Data Table on Global Artificial Intelligence Market In Drug Discovery 2019 - 2023 ($ million)
- Exhibits25: Historic Market Size - Deployment Segment 2019 - 2023 ($ million)
- Exhibits26: Historic Market Size - Therapeutic Area Segment 2019 - 2023 ($ million)
- Exhibits27: Historic Market Size - Geography Segment 2019 - 2023 ($ million)
- Exhibits28: Historic Market Size - Country Segment 2019 - 2023 ($ million)
- Exhibits29: Five forces analysis - Comparison between 2024 and 2029
- Exhibits30: Bargaining power of buyers - Impact of key factors 2024 and 2029
- Exhibits31: Bargaining power of suppliers - Impact of key factors in 2024 and 2029
- Exhibits32: Threat of new entrants - Impact of key factors in 2024 and 2029
- Exhibits33: Threat of substitutes - Impact of key factors in 2024 and 2029
- Exhibits34: Threat of rivalry - Impact of key factors in 2024 and 2029
- Exhibits35: Chart on Market condition - Five forces 2024 and 2029
- Exhibits36: Chart on Deployment - Market share 2024-2029 (%)
- Exhibits37: Data Table on Deployment - Market share 2024-2029 (%)
- Exhibits38: Chart on Comparison by Deployment
- Exhibits39: Data Table on Comparison by Deployment
- Exhibits40: Chart on Cloud-based - Market size and forecast 2024-2029 ($ million)
- Exhibits41: Data Table on Cloud-based - Market size and forecast 2024-2029 ($ million)
- Exhibits42: Chart on Cloud-based - Year-over-year growth 2024-2029 (%)
- Exhibits43: Data Table on Cloud-based - Year-over-year growth 2024-2029 (%)
- Exhibits44: Chart on On-premises - Market size and forecast 2024-2029 ($ million)
- Exhibits45: Data Table on On-premises - Market size and forecast 2024-2029 ($ million)
- Exhibits46: Chart on On-premises - Year-over-year growth 2024-2029 (%)
- Exhibits47: Data Table on On-premises - Year-over-year growth 2024-2029 (%)
- Exhibits48: Market opportunity by Deployment ($ million)
- Exhibits49: Data Table on Market opportunity by Deployment ($ million)
- Exhibits50: Chart on Therapeutic Area - Market share 2024-2029 (%)
- Exhibits51: Data Table on Therapeutic Area - Market share 2024-2029 (%)
- Exhibits52: Chart on Comparison by Therapeutic Area
- Exhibits53: Data Table on Comparison by Therapeutic Area
- Exhibits54: Chart on Oncology - Market size and forecast 2024-2029 ($ million)
- Exhibits55: Data Table on Oncology - Market size and forecast 2024-2029 ($ million)
- Exhibits56: Chart on Oncology - Year-over-year growth 2024-2029 (%)
- Exhibits57: Data Table on Oncology - Year-over-year growth 2024-2029 (%)
- Exhibits58: Chart on Infectious diseases - Market size and forecast 2024-2029 ($ million)
- Exhibits59: Data Table on Infectious diseases - Market size and forecast 2024-2029 ($ million)
- Exhibits60: Chart on Infectious diseases - Year-over-year growth 2024-2029 (%)
- Exhibits61: Data Table on Infectious diseases - Year-over-year growth 2024-2029 (%)
- Exhibits62: Chart on Neurology - Market size and forecast 2024-2029 ($ million)
- Exhibits63: Data Table on Neurology - Market size and forecast 2024-2029 ($ million)
- Exhibits64: Chart on Neurology - Year-over-year growth 2024-2029 (%)
- Exhibits65: Data Table on Neurology - Year-over-year growth 2024-2029 (%)
- Exhibits66: Chart on Metabolic diseases - Market size and forecast 2024-2029 ($ million)
- Exhibits67: Data Table on Metabolic diseases - Market size and forecast 2024-2029 ($ million)
- Exhibits68: Chart on Metabolic diseases - Year-over-year growth 2024-2029 (%)
- Exhibits69: Data Table on Metabolic diseases - Year-over-year growth 2024-2029 (%)
- Exhibits70: Chart on Others - Market size and forecast 2024-2029 ($ million)
- Exhibits71: Data Table on Others - Market size and forecast 2024-2029 ($ million)
- Exhibits72: Chart on Others - Year-over-year growth 2024-2029 (%)
- Exhibits73: Data Table on Others - Year-over-year growth 2024-2029 (%)
- Exhibits74: Market opportunity by Therapeutic Area ($ million)
- Exhibits75: Data Table on Market opportunity by Therapeutic Area ($ million)
- Exhibits76: Analysis of price sensitivity, lifecycle, customer purchase basket, adoption rates, and purchase criteria
- Exhibits77: Chart on Market share By Geographical Landscape 2024-2029 (%)
- Exhibits78: Data Table on Market share By Geographical Landscape 2024-2029 (%)
- Exhibits79: Chart on Geographic comparison
- Exhibits80: Data Table on Geographic comparison
- Exhibits81: Chart on North America - Market size and forecast 2024-2029 ($ million)
- Exhibits82: Data Table on North America - Market size and forecast 2024-2029 ($ million)
- Exhibits83: Chart on North America - Year-over-year growth 2024-2029 (%)
- Exhibits84: Data Table on North America - Year-over-year growth 2024-2029 (%)
- Exhibits85: Chart on Europe - Market size and forecast 2024-2029 ($ million)
- Exhibits86: Data Table on Europe - Market size and forecast 2024-2029 ($ million)
- Exhibits87: Chart on Europe - Year-over-year growth 2024-2029 (%)
- Exhibits88: Data Table on Europe - Year-over-year growth 2024-2029 (%)
- Exhibits89: Chart on APAC - Market size and forecast 2024-2029 ($ million)
- Exhibits90: Data Table on APAC - Market size and forecast 2024-2029 ($ million)
- Exhibits91: Chart on APAC - Year-over-year growth 2024-2029 (%)
- Exhibits92: Data Table on APAC - Year-over-year growth 2024-2029 (%)
- Exhibits93: Chart on South America - Market size and forecast 2024-2029 ($ million)
- Exhibits94: Data Table on South America - Market size and forecast 2024-2029 ($ million)
- Exhibits95: Chart on South America - Year-over-year growth 2024-2029 (%)
- Exhibits96: Data Table on South America - Year-over-year growth 2024-2029 (%)
- Exhibits97: Chart on Middle East and Africa - Market size and forecast 2024-2029 ($ million)
- Exhibits98: Data Table on Middle East and Africa - Market size and forecast 2024-2029 ($ million)
- Exhibits99: Chart on Middle East and Africa - Year-over-year growth 2024-2029 (%)
- Exhibits100: Data Table on Middle East and Africa - Year-over-year growth 2024-2029 (%)
- Exhibits101: Chart on US - Market size and forecast 2024-2029 ($ million)
- Exhibits102: Data Table on US - Market size and forecast 2024-2029 ($ million)
- Exhibits103: Chart on US - Year-over-year growth 2024-2029 (%)
- Exhibits104: Data Table on US - Year-over-year growth 2024-2029 (%)
- Exhibits105: Chart on China - Market size and forecast 2024-2029 ($ million)
- Exhibits106: Data Table on China - Market size and forecast 2024-2029 ($ million)
- Exhibits107: Chart on China - Year-over-year growth 2024-2029 (%)
- Exhibits108: Data Table on China - Year-over-year growth 2024-2029 (%)
- Exhibits109: Chart on UK - Market size and forecast 2024-2029 ($ million)
- Exhibits110: Data Table on UK - Market size and forecast 2024-2029 ($ million)
- Exhibits111: Chart on UK - Year-over-year growth 2024-2029 (%)
- Exhibits112: Data Table on UK - Year-over-year growth 2024-2029 (%)
- Exhibits113: Chart on Germany - Market size and forecast 2024-2029 ($ million)
- Exhibits114: Data Table on Germany - Market size and forecast 2024-2029 ($ million)
- Exhibits115: Chart on Germany - Year-over-year growth 2024-2029 (%)
- Exhibits116: Data Table on Germany - Year-over-year growth 2024-2029 (%)
- Exhibits117: Chart on Canada - Market size and forecast 2024-2029 ($ million)
- Exhibits118: Data Table on Canada - Market size and forecast 2024-2029 ($ million)
- Exhibits119: Chart on Canada - Year-over-year growth 2024-2029 (%)
- Exhibits120: Data Table on Canada - Year-over-year growth 2024-2029 (%)
- Exhibits121: Chart on India - Market size and forecast 2024-2029 ($ million)
- Exhibits122: Data Table on India - Market size and forecast 2024-2029 ($ million)
- Exhibits123: Chart on India - Year-over-year growth 2024-2029 (%)
- Exhibits124: Data Table on India - Year-over-year growth 2024-2029 (%)
- Exhibits125: Chart on Australia - Market size and forecast 2024-2029 ($ million)
- Exhibits126: Data Table on Australia - Market size and forecast 2024-2029 ($ million)
- Exhibits127: Chart on Australia - Year-over-year growth 2024-2029 (%)
- Exhibits128: Data Table on Australia - Year-over-year growth 2024-2029 (%)
- Exhibits129: Chart on UAE - Market size and forecast 2024-2029 ($ million)
- Exhibits130: Data Table on UAE - Market size and forecast 2024-2029 ($ million)
- Exhibits131: Chart on UAE - Year-over-year growth 2024-2029 (%)
- Exhibits132: Data Table on UAE - Year-over-year growth 2024-2029 (%)
- Exhibits133: Chart on France - Market size and forecast 2024-2029 ($ million)
- Exhibits134: Data Table on France - Market size and forecast 2024-2029 ($ million)
- Exhibits135: Chart on France - Year-over-year growth 2024-2029 (%)
- Exhibits136: Data Table on France - Year-over-year growth 2024-2029 (%)
- Exhibits137: Chart on South Korea - Market size and forecast 2024-2029 ($ million)
- Exhibits138: Data Table on South Korea - Market size and forecast 2024-2029 ($ million)
- Exhibits139: Chart on South Korea - Year-over-year growth 2024-2029 (%)
- Exhibits140: Data Table on South Korea - Year-over-year growth 2024-2029 (%)
- Exhibits141: Market opportunity By Geographical Landscape ($ million)
- Exhibits142: Data Tables on Market opportunity By Geographical Landscape ($ million)
- Exhibits143: Impact of drivers and challenges in 2024 and 2029
- Exhibits144: Overview on criticality of inputs and factors of differentiation
- Exhibits145: Overview on factors of disruption
- Exhibits146: Impact of key risks on business
- Exhibits147: Companies covered
- Exhibits148: Company ranking index
- Exhibits149: Matrix on companies position and classification
- Exhibits150: Atomwise Inc. - Overview
- Exhibits151: Atomwise Inc. - Product / Service
- Exhibits152: Atomwise Inc. - Key offerings
- Exhibits153: SWOT
- Exhibits154: BenevolentAI - Overview
- Exhibits155: BenevolentAI - Product / Service
- Exhibits156: BenevolentAI - Key offerings
- Exhibits157: SWOT
- Exhibits158: C4X Discovery Holdings PLC - Overview
- Exhibits159: C4X Discovery Holdings PLC - Product / Service
- Exhibits160: C4X Discovery Holdings PLC - Key offerings
- Exhibits161: SWOT
- Exhibits162: Deep Genomics Inc. - Overview
- Exhibits163: Deep Genomics Inc. - Product / Service
- Exhibits164: Deep Genomics Inc. - Key offerings
- Exhibits165: SWOT
- Exhibits166: Enamine Ltd - Overview
- Exhibits167: Enamine Ltd - Product / Service
- Exhibits168: Enamine Ltd - Key offerings
- Exhibits169: SWOT
- Exhibits170: Evotec SE - Overview
- Exhibits171: Evotec SE - Business segments
- Exhibits172: Evotec SE - Key news
- Exhibits173: Evotec SE - Key offerings
- Exhibits174: Evotec SE - Segment focus
- Exhibits175: SWOT
- Exhibits176: GNS Healthcare Inc. - Overview
- Exhibits177: GNS Healthcare Inc. - Product / Service
- Exhibits178: GNS Healthcare Inc. - Key offerings
- Exhibits179: SWOT
- Exhibits180: Insilico Medicine - Overview
- Exhibits181: Insilico Medicine - Product / Service
- Exhibits182: Insilico Medicine - Key offerings
- Exhibits183: SWOT
- Exhibits184: PathAI Inc. - Overview
- Exhibits185: PathAI Inc. - Product / Service
- Exhibits186: PathAI Inc. - Key offerings
- Exhibits187: SWOT
- Exhibits188: Phenomic AI Inc. - Overview
- Exhibits189: Phenomic AI Inc. - Product / Service
- Exhibits190: Phenomic AI Inc. - Key offerings
- Exhibits191: SWOT
- Exhibits192: Recursion Pharmaceuticals - Overview
- Exhibits193: Recursion Pharmaceuticals - Product / Service
- Exhibits194: Recursion Pharmaceuticals - Key offerings
- Exhibits195: SWOT
- Exhibits196: Roivant Sciences Ltd. - Overview
- Exhibits197: Roivant Sciences Ltd. - Product / Service
- Exhibits198: Roivant Sciences Ltd. - Key offerings
- Exhibits199: SWOT
- Exhibits200: Schrodinger Inc. - Overview
- Exhibits201: Schrodinger Inc. - Business segments
- Exhibits202: Schrodinger Inc. - Key offerings
- Exhibits203: Schrodinger Inc. - Segment focus
- Exhibits204: SWOT
- Exhibits205: Verge Analytics Inc. - Overview
- Exhibits206: Verge Analytics Inc. - Product / Service
- Exhibits207: Verge Analytics Inc. - Key offerings
- Exhibits208: SWOT
- Exhibits209: Zoetis Inc. - Overview
- Exhibits210: Zoetis Inc. - Business segments
- Exhibits211: Zoetis Inc. - Key news
- Exhibits212: Zoetis Inc. - Key offerings
- Exhibits213: Zoetis Inc. - Segment focus
- Exhibits214: SWOT
- Exhibits215: Inclusions checklist
- Exhibits216: Exclusions checklist
- Exhibits217: Currency conversion rates for US$
- Exhibits218: Research methodology
- Exhibits219: Information sources
- Exhibits220: Data validation
- Exhibits221: Validation techniques employed for market sizing
- Exhibits222: Data synthesis
- Exhibits223: 360 degree market analysis
- Exhibits224: List of abbreviations
Artificial Intelligence In Drug Discovery Market 2025-2029
The artificial intelligence in drug discovery market is forecasted to grow by USD 4318.4 mn during 2024-2029, accelerating at a CAGR of 25.7% during the forecast period. The report on the artificial intelligence in drug discovery market provides a holistic analysis, market size and forecast, trends, growth drivers, and challenges, as well as vendor analysis covering around 25 vendors.
The report offers an up-to-date analysis regarding the current market scenario, the latest trends and drivers, and the overall market environment. The market is driven by availability of funding, government initiatives, and expansion of biotechnology sector.
| Market Scope | |
|---|---|
| Base Year | 2025 |
| End Year | 2029 |
| Series Year | 2025-2029 |
| Growth Momentum | Accelerate |
| YOY 2025 | 24.3% |
| CAGR | 25.7% |
| Incremental Value | $4318.4 mn |
Technavio's artificial intelligence in drug discovery market is segmented as below:
By Deployment
- Cloud-based
- On-premises
By Therapeutic Area
- Oncology
- Infectious diseases
- Neurology
- Metabolic diseases
- Others
By Geographical Landscape
- North America
- Europe
- APAC
- South America
- Middle East and Africa
This study identifies the strategic partnerships as one of the prime reasons driving the artificial intelligence in drug discovery market growth during the next few years. Also, product launches and technological innovations will lead to sizable demand in the market.
The report on the artificial intelligence in drug discovery market covers the following areas:
- Artificial Intelligence In Drug Discovery Market sizing
- Artificial Intelligence In Drug Discovery Market forecast
- Artificial Intelligence In Drug Discovery Market industry analysis
The robust vendor analysis is designed to help clients improve their market position, and in line with this, this report provides a detailed analysis of several leading artificial intelligence in drug discovery market vendors that include Atomwise Inc., BenevolentAI, C4X Discovery Holdings PLC, Deep Genomics Inc., Enamine Ltd, Evotec SE, GNS Healthcare Inc., Insilico Medicine, PathAI Inc., Phenomic AI Inc., Recursion Pharmaceuticals, Roivant Sciences Ltd., Schrodinger Inc., Verge Analytics Inc., and Zoetis Inc.. Also, the artificial intelligence in drug discovery market analysis report includes information on upcoming trends and challenges that will influence market growth. This is to help companies strategize and leverage all forthcoming growth opportunities.
The study was conducted using an objective combination of primary and secondary information including inputs from key participants in the industry. The report contains a comprehensive market and vendor landscape in addition to an analysis of the key vendors.
The publisher presents a detailed picture of the market by the way of study, synthesis, and summation of data from multiple sources by an analysis of key parameters such as profit, pricing, competition, and promotions. It presents various market facets by identifying the key industry influencers. The data presented is comprehensive, reliable, and a result of extensive primary and secondary research. The market research reports provide a complete competitive landscape and an in-depth vendor selection methodology and analysis using qualitative and quantitative research to forecast accurate market growth.
Table of Contents
1 Executive Summary
- 1.1 Market overview
- Executive Summary - Chart on Market Overview
- Executive Summary - Data Table on Market Overview
- Executive Summary - Chart on Global Market Characteristics
- Executive Summary - Chart on Market By Geographical Landscape
- Executive Summary - Chart on Market Segmentation by Deployment
- Executive Summary - Chart on Market Segmentation by Therapeutic Area
- Executive Summary - Chart on Incremental Growth
- Executive Summary - Data Table on Incremental Growth
- Executive Summary - Chart on Company Market Positioning
2 Technavio Analysis
- 2.1 Analysis of price sensitivity, lifecycle, customer purchase basket, adoption rates, and purchase criteria
- Analysis of price sensitivity, lifecycle, customer purchase basket, adoption rates, and purchase criteria
- 2.2 Criticality of inputs and Factors of differentiation
- Overview on criticality of inputs and factors of differentiation
- 2.3 Factors of disruption
- Overview on factors of disruption
- 2.4 Impact of drivers and challenges
- Impact of drivers and challenges in 2024 and 2029
3 Market Landscape
- 3.1 Market ecosystem
- Parent Market
- Data Table on - Parent Market
- 3.2 Market characteristics
- Market characteristics analysis
- 3.3 Value chain analysis
- Value chain analysis
4 Market Sizing
- 4.1 Market definition
- Offerings of companies included in the market definition
- 4.2 Market segment analysis
- Market segments
- 4.3 Market size 2024
- 4.4 Market outlook: Forecast for 2024-2029
- Chart on Global - Market size and forecast 2024-2029 ($ million)
- Data Table on Global - Market size and forecast 2024-2029 ($ million)
- Chart on Global Market: Year-over-year growth 2024-2029 (%)
- Data Table on Global Market: Year-over-year growth 2024-2029 (%)
5 Historic Market Size
- 5.1 Global Artificial Intelligence Market In Drug Discovery 2019 - 2023
- Historic Market Size - Data Table on Global Artificial Intelligence Market In Drug Discovery 2019 - 2023 ($ million)
- 5.2 Deployment segment analysis 2019 - 2023
- Historic Market Size - Deployment Segment 2019 - 2023 ($ million)
- 5.3 Therapeutic Area segment analysis 2019 - 2023
- Historic Market Size - Therapeutic Area Segment 2019 - 2023 ($ million)
- 5.4 Geography segment analysis 2019 - 2023
- Historic Market Size - Geography Segment 2019 - 2023 ($ million)
- 5.5 Country segment analysis 2019 - 2023
- Historic Market Size - Country Segment 2019 - 2023 ($ million)
6 Qualitative Analysis
- 6.1 Impact of AI in the Global Artificial Intelligence Market in Drug Discovery
7 Five Forces Analysis
- 7.1 Five forces summary
- Five forces analysis - Comparison between 2024 and 2029
- 7.2 Bargaining power of buyers
- Bargaining power of buyers - Impact of key factors 2024 and 2029
- 7.3 Bargaining power of suppliers
- Bargaining power of suppliers - Impact of key factors in 2024 and 2029
- 7.4 Threat of new entrants
- Threat of new entrants - Impact of key factors in 2024 and 2029
- 7.5 Threat of substitutes
- Threat of substitutes - Impact of key factors in 2024 and 2029
- 7.6 Threat of rivalry
- Threat of rivalry - Impact of key factors in 2024 and 2029
- 7.7 Market condition
- Chart on Market condition - Five forces 2024 and 2029
8 Market Segmentation by Deployment
- 8.1 Market segments
- Chart on Deployment - Market share 2024-2029 (%)
- Data Table on Deployment - Market share 2024-2029 (%)
- 8.2 Comparison by Deployment
- Chart on Comparison by Deployment
- Data Table on Comparison by Deployment
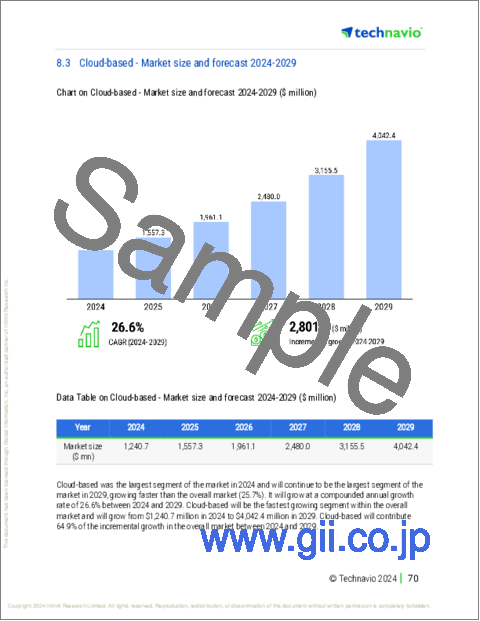
- 8.3 Cloud-based - Market size and forecast 2024-2029
- Chart on Cloud-based - Market size and forecast 2024-2029 ($ million)
- Data Table on Cloud-based - Market size and forecast 2024-2029 ($ million)
- Chart on Cloud-based - Year-over-year growth 2024-2029 (%)
- Data Table on Cloud-based - Year-over-year growth 2024-2029 (%)
- 8.4 On-premises - Market size and forecast 2024-2029
- Chart on On-premises - Market size and forecast 2024-2029 ($ million)
- Data Table on On-premises - Market size and forecast 2024-2029 ($ million)
- Chart on On-premises - Year-over-year growth 2024-2029 (%)
- Data Table on On-premises - Year-over-year growth 2024-2029 (%)
- 8.5 Market opportunity by Deployment
- Market opportunity by Deployment ($ million)
- Data Table on Market opportunity by Deployment ($ million)
9 Market Segmentation by Therapeutic Area
- 9.1 Market segments
- Chart on Therapeutic Area - Market share 2024-2029 (%)
- Data Table on Therapeutic Area - Market share 2024-2029 (%)
- 9.2 Comparison by Therapeutic Area
- Chart on Comparison by Therapeutic Area
- Data Table on Comparison by Therapeutic Area
- 9.3 Oncology - Market size and forecast 2024-2029
- Chart on Oncology - Market size and forecast 2024-2029 ($ million)
- Data Table on Oncology - Market size and forecast 2024-2029 ($ million)
- Chart on Oncology - Year-over-year growth 2024-2029 (%)
- Data Table on Oncology - Year-over-year growth 2024-2029 (%)
- 9.4 Infectious diseases - Market size and forecast 2024-2029
- Chart on Infectious diseases - Market size and forecast 2024-2029 ($ million)
- Data Table on Infectious diseases - Market size and forecast 2024-2029 ($ million)
- Chart on Infectious diseases - Year-over-year growth 2024-2029 (%)
- Data Table on Infectious diseases - Year-over-year growth 2024-2029 (%)
- 9.5 Neurology - Market size and forecast 2024-2029
- Chart on Neurology - Market size and forecast 2024-2029 ($ million)
- Data Table on Neurology - Market size and forecast 2024-2029 ($ million)
- Chart on Neurology - Year-over-year growth 2024-2029 (%)
- Data Table on Neurology - Year-over-year growth 2024-2029 (%)
- 9.6 Metabolic diseases - Market size and forecast 2024-2029
- Chart on Metabolic diseases - Market size and forecast 2024-2029 ($ million)
- Data Table on Metabolic diseases - Market size and forecast 2024-2029 ($ million)
- Chart on Metabolic diseases - Year-over-year growth 2024-2029 (%)
- Data Table on Metabolic diseases - Year-over-year growth 2024-2029 (%)
- 9.7 Others - Market size and forecast 2024-2029
- Chart on Others - Market size and forecast 2024-2029 ($ million)
- Data Table on Others - Market size and forecast 2024-2029 ($ million)
- Chart on Others - Year-over-year growth 2024-2029 (%)
- Data Table on Others - Year-over-year growth 2024-2029 (%)
- 9.8 Market opportunity by Therapeutic Area
- Market opportunity by Therapeutic Area ($ million)
- Data Table on Market opportunity by Therapeutic Area ($ million)
10 Customer Landscape
- 10.1 Customer landscape overview
- Analysis of price sensitivity, lifecycle, customer purchase basket, adoption rates, and purchase criteria
11 Geographic Landscape
- 11.1 Geographic segmentation
- Chart on Market share By Geographical Landscape 2024-2029 (%)
- Data Table on Market share By Geographical Landscape 2024-2029 (%)
- 11.2 Geographic comparison
- Chart on Geographic comparison
- Data Table on Geographic comparison
- 11.3 North America - Market size and forecast 2024-2029
- Chart on North America - Market size and forecast 2024-2029 ($ million)
- Data Table on North America - Market size and forecast 2024-2029 ($ million)
- Chart on North America - Year-over-year growth 2024-2029 (%)
- Data Table on North America - Year-over-year growth 2024-2029 (%)
- 11.4 Europe - Market size and forecast 2024-2029
- Chart on Europe - Market size and forecast 2024-2029 ($ million)
- Data Table on Europe - Market size and forecast 2024-2029 ($ million)
- Chart on Europe - Year-over-year growth 2024-2029 (%)
- Data Table on Europe - Year-over-year growth 2024-2029 (%)
- 11.5 APAC - Market size and forecast 2024-2029
- Chart on APAC - Market size and forecast 2024-2029 ($ million)
- Data Table on APAC - Market size and forecast 2024-2029 ($ million)
- Chart on APAC - Year-over-year growth 2024-2029 (%)
- Data Table on APAC - Year-over-year growth 2024-2029 (%)
- 11.6 South America - Market size and forecast 2024-2029
- Chart on South America - Market size and forecast 2024-2029 ($ million)
- Data Table on South America - Market size and forecast 2024-2029 ($ million)
- Chart on South America - Year-over-year growth 2024-2029 (%)
- Data Table on South America - Year-over-year growth 2024-2029 (%)
- 11.7 Middle East and Africa - Market size and forecast 2024-2029
- Chart on Middle East and Africa - Market size and forecast 2024-2029 ($ million)
- Data Table on Middle East and Africa - Market size and forecast 2024-2029 ($ million)
- Chart on Middle East and Africa - Year-over-year growth 2024-2029 (%)
- Data Table on Middle East and Africa - Year-over-year growth 2024-2029 (%)
- 11.8 US - Market size and forecast 2024-2029
- Chart on US - Market size and forecast 2024-2029 ($ million)
- Data Table on US - Market size and forecast 2024-2029 ($ million)
- Chart on US - Year-over-year growth 2024-2029 (%)
- Data Table on US - Year-over-year growth 2024-2029 (%)
- 11.9 China - Market size and forecast 2024-2029
- Chart on China - Market size and forecast 2024-2029 ($ million)
- Data Table on China - Market size and forecast 2024-2029 ($ million)
- Chart on China - Year-over-year growth 2024-2029 (%)
- Data Table on China - Year-over-year growth 2024-2029 (%)
- 11.10 UK - Market size and forecast 2024-2029
- Chart on UK - Market size and forecast 2024-2029 ($ million)
- Data Table on UK - Market size and forecast 2024-2029 ($ million)
- Chart on UK - Year-over-year growth 2024-2029 (%)
- Data Table on UK - Year-over-year growth 2024-2029 (%)
- 11.11 Germany - Market size and forecast 2024-2029
- Chart on Germany - Market size and forecast 2024-2029 ($ million)
- Data Table on Germany - Market size and forecast 2024-2029 ($ million)
- Chart on Germany - Year-over-year growth 2024-2029 (%)
- Data Table on Germany - Year-over-year growth 2024-2029 (%)
- 11.12 Canada - Market size and forecast 2024-2029
- Chart on Canada - Market size and forecast 2024-2029 ($ million)
- Data Table on Canada - Market size and forecast 2024-2029 ($ million)
- Chart on Canada - Year-over-year growth 2024-2029 (%)
- Data Table on Canada - Year-over-year growth 2024-2029 (%)
- 11.13 India - Market size and forecast 2024-2029
- Chart on India - Market size and forecast 2024-2029 ($ million)
- Data Table on India - Market size and forecast 2024-2029 ($ million)
- Chart on India - Year-over-year growth 2024-2029 (%)
- Data Table on India - Year-over-year growth 2024-2029 (%)
- 11.14 Australia - Market size and forecast 2024-2029
- Chart on Australia - Market size and forecast 2024-2029 ($ million)
- Data Table on Australia - Market size and forecast 2024-2029 ($ million)
- Chart on Australia - Year-over-year growth 2024-2029 (%)
- Data Table on Australia - Year-over-year growth 2024-2029 (%)
- 11.15 UAE - Market size and forecast 2024-2029
- Chart on UAE - Market size and forecast 2024-2029 ($ million)
- Data Table on UAE - Market size and forecast 2024-2029 ($ million)
- Chart on UAE - Year-over-year growth 2024-2029 (%)
- Data Table on UAE - Year-over-year growth 2024-2029 (%)
- 11.16 France - Market size and forecast 2024-2029
- Chart on France - Market size and forecast 2024-2029 ($ million)
- Data Table on France - Market size and forecast 2024-2029 ($ million)
- Chart on France - Year-over-year growth 2024-2029 (%)
- Data Table on France - Year-over-year growth 2024-2029 (%)
- 11.17 South Korea - Market size and forecast 2024-2029
- Chart on South Korea - Market size and forecast 2024-2029 ($ million)
- Data Table on South Korea - Market size and forecast 2024-2029 ($ million)
- Chart on South Korea - Year-over-year growth 2024-2029 (%)
- Data Table on South Korea - Year-over-year growth 2024-2029 (%)
- 11.18 Market opportunity By Geographical Landscape
- Market opportunity By Geographical Landscape ($ million)
- Data Tables on Market opportunity By Geographical Landscape ($ million)
12 Drivers, Challenges, and Opportunity/Restraints
- 12.1 Market drivers
- 12.2 Market challenges
- 12.3 Impact of drivers and challenges
- Impact of drivers and challenges in 2024 and 2029
- 12.4 Market opportunities/restraints
13 Competitive Landscape
- 13.1 Overview
- 13.2 Competitive Landscape
- Overview on criticality of inputs and factors of differentiation
- 13.3 Landscape disruption
- Overview on factors of disruption
- 13.4 Industry risks
- Impact of key risks on business
14 Competitive Analysis
- 14.1 Companies profiled
- Companies covered
- 14.2 Company ranking index
- Company ranking index
- 14.3 Market positioning of companies
- Matrix on companies position and classification
- 14.4 Atomwise Inc.
- Atomwise Inc. - Overview
- Atomwise Inc. - Product / Service
- Atomwise Inc. - Key offerings
- SWOT
- 14.5 BenevolentAI
- BenevolentAI - Overview
- BenevolentAI - Product / Service
- BenevolentAI - Key offerings
- SWOT
- 14.6 C4X Discovery Holdings PLC
- C4X Discovery Holdings PLC - Overview
- C4X Discovery Holdings PLC - Product / Service
- C4X Discovery Holdings PLC - Key offerings
- SWOT
- 14.7 Deep Genomics Inc.
- Deep Genomics Inc. - Overview
- Deep Genomics Inc. - Product / Service
- Deep Genomics Inc. - Key offerings
- SWOT
- 14.8 Enamine Ltd
- Enamine Ltd - Overview
- Enamine Ltd - Product / Service
- Enamine Ltd - Key offerings
- SWOT
- 14.9 Evotec SE
- Evotec SE - Overview
- Evotec SE - Business segments
- Evotec SE - Key news
- Evotec SE - Key offerings
- Evotec SE - Segment focus
- SWOT
- 14.10 GNS Healthcare Inc.
- GNS Healthcare Inc. - Overview
- GNS Healthcare Inc. - Product / Service
- GNS Healthcare Inc. - Key offerings
- SWOT
- 14.11 Insilico Medicine
- Insilico Medicine - Overview
- Insilico Medicine - Product / Service
- Insilico Medicine - Key offerings
- SWOT
- 14.12 PathAI Inc.
- PathAI Inc. - Overview
- PathAI Inc. - Product / Service
- PathAI Inc. - Key offerings
- SWOT
- 14.13 Phenomic AI Inc.
- Phenomic AI Inc. - Overview
- Phenomic AI Inc. - Product / Service
- Phenomic AI Inc. - Key offerings
- SWOT
- 14.14 Recursion Pharmaceuticals
- Recursion Pharmaceuticals - Overview
- Recursion Pharmaceuticals - Product / Service
- Recursion Pharmaceuticals - Key offerings
- SWOT
- 14.15 Roivant Sciences Ltd.
- Roivant Sciences Ltd. - Overview
- Roivant Sciences Ltd. - Product / Service
- Roivant Sciences Ltd. - Key offerings
- SWOT
- 14.16 Schrodinger Inc.
- Schrodinger Inc. - Overview
- Schrodinger Inc. - Business segments
- Schrodinger Inc. - Key offerings
- Schrodinger Inc. - Segment focus
- SWOT
- 14.17 Verge Analytics Inc.
- Verge Analytics Inc. - Overview
- Verge Analytics Inc. - Product / Service
- Verge Analytics Inc. - Key offerings
- SWOT
- 14.18 Zoetis Inc.
- Zoetis Inc. - Overview
- Zoetis Inc. - Business segments
- Zoetis Inc. - Key news
- Zoetis Inc. - Key offerings
- Zoetis Inc. - Segment focus
- SWOT
15 Appendix
- 15.1 Scope of the report
- 15.2 Inclusions and exclusions checklist
- Inclusions checklist
- Exclusions checklist
- 15.3 Currency conversion rates for US$
- Currency conversion rates for US$
- 15.4 Research methodology
- Research methodology
- 15.5 Data procurement
- Information sources
- 15.6 Data validation
- Data validation
- 15.7 Validation techniques employed for market sizing
- Validation techniques employed for market sizing
- 15.8 Data synthesis
- Data synthesis
- 15.9 360 degree market analysis
- 360 degree market analysis
- 15.10 List of abbreviations
- List of abbreviations

