|
|
市場調査レポート
商品コード
1603981
従業員エンゲージメントソフトウェアの世界市場 (2024~2028年)Global Employee Engagement Software Market 2024-2028 |
||||||

|
|||||||
カスタマイズ可能
|
|||||||

| 従業員エンゲージメントソフトウェアの世界市場 (2024~2028年) |
|
出版日: 2024年10月24日
発行: TechNavio
ページ情報: 英文 131 Pages
納期: 即納可能
|

全表示
- 概要
- 図表
- 目次
従業員エンゲージメントソフトウェア市場 (2024~2028年)
従業員エンゲージメントソフトウェア市場は2023-2028年に3億2,590万米ドル分拡大し、予測期間中に6.8%のCAGRで成長すると予測されます。当レポートでは、従業員エンゲージメントソフトウェア市場の全体的な分析、市場規模・予測、動向、成長促進要因、課題、約25のベンダーを網羅したベンダー分析などを掲載しています。
当レポートでは、現在の市場シナリオ、最新動向と促進要因、市場環境全体に関する最新分析を提供しています。労働力多様性の管理の必要性、アジア太平洋での中小企業 (SME) と大企業の拡大、多国籍組織の増加などが市場を牽引しています。
| 市場範囲 | |
|---|---|
| 基準年 | 2024年 |
| 終了年 | 2028年 |
| 予測期間 | 2024~2028年 |
| 成長モメンタム | 加速 |
| 前年比 (2024年) | 6.3% |
| CAGR | 6.8% |
| 増分額 | 3億2,590万米ドル |
当レポートでは、今後数年間における従業員エンゲージメントソフトウェア市場の成長を促進する主な要因の1つとして、デジタル人事 (HR) テクノロジーの採用が増加していることを挙げています。また、クラウドベースの従業員エンゲージメントソフトウェアの展開が拡大し、アウトソーシング活動が活発化していることも、市場の大きな需要につながります。
目次
第1章 エグゼクティブサマリー
- 市場概要
第2章 市場情勢
- 市場エコシステム
- 市場の特徴
- バリューチェーン分析
第3章 市場規模
- 市場の定義
- 市場セグメント分析
- 市場規模 (2023年)
- 市場の見通し (2023~2028年)
第4章 市場規模実績
- 従業員エンゲージメントソフトウェアの世界市場 (2018~2022年)
- 展開方式別分析 (2018~2022年)
- 地域別分析 (2018~2022年)
- 国別分析 (2018~2022年)
第5章 ファイブフォース分析
- ファイブフォースの要約
- 買い手の交渉力
- 供給企業の交渉力
- 新規参入業者の脅威
- 代替品の脅威
- 競争の脅威
- 市況
第6章 市場セグメンテーション:展開方式別
- 市場セグメント
- 比較:展開方式別
- クラウドベース:市場規模と予測 (2023~2028年)
- オンプレミス:市場規模と予測 (2023~2028年)
- 市場機会:展開方式別
第7章 顧客情勢
- 顧客情勢の概要
第8章 地域別情勢
- 地域別セグメンテーション
- 地域別比較
- 北米:市場規模と予測 (2023~2028年)
- 欧州:市場規模と予測 (2023~2028年)
- アジア太平洋:市場規模と予測 (2023~2028年)
- 南米:市場規模と予測 (2023~2028年)
- 中東・アフリカ:市場規模と予測 (2023~2028年)
- 米国:市場規模と予測 (2023~2028年)
- 中国:市場規模と予測 (2023~2028年)
- 日本:市場規模と予測 (2023~2028年)
- ドイツ:市場規模と予測 (2023~2028年)
- 英国:市場規模と予測 (2023~2028年)
- 市場機会:地域別
第9章 促進要因・課題・機会・抑制要因
- 市場促進要因
- 市場の課題
- 促進要因と課題の影響
- 市場の機会・抑制要因
第10章 競合情勢
- 概要
- 競合情勢
- 混乱の状況
- 業界のリスク
第11章 競合分析
- 企業プロファイル
- 企業の市場ポジショニング
- Appreiz Inc.
- Bitrix24 Ltd
- Fond Technologies Inc.
- Gtmhub EOOD
- Interactive Happiness Survey AB
- Kudos Inc.
- Motivosity Inc.
- Qualtrics LLC
- Reward Gateway UK Ltd.
第12章 付録
Exhibits:
- Exhibits1: Executive Summary - Chart on Market Overview
- Exhibits2: Executive Summary - Data Table on Market Overview
- Exhibits3: Executive Summary - Chart on Global Market Characteristics
- Exhibits4: Executive Summary - Chart on Market By Geographical Landscape
- Exhibits5: Executive Summary - Chart on Market Segmentation by Deployment
- Exhibits6: Executive Summary - Chart on Incremental Growth
- Exhibits7: Executive Summary - Data Table on Incremental Growth
- Exhibits8: Executive Summary - Chart on Company Market Positioning
- Exhibits9: Parent Market
- Exhibits10: Data Table on - Parent Market
- Exhibits11: Market characteristics analysis
- Exhibits12: Value Chain Analysis
- Exhibits13: Offerings of companies included in the market definition
- Exhibits14: Market segments
- Exhibits15: Chart on Global - Market size and forecast 2023-2028 ($ million)
- Exhibits16: Data Table on Global - Market size and forecast 2023-2028 ($ million)
- Exhibits17: Chart on Global Market: Year-over-year growth 2023-2028 (%)
- Exhibits18: Data Table on Global Market: Year-over-year growth 2023-2028 (%)
- Exhibits19: Historic Market Size - Data Table on Global Employee Engagement Software Market 2018 - 2022 ($ million)
- Exhibits20: Historic Market Size - Deployment Segment 2018 - 2022 ($ million)
- Exhibits21: Historic Market Size - Geography Segment 2018 - 2022 ($ million)
- Exhibits22: Historic Market Size - Country Segment 2018 - 2022 ($ million)
- Exhibits23: Five forces analysis - Comparison between 2023 and 2028
- Exhibits24: Bargaining power of buyers - Impact of key factors 2023 and 2028
- Exhibits25: Bargaining power of suppliers - Impact of key factors in 2023 and 2028
- Exhibits26: Threat of new entrants - Impact of key factors in 2023 and 2028
- Exhibits27: Threat of substitutes - Impact of key factors in 2023 and 2028
- Exhibits28: Threat of rivalry - Impact of key factors in 2023 and 2028
- Exhibits29: Chart on Market condition - Five forces 2023 and 2028
- Exhibits30: Chart on Deployment - Market share 2023-2028 (%)
- Exhibits31: Data Table on Deployment - Market share 2023-2028 (%)
- Exhibits32: Chart on Comparison by Deployment
- Exhibits33: Data Table on Comparison by Deployment
- Exhibits34: Chart on Cloud-based - Market size and forecast 2023-2028 ($ million)
- Exhibits35: Data Table on Cloud-based - Market size and forecast 2023-2028 ($ million)
- Exhibits36: Chart on Cloud-based - Year-over-year growth 2023-2028 (%)
- Exhibits37: Data Table on Cloud-based - Year-over-year growth 2023-2028 (%)
- Exhibits38: Chart on On-premises - Market size and forecast 2023-2028 ($ million)
- Exhibits39: Data Table on On-premises - Market size and forecast 2023-2028 ($ million)
- Exhibits40: Chart on On-premises - Year-over-year growth 2023-2028 (%)
- Exhibits41: Data Table on On-premises - Year-over-year growth 2023-2028 (%)
- Exhibits42: Market opportunity by Deployment ($ million)
- Exhibits43: Data Table on Market opportunity by Deployment ($ million)
- Exhibits44: Analysis of price sensitivity, lifecycle, customer purchase basket, adoption rates, and purchase criteria
- Exhibits45: Chart on Market share By Geographical Landscape 2023-2028 (%)
- Exhibits46: Data Table on Market share By Geographical Landscape 2023-2028 (%)
- Exhibits47: Chart on Geographic comparison
- Exhibits48: Data Table on Geographic comparison
- Exhibits49: Chart on North America - Market size and forecast 2023-2028 ($ million)
- Exhibits50: Data Table on North America - Market size and forecast 2023-2028 ($ million)
- Exhibits51: Chart on North America - Year-over-year growth 2023-2028 (%)
- Exhibits52: Data Table on North America - Year-over-year growth 2023-2028 (%)
- Exhibits53: Chart on Europe - Market size and forecast 2023-2028 ($ million)
- Exhibits54: Data Table on Europe - Market size and forecast 2023-2028 ($ million)
- Exhibits55: Chart on Europe - Year-over-year growth 2023-2028 (%)
- Exhibits56: Data Table on Europe - Year-over-year growth 2023-2028 (%)
- Exhibits57: Chart on APAC - Market size and forecast 2023-2028 ($ million)
- Exhibits58: Data Table on APAC - Market size and forecast 2023-2028 ($ million)
- Exhibits59: Chart on APAC - Year-over-year growth 2023-2028 (%)
- Exhibits60: Data Table on APAC - Year-over-year growth 2023-2028 (%)
- Exhibits61: Chart on South America - Market size and forecast 2023-2028 ($ million)
- Exhibits62: Data Table on South America - Market size and forecast 2023-2028 ($ million)
- Exhibits63: Chart on South America - Year-over-year growth 2023-2028 (%)
- Exhibits64: Data Table on South America - Year-over-year growth 2023-2028 (%)
- Exhibits65: Chart on Middle East and Africa - Market size and forecast 2023-2028 ($ million)
- Exhibits66: Data Table on Middle East and Africa - Market size and forecast 2023-2028 ($ million)
- Exhibits67: Chart on Middle East and Africa - Year-over-year growth 2023-2028 (%)
- Exhibits68: Data Table on Middle East and Africa - Year-over-year growth 2023-2028 (%)
- Exhibits69: Chart on US - Market size and forecast 2023-2028 ($ million)
- Exhibits70: Data Table on US - Market size and forecast 2023-2028 ($ million)
- Exhibits71: Chart on US - Year-over-year growth 2023-2028 (%)
- Exhibits72: Data Table on US - Year-over-year growth 2023-2028 (%)
- Exhibits73: Chart on China - Market size and forecast 2023-2028 ($ million)
- Exhibits74: Data Table on China - Market size and forecast 2023-2028 ($ million)
- Exhibits75: Chart on China - Year-over-year growth 2023-2028 (%)
- Exhibits76: Data Table on China - Year-over-year growth 2023-2028 (%)
- Exhibits77: Chart on Japan - Market size and forecast 2023-2028 ($ million)
- Exhibits78: Data Table on Japan - Market size and forecast 2023-2028 ($ million)
- Exhibits79: Chart on Japan - Year-over-year growth 2023-2028 (%)
- Exhibits80: Data Table on Japan - Year-over-year growth 2023-2028 (%)
- Exhibits81: Chart on Germany - Market size and forecast 2023-2028 ($ million)
- Exhibits82: Data Table on Germany - Market size and forecast 2023-2028 ($ million)
- Exhibits83: Chart on Germany - Year-over-year growth 2023-2028 (%)
- Exhibits84: Data Table on Germany - Year-over-year growth 2023-2028 (%)
- Exhibits85: Chart on UK - Market size and forecast 2023-2028 ($ million)
- Exhibits86: Data Table on UK - Market size and forecast 2023-2028 ($ million)
- Exhibits87: Chart on UK - Year-over-year growth 2023-2028 (%)
- Exhibits88: Data Table on UK - Year-over-year growth 2023-2028 (%)
- Exhibits89: Market opportunity By Geographical Landscape ($ million)
- Exhibits90: Data Tables on Market opportunity By Geographical Landscape ($ million)
- Exhibits91: Impact of drivers and challenges in 2023 and 2028
- Exhibits92: Overview on criticality of inputs and factors of differentiation
- Exhibits93: Overview on factors of disruption
- Exhibits94: Impact of key risks on business
- Exhibits95: Companies covered
- Exhibits96: Matrix on companies position and classification
- Exhibits97: 15Five - Overview
- Exhibits98: 15Five - Product / Service
- Exhibits99: 15Five - Key offerings
- Exhibits100: Appreiz Inc. - Overview
- Exhibits101: Appreiz Inc. - Product / Service
- Exhibits102: Appreiz Inc. - Key offerings
- Exhibits103: Bitrix24 Ltd - Overview
- Exhibits104: Bitrix24 Ltd - Product / Service
- Exhibits105: Bitrix24 Ltd - Key offerings
- Exhibits106: Fond Technologies Inc. - Overview
- Exhibits107: Fond Technologies Inc. - Product / Service
- Exhibits108: Fond Technologies Inc. - Key offerings
- Exhibits109: Gtmhub EOOD - Overview
- Exhibits110: Gtmhub EOOD - Product / Service
- Exhibits111: Gtmhub EOOD - Key offerings
- Exhibits112: Interactive Happiness Survey AB - Overview
- Exhibits113: Interactive Happiness Survey AB - Product / Service
- Exhibits114: Interactive Happiness Survey AB - Key offerings
- Exhibits115: Kudos Inc. - Overview
- Exhibits116: Kudos Inc. - Product / Service
- Exhibits117: Kudos Inc. - Key offerings
- Exhibits118: Motivosity Inc. - Overview
- Exhibits119: Motivosity Inc. - Product / Service
- Exhibits120: Motivosity Inc. - Key offerings
- Exhibits121: Qualtrics LLC - Overview
- Exhibits122: Qualtrics LLC - Product / Service
- Exhibits123: Qualtrics LLC - Key offerings
- Exhibits124: Reward Gateway UK Ltd. - Overview
- Exhibits125: Reward Gateway UK Ltd. - Product / Service
- Exhibits126: Reward Gateway UK Ltd. - Key offerings
- Exhibits127: Inclusions checklist
- Exhibits128: Exclusions checklist
- Exhibits129: Currency conversion rates for US$
- Exhibits130: Research methodology
- Exhibits131: Information sources
- Exhibits132: Data validation
- Exhibits133: Validation techniques employed for market sizing
- Exhibits134: Data synthesis
- Exhibits135: 360 degree market analysis
- Exhibits136: List of abbreviations
Employee Engagement Software Market 2024-2028
The employee engagement software market is forecasted to grow by USD 325.9 mn during 2023-2028, accelerating at a CAGR of 6.8% during the forecast period. The report on the employee engagement software market provides a holistic analysis, market size and forecast, trends, growth drivers, and challenges, as well as vendor analysis covering around 25 vendors.
The report offers an up-to-date analysis regarding the current market scenario, the latest trends and drivers, and the overall market environment. The market is driven by need for workforce diversity management, expansion of small and medium-sized enterprises (SMEs) and large enterprises in apac, and increasing number of multinational organizations.
| Market Scope | |
|---|---|
| Base Year | 2024 |
| End Year | 2028 |
| Series Year | 2024-2028 |
| Growth Momentum | Accelerate |
| YOY 2024 | 6.3% |
| CAGR | 6.8% |
| Incremental Value | $325.9 mn |
Technavio's employee engagement software market is segmented as below:
By Deployment
- Cloud-based
- On-premises
By Geographical Landscape
- North America
- Europe
- APAC
- South America
- Middle East and Africa
This study identifies the rising adoption of digital human resource (HR) technology as one of the prime reasons driving the employee engagement software market growth during the next few years. Also, growing deployment of cloud-based employee engagement software and escalating outsourcing activities will lead to sizable demand in the market.
The report on the employee engagement software market covers the following areas:
- Employee Engagement Software Market sizing
- Employee Engagement Software Market forecast
- Employee Engagement Software Market industry analysis
The robust vendor analysis is designed to help clients improve their market position, and in line with this, this report provides a detailed analysis of several leading employee engagement software market vendors that include 15Five, Appreiz Inc., Bargain Technologies Pvt. Ltd., Bitrix24 Ltd, Culture Amp Pty Ltd., Energage LLC, Fond Technologies Inc., Gtmhub EOOD, HALO Branded Solutions Inc., Interactive Happiness Survey AB, Kudos Inc., Motivosity Inc., People Gauge Ltd., Qualtrics LLC, Quantum Market Research Inc., Reward Gateway UK Ltd., Socxo Pte. Ltd., TINYhr Inc., WebMobi, and WorkTango Inc.. Also, the employee engagement software market analysis report includes information on upcoming trends and challenges that will influence market growth. This is to help companies strategize and leverage all forthcoming growth opportunities.
The study was conducted using an objective combination of primary and secondary information including inputs from key participants in the industry. The report contains a comprehensive market and vendor landscape in addition to an analysis of the key vendors.
The publisher presents a detailed picture of the market by the way of study, synthesis, and summation of data from multiple sources by an analysis of key parameters such as profit, pricing, competition, and promotions. It presents various market facets by identifying the key industry influencers. The data presented is comprehensive, reliable, and a result of extensive primary and secondary research. The market research reports provide a complete competitive landscape and an in-depth vendor selection methodology and analysis using qualitative and quantitative research to forecast accurate market growth.
Table of Contents
1 Executive Summary
- 1.1 Market overview
- Executive Summary - Chart on Market Overview
- Executive Summary - Data Table on Market Overview
- Executive Summary - Chart on Global Market Characteristics
- Executive Summary - Chart on Market By Geographical Landscape
- Executive Summary - Chart on Market Segmentation by Deployment
- Executive Summary - Chart on Incremental Growth
- Executive Summary - Data Table on Incremental Growth
- Executive Summary - Chart on Company Market Positioning
2 Market Landscape
- 2.1 Market ecosystem
- Parent Market
- Data Table on - Parent Market
- 2.2 Market characteristics
- Market characteristics analysis
- 2.3 Value chain analysis
- Value Chain Analysis
3 Market Sizing
- 3.1 Market definition
- Offerings of companies included in the market definition
- 3.2 Market segment analysis
- Market segments
- 3.3 Market size 2023
- 3.4 Market outlook: Forecast for 2023-2028
- Chart on Global - Market size and forecast 2023-2028 ($ million)
- Data Table on Global - Market size and forecast 2023-2028 ($ million)
- Chart on Global Market: Year-over-year growth 2023-2028 (%)
- Data Table on Global Market: Year-over-year growth 2023-2028 (%)
4 Historic Market Size
- 4.1 Global Employee Engagement Software Market 2018 - 2022
- Historic Market Size - Data Table on Global Employee Engagement Software Market 2018 - 2022 ($ million)
- 4.2 Deployment segment analysis 2018 - 2022
- Historic Market Size - Deployment Segment 2018 - 2022 ($ million)
- 4.3 Geography segment analysis 2018 - 2022
- Historic Market Size - Geography Segment 2018 - 2022 ($ million)
- 4.4 Country segment analysis 2018 - 2022
- Historic Market Size - Country Segment 2018 - 2022 ($ million)
5 Five Forces Analysis
- 5.1 Five forces summary
- Five forces analysis - Comparison between 2023 and 2028
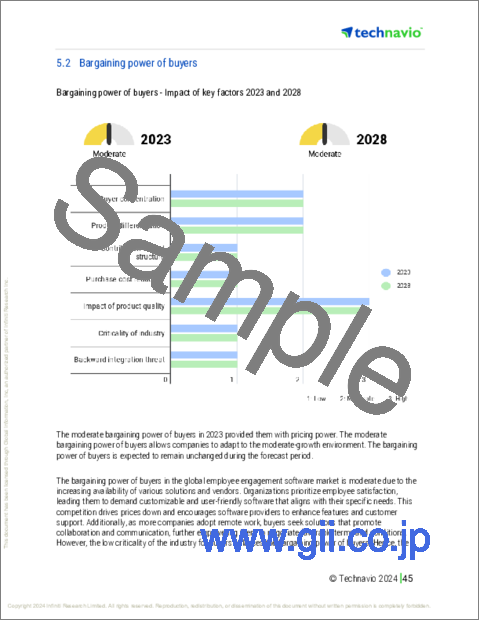
- 5.2 Bargaining power of buyers
- Bargaining power of buyers - Impact of key factors 2023 and 2028
- 5.3 Bargaining power of suppliers
- Bargaining power of suppliers - Impact of key factors in 2023 and 2028
- 5.4 Threat of new entrants
- Threat of new entrants - Impact of key factors in 2023 and 2028
- 5.5 Threat of substitutes
- Threat of substitutes - Impact of key factors in 2023 and 2028
- 5.6 Threat of rivalry
- Threat of rivalry - Impact of key factors in 2023 and 2028
- 5.7 Market condition
- Chart on Market condition - Five forces 2023 and 2028
6 Market Segmentation by Deployment
- 6.1 Market segments
- Chart on Deployment - Market share 2023-2028 (%)
- Data Table on Deployment - Market share 2023-2028 (%)
- 6.2 Comparison by Deployment
- Chart on Comparison by Deployment
- Data Table on Comparison by Deployment
- 6.3 Cloud-based - Market size and forecast 2023-2028
- Chart on Cloud-based - Market size and forecast 2023-2028 ($ million)
- Data Table on Cloud-based - Market size and forecast 2023-2028 ($ million)
- Chart on Cloud-based - Year-over-year growth 2023-2028 (%)
- Data Table on Cloud-based - Year-over-year growth 2023-2028 (%)
- 6.4 On-premises - Market size and forecast 2023-2028
- Chart on On-premises - Market size and forecast 2023-2028 ($ million)
- Data Table on On-premises - Market size and forecast 2023-2028 ($ million)
- Chart on On-premises - Year-over-year growth 2023-2028 (%)
- Data Table on On-premises - Year-over-year growth 2023-2028 (%)
- 6.5 Market opportunity by Deployment
- Market opportunity by Deployment ($ million)
- Data Table on Market opportunity by Deployment ($ million)
7 Customer Landscape
- 7.1 Customer landscape overview
- Analysis of price sensitivity, lifecycle, customer purchase basket, adoption rates, and purchase criteria
8 Geographic Landscape
- 8.1 Geographic segmentation
- Chart on Market share By Geographical Landscape 2023-2028 (%)
- Data Table on Market share By Geographical Landscape 2023-2028 (%)
- 8.2 Geographic comparison
- Chart on Geographic comparison
- Data Table on Geographic comparison
- 8.3 North America - Market size and forecast 2023-2028
- Chart on North America - Market size and forecast 2023-2028 ($ million)
- Data Table on North America - Market size and forecast 2023-2028 ($ million)
- Chart on North America - Year-over-year growth 2023-2028 (%)
- Data Table on North America - Year-over-year growth 2023-2028 (%)
- 8.4 Europe - Market size and forecast 2023-2028
- Chart on Europe - Market size and forecast 2023-2028 ($ million)
- Data Table on Europe - Market size and forecast 2023-2028 ($ million)
- Chart on Europe - Year-over-year growth 2023-2028 (%)
- Data Table on Europe - Year-over-year growth 2023-2028 (%)
- 8.5 APAC - Market size and forecast 2023-2028
- Chart on APAC - Market size and forecast 2023-2028 ($ million)
- Data Table on APAC - Market size and forecast 2023-2028 ($ million)
- Chart on APAC - Year-over-year growth 2023-2028 (%)
- Data Table on APAC - Year-over-year growth 2023-2028 (%)
- 8.6 South America - Market size and forecast 2023-2028
- Chart on South America - Market size and forecast 2023-2028 ($ million)
- Data Table on South America - Market size and forecast 2023-2028 ($ million)
- Chart on South America - Year-over-year growth 2023-2028 (%)
- Data Table on South America - Year-over-year growth 2023-2028 (%)
- 8.7 Middle East and Africa - Market size and forecast 2023-2028
- Chart on Middle East and Africa - Market size and forecast 2023-2028 ($ million)
- Data Table on Middle East and Africa - Market size and forecast 2023-2028 ($ million)
- Chart on Middle East and Africa - Year-over-year growth 2023-2028 (%)
- Data Table on Middle East and Africa - Year-over-year growth 2023-2028 (%)
- 8.8 US - Market size and forecast 2023-2028
- Chart on US - Market size and forecast 2023-2028 ($ million)
- Data Table on US - Market size and forecast 2023-2028 ($ million)
- Chart on US - Year-over-year growth 2023-2028 (%)
- Data Table on US - Year-over-year growth 2023-2028 (%)
- 8.9 China - Market size and forecast 2023-2028
- Chart on China - Market size and forecast 2023-2028 ($ million)
- Data Table on China - Market size and forecast 2023-2028 ($ million)
- Chart on China - Year-over-year growth 2023-2028 (%)
- Data Table on China - Year-over-year growth 2023-2028 (%)
- 8.10 Japan - Market size and forecast 2023-2028
- Chart on Japan - Market size and forecast 2023-2028 ($ million)
- Data Table on Japan - Market size and forecast 2023-2028 ($ million)
- Chart on Japan - Year-over-year growth 2023-2028 (%)
- Data Table on Japan - Year-over-year growth 2023-2028 (%)
- 8.11 Germany - Market size and forecast 2023-2028
- Chart on Germany - Market size and forecast 2023-2028 ($ million)
- Data Table on Germany - Market size and forecast 2023-2028 ($ million)
- Chart on Germany - Year-over-year growth 2023-2028 (%)
- Data Table on Germany - Year-over-year growth 2023-2028 (%)
- 8.12 UK - Market size and forecast 2023-2028
- Chart on UK - Market size and forecast 2023-2028 ($ million)
- Data Table on UK - Market size and forecast 2023-2028 ($ million)
- Chart on UK - Year-over-year growth 2023-2028 (%)
- Data Table on UK - Year-over-year growth 2023-2028 (%)
- 8.13 Market opportunity By Geographical Landscape
- Market opportunity By Geographical Landscape ($ million)
- Data Tables on Market opportunity By Geographical Landscape ($ million)
9 Drivers, Challenges, and Opportunity/Restraints
- 9.1 Market drivers
- 9.2 Market challenges
- 9.3 Impact of drivers and challenges
- Impact of drivers and challenges in 2023 and 2028
- 9.4 Market opportunities/restraints
10 Competitive Landscape
- 10.1 Overview
- 10.2 Competitive Landscape
- Overview on criticality of inputs and factors of differentiation
- 10.3 Landscape disruption
- Overview on factors of disruption
- 10.4 Industry risks
- Impact of key risks on business
11 Competitive Analysis
- 11.1 Companies profiled
- Companies covered
- 11.2 Market positioning of companies
- Matrix on companies position and classification
- 15Five
- 15Five - Overview
- 15Five - Product / Service
- 15Five - Key offerings
- 11.4 Appreiz Inc.
- Appreiz Inc. - Overview
- Appreiz Inc. - Product / Service
- Appreiz Inc. - Key offerings
- 11.5 Bitrix24 Ltd
- Bitrix24 Ltd - Overview
- Bitrix24 Ltd - Product / Service
- Bitrix24 Ltd - Key offerings
- 11.6 Fond Technologies Inc.
- Fond Technologies Inc. - Overview
- Fond Technologies Inc. - Product / Service
- Fond Technologies Inc. - Key offerings
- 11.7 Gtmhub EOOD
- Gtmhub EOOD - Overview
- Gtmhub EOOD - Product / Service
- Gtmhub EOOD - Key offerings
- 11.8 Interactive Happiness Survey AB
- Interactive Happiness Survey AB - Overview
- Interactive Happiness Survey AB - Product / Service
- Interactive Happiness Survey AB - Key offerings
- 11.9 Kudos Inc.
- Kudos Inc. - Overview
- Kudos Inc. - Product / Service
- Kudos Inc. - Key offerings
- 11.10 Motivosity Inc.
- Motivosity Inc. - Overview
- Motivosity Inc. - Product / Service
- Motivosity Inc. - Key offerings
- 11.11 Qualtrics LLC
- Qualtrics LLC - Overview
- Qualtrics LLC - Product / Service
- Qualtrics LLC - Key offerings
- 11.12 Reward Gateway UK Ltd.
- Reward Gateway UK Ltd. - Overview
- Reward Gateway UK Ltd. - Product / Service
- Reward Gateway UK Ltd. - Key offerings
12 Appendix
- 12.1 Scope of the report
- 12.2 Inclusions and exclusions checklist
- Inclusions checklist
- Exclusions checklist
- 12.3 Currency conversion rates for US$
- Currency conversion rates for US$
- 12.4 Research methodology
- Research methodology
- 12.5 Data procurement
- Information sources
- 12.6 Data validation
- Data validation
- 12.7 Validation techniques employed for market sizing
- Validation techniques employed for market sizing
- 12.8 Data synthesis
- Data synthesis
- 12.9 360 degree market analysis
- 360 degree market analysis
- 12.10 List of abbreviations
- List of abbreviations
