|
|
市場調査レポート
商品コード
1602006
腎バイオマーカーの世界市場(2024年~2028年)Global Renal Biomarkers Market 2024-2028 |
||||||

|
|||||||
カスタマイズ可能
|
|||||||

| 腎バイオマーカーの世界市場(2024年~2028年) |
|
出版日: 2024年11月08日
発行: TechNavio
ページ情報: 英文 164 Pages
納期: 即納可能
|

全表示
- 概要
- 図表
- 目次
腎バイオマーカー市場(2024年~2028年)
腎バイオマーカー市場は、2023年から2028年に12億790万米ドルとなり、予測期間中のCAGRは13%で成長すると予測されます。当レポートでは、腎バイオマーカー市場の全体的な分析、市場規模・予測、動向、成長促進要因、課題、約25のベンダーを網羅したベンダー分析などを掲載しています。
現在の市場シナリオ、最新動向と促進要因、市場環境全体に関する最新分析を提供しています。市場は、慢性腎臓病の有病率の上昇、急性腎障害(AKI)の発生率と関連リスク因子の増加、高齢化人口の急激な増加によって牽引されています。
| 市場範囲 | |
|---|---|
| 基準年 | 2024年 |
| 終了年 | 2028年 |
| 予測期間 | 2024年~2028年 |
| 成長モメンタム | 加速 |
| 前年比(2024年) | 11.2% |
| CAGR | 13% |
| 増分額 | 12億790万米ドル |
本調査では、今後数年間の腎バイオマーカー市場の成長を促進する主な要因の1つとして、腎臓病に対する意識の高まりを挙げています。また、新興市場におけるビジネスチャンスや、小型化およびウェアラブル技術への注力も、市場の大きな需要につながります。
目次
第1章 エグゼクティブサマリー
- 市場概要
第2章 Technavioによる分析
- 価格感度・ライフサイクル・顧客購入バスケット・採用率・購入基準の分析
- インプットの重要性と差別化の要因
- 混乱の要因
- 促進要因と課題の影響
第3章 市場情勢
- 市場エコシステム
- 市場の特徴
- バリューチェーン分析
第4章 市場規模
- 市場の定義
- 市場セグメント分析
- 市場規模、2023年
- 市場の見通し、2023年~2028年
第5章 市場規模実績
- 腎バイオマーカーの世界市場、2018年~2022年
- エンドユーザーセグメント分析、2018年~2022年
- 地域別セグメント分析、2018年~2022年
- 国別セグメント分析、2018年~2022年
第6章 ファイブフォース分析
- ファイブフォースの要約
- 買い手の交渉力
- 供給企業の交渉力
- 新規参入業者の脅威
- 代替品の脅威
- 競争の脅威
- 市況
第7章 市場セグメンテーション:エンドユーザー別
- 市場セグメント
- 比較:エンドユーザー別
- 病院:市場規模と予測、2023年~2028年
- 診療所・診断研究所:市場規模と予測、2023年~2028年
- 研究室:市場規模と予測、2023年~2028年
- 市場機会:エンドユーザー別
第8章 顧客情勢
- 顧客情勢の概要
第9章 地域別情勢
- 地域別セグメンテーション
- 地域別比較
- 北米:市場規模と予測、2023年~2028年
- 欧州:市場規模と予測、2023年~2028年
- アジア:市場規模と予測、2023年~2028年
- 世界のその他の地域:市場規模と予測、2023年~2028年
- 米国:市場規模と予測、2023年~2028年
- カナダ:市場規模と予測、2023年~2028年
- ドイツ:市場規模と予測、2023年~2028年
- 英国:市場規模と予測、2023年~2028年
- フランス:市場規模と予測、2023年~2028年
- インド:市場規模と予測、2023年~2028年
- スペイン:市場規模と予測、2023年~2028年
- 中国:市場規模と予測、2023年~2028年
- サウジアラビア:市場規模と予測、2023年~2028年
- シンガポール:市場規模と予測、2023年~2028年
- 市場機会:地域情勢別
第10章 促進要因・課題・機会・抑制要因
- 市場促進要因
- 市場の課題
- 促進要因と課題の影響
- 市場の機会・抑制要因
第11章 競合情勢
- 概要
- 競合情勢
- 混乱の状況
- 業界のリスク
第12章 競合分析
- 企業プロファイル
- 企業ランキング指数
- 企業の市場ポジショニング
- Abbott Laboratories
- BioMerieux SA
- BioPorto AS
- F. Hoffmann La Roche Ltd.
- IQVIA Holdings Inc.
- Randox Laboratories Ltd.
- RenalSense Ltd.
- Siemens AG
- SphingoTec GmbH
- Thermo Fisher Scientific Inc.
第13章 付録
Exhibits:
- Exhibits1: Executive Summary - Chart on Market Overview
- Exhibits2: Executive Summary - Data Table on Market Overview
- Exhibits3: Executive Summary - Chart on Global Market Characteristics
- Exhibits4: Executive Summary - Chart on Market By Geographical Landscape
- Exhibits5: Executive Summary - Chart on Market Segmentation by End-user
- Exhibits6: Executive Summary - Chart on Incremental Growth
- Exhibits7: Executive Summary - Data Table on Incremental Growth
- Exhibits8: Executive Summary - Chart on Company Market Positioning
- Exhibits9: Analysis of price sensitivity, lifecycle, customer purchase basket, adoption rates, and purchase criteria
- Exhibits10: Overview on criticality of inputs and factors of differentiation
- Exhibits11: Overview on factors of disruption
- Exhibits12: Impact of drivers and challenges in 2023 and 2028
- Exhibits13: Parent Market
- Exhibits14: Data Table on - Parent Market
- Exhibits15: Market characteristics analysis
- Exhibits16: Value Chain Analysis
- Exhibits17: Offerings of companies included in the market definition
- Exhibits18: Market segments
- Exhibits19: Chart on Global - Market size and forecast 2023-2028 ($ million)
- Exhibits20: Data Table on Global - Market size and forecast 2023-2028 ($ million)
- Exhibits21: Chart on Global Market: Year-over-year growth 2023-2028 (%)
- Exhibits22: Data Table on Global Market: Year-over-year growth 2023-2028 (%)
- Exhibits23: Historic Market Size - Data Table on Global Renal Biomarkers Market 2018 - 2022 ($ million)
- Exhibits24: Historic Market Size - End-user Segment 2018 - 2022 ($ million)
- Exhibits25: Historic Market Size - Geography Segment 2018 - 2022 ($ million)
- Exhibits26: Historic Market Size - Country Segment 2018 - 2022 ($ million)
- Exhibits27: Five forces analysis - Comparison between 2023 and 2028
- Exhibits28: Bargaining power of buyers - Impact of key factors 2023 and 2028
- Exhibits29: Bargaining power of suppliers - Impact of key factors in 2023 and 2028
- Exhibits30: Threat of new entrants - Impact of key factors in 2023 and 2028
- Exhibits31: Threat of substitutes - Impact of key factors in 2023 and 2028
- Exhibits32: Threat of rivalry - Impact of key factors in 2023 and 2028
- Exhibits33: Chart on Market condition - Five forces 2023 and 2028
- Exhibits34: Chart on End-user - Market share 2023-2028 (%)
- Exhibits35: Data Table on End-user - Market share 2023-2028 (%)
- Exhibits36: Chart on Comparison by End-user
- Exhibits37: Data Table on Comparison by End-user
- Exhibits38: Chart on Hospitals - Market size and forecast 2023-2028 ($ million)
- Exhibits39: Data Table on Hospitals - Market size and forecast 2023-2028 ($ million)
- Exhibits40: Chart on Hospitals - Year-over-year growth 2023-2028 (%)
- Exhibits41: Data Table on Hospitals - Year-over-year growth 2023-2028 (%)
- Exhibits42: Chart on Clinics and diagnostic laboratories - Market size and forecast 2023-2028 ($ million)
- Exhibits43: Data Table on Clinics and diagnostic laboratories - Market size and forecast 2023-2028 ($ million)
- Exhibits44: Chart on Clinics and diagnostic laboratories - Year-over-year growth 2023-2028 (%)
- Exhibits45: Data Table on Clinics and diagnostic laboratories - Year-over-year growth 2023-2028 (%)
- Exhibits46: Chart on Research laboratories - Market size and forecast 2023-2028 ($ million)
- Exhibits47: Data Table on Research laboratories - Market size and forecast 2023-2028 ($ million)
- Exhibits48: Chart on Research laboratories - Year-over-year growth 2023-2028 (%)
- Exhibits49: Data Table on Research laboratories - Year-over-year growth 2023-2028 (%)
- Exhibits50: Market opportunity by End-user ($ million)
- Exhibits51: Data Table on Market opportunity by End-user ($ million)
- Exhibits52: Analysis of price sensitivity, lifecycle, customer purchase basket, adoption rates, and purchase criteria
- Exhibits53: Chart on Market share By Geographical Landscape 2023-2028 (%)
- Exhibits54: Data Table on Market share By Geographical Landscape 2023-2028 (%)
- Exhibits55: Chart on Geographic comparison
- Exhibits56: Data Table on Geographic comparison
- Exhibits57: Chart on North America - Market size and forecast 2023-2028 ($ million)
- Exhibits58: Data Table on North America - Market size and forecast 2023-2028 ($ million)
- Exhibits59: Chart on North America - Year-over-year growth 2023-2028 (%)
- Exhibits60: Data Table on North America - Year-over-year growth 2023-2028 (%)
- Exhibits61: Chart on Europe - Market size and forecast 2023-2028 ($ million)
- Exhibits62: Data Table on Europe - Market size and forecast 2023-2028 ($ million)
- Exhibits63: Chart on Europe - Year-over-year growth 2023-2028 (%)
- Exhibits64: Data Table on Europe - Year-over-year growth 2023-2028 (%)
- Exhibits65: Chart on Asia - Market size and forecast 2023-2028 ($ million)
- Exhibits66: Data Table on Asia - Market size and forecast 2023-2028 ($ million)
- Exhibits67: Chart on Asia - Year-over-year growth 2023-2028 (%)
- Exhibits68: Data Table on Asia - Year-over-year growth 2023-2028 (%)
- Exhibits69: Chart on Rest of World (ROW) - Market size and forecast 2023-2028 ($ million)
- Exhibits70: Data Table on Rest of World (ROW) - Market size and forecast 2023-2028 ($ million)
- Exhibits71: Chart on Rest of World (ROW) - Year-over-year growth 2023-2028 (%)
- Exhibits72: Data Table on Rest of World (ROW) - Year-over-year growth 2023-2028 (%)
- Exhibits73: Chart on US - Market size and forecast 2023-2028 ($ million)
- Exhibits74: Data Table on US - Market size and forecast 2023-2028 ($ million)
- Exhibits75: Chart on US - Year-over-year growth 2023-2028 (%)
- Exhibits76: Data Table on US - Year-over-year growth 2023-2028 (%)
- Exhibits77: Chart on Canada - Market size and forecast 2023-2028 ($ million)
- Exhibits78: Data Table on Canada - Market size and forecast 2023-2028 ($ million)
- Exhibits79: Chart on Canada - Year-over-year growth 2023-2028 (%)
- Exhibits80: Data Table on Canada - Year-over-year growth 2023-2028 (%)
- Exhibits81: Chart on Germany - Market size and forecast 2023-2028 ($ million)
- Exhibits82: Data Table on Germany - Market size and forecast 2023-2028 ($ million)
- Exhibits83: Chart on Germany - Year-over-year growth 2023-2028 (%)
- Exhibits84: Data Table on Germany - Year-over-year growth 2023-2028 (%)
- Exhibits85: Chart on UK - Market size and forecast 2023-2028 ($ million)
- Exhibits86: Data Table on UK - Market size and forecast 2023-2028 ($ million)
- Exhibits87: Chart on UK - Year-over-year growth 2023-2028 (%)
- Exhibits88: Data Table on UK - Year-over-year growth 2023-2028 (%)
- Exhibits89: Chart on France - Market size and forecast 2023-2028 ($ million)
- Exhibits90: Data Table on France - Market size and forecast 2023-2028 ($ million)
- Exhibits91: Chart on France - Year-over-year growth 2023-2028 (%)
- Exhibits92: Data Table on France - Year-over-year growth 2023-2028 (%)
- Exhibits93: Chart on India - Market size and forecast 2023-2028 ($ million)
- Exhibits94: Data Table on India - Market size and forecast 2023-2028 ($ million)
- Exhibits95: Chart on India - Year-over-year growth 2023-2028 (%)
- Exhibits96: Data Table on India - Year-over-year growth 2023-2028 (%)
- Exhibits97: Chart on Spain - Market size and forecast 2023-2028 ($ million)
- Exhibits98: Data Table on Spain - Market size and forecast 2023-2028 ($ million)
- Exhibits99: Chart on Spain - Year-over-year growth 2023-2028 (%)
- Exhibits100: Data Table on Spain - Year-over-year growth 2023-2028 (%)
- Exhibits101: Chart on China - Market size and forecast 2023-2028 ($ million)
- Exhibits102: Data Table on China - Market size and forecast 2023-2028 ($ million)
- Exhibits103: Chart on China - Year-over-year growth 2023-2028 (%)
- Exhibits104: Data Table on China - Year-over-year growth 2023-2028 (%)
- Exhibits105: Chart on Saudi Arabia - Market size and forecast 2023-2028 ($ million)
- Exhibits106: Data Table on Saudi Arabia - Market size and forecast 2023-2028 ($ million)
- Exhibits107: Chart on Saudi Arabia - Year-over-year growth 2023-2028 (%)
- Exhibits108: Data Table on Saudi Arabia - Year-over-year growth 2023-2028 (%)
- Exhibits109: Chart on Singapore - Market size and forecast 2023-2028 ($ million)
- Exhibits110: Data Table on Singapore - Market size and forecast 2023-2028 ($ million)
- Exhibits111: Chart on Singapore - Year-over-year growth 2023-2028 (%)
- Exhibits112: Data Table on Singapore - Year-over-year growth 2023-2028 (%)
- Exhibits113: Market opportunity By Geographical Landscape ($ million)
- Exhibits114: Data Tables on Market opportunity By Geographical Landscape ($ million)
- Exhibits115: Impact of drivers and challenges in 2023 and 2028
- Exhibits116: Overview on criticality of inputs and factors of differentiation
- Exhibits117: Overview on factors of disruption
- Exhibits118: Impact of key risks on business
- Exhibits119: Companies covered
- Exhibits120: Company ranking index
- Exhibits121: Matrix on companies position and classification
- Exhibits122: Abbott Laboratories - Overview
- Exhibits123: Abbott Laboratories - Business segments
- Exhibits124: Abbott Laboratories - Key news
- Exhibits125: Abbott Laboratories - Key offerings
- Exhibits126: Abbott Laboratories - Segment focus
- Exhibits127: SWOT
- Exhibits128: BioMerieux SA - Overview
- Exhibits129: BioMerieux SA - Business segments
- Exhibits130: BioMerieux SA - Key news
- Exhibits131: BioMerieux SA - Key offerings
- Exhibits132: BioMerieux SA - Segment focus
- Exhibits133: SWOT
- Exhibits134: BioPorto AS - Overview
- Exhibits135: BioPorto AS - Product / Service
- Exhibits136: BioPorto AS - Key offerings
- Exhibits137: SWOT
- Exhibits138: F. Hoffmann La Roche Ltd. - Overview
- Exhibits139: F. Hoffmann La Roche Ltd. - Business segments
- Exhibits140: F. Hoffmann La Roche Ltd. - Key news
- Exhibits141: F. Hoffmann La Roche Ltd. - Key offerings
- Exhibits142: F. Hoffmann La Roche Ltd. - Segment focus
- Exhibits143: SWOT
- Exhibits144: IQVIA Holdings Inc. - Overview
- Exhibits145: IQVIA Holdings Inc. - Business segments
- Exhibits146: IQVIA Holdings Inc. - Key news
- Exhibits147: IQVIA Holdings Inc. - Key offerings
- Exhibits148: IQVIA Holdings Inc. - Segment focus
- Exhibits149: SWOT
- Exhibits150: Randox Laboratories Ltd. - Overview
- Exhibits151: Randox Laboratories Ltd. - Product / Service
- Exhibits152: Randox Laboratories Ltd. - Key news
- Exhibits153: Randox Laboratories Ltd. - Key offerings
- Exhibits154: SWOT
- Exhibits155: RenalSense Ltd. - Overview
- Exhibits156: RenalSense Ltd. - Product / Service
- Exhibits157: RenalSense Ltd. - Key offerings
- Exhibits158: SWOT
- Exhibits159: Siemens AG - Overview
- Exhibits160: Siemens AG - Business segments
- Exhibits161: Siemens AG - Key news
- Exhibits162: Siemens AG - Key offerings
- Exhibits163: Siemens AG - Segment focus
- Exhibits164: SWOT
- Exhibits165: SphingoTec GmbH - Overview
- Exhibits166: SphingoTec GmbH - Product / Service
- Exhibits167: SphingoTec GmbH - Key offerings
- Exhibits168: SWOT
- Exhibits169: Thermo Fisher Scientific Inc. - Overview
- Exhibits170: Thermo Fisher Scientific Inc. - Business segments
- Exhibits171: Thermo Fisher Scientific Inc. - Key news
- Exhibits172: Thermo Fisher Scientific Inc. - Key offerings
- Exhibits173: Thermo Fisher Scientific Inc. - Segment focus
- Exhibits174: SWOT
- Exhibits175: Inclusions checklist
- Exhibits176: Exclusions checklist
- Exhibits177: Currency conversion rates for US$
- Exhibits178: Research methodology
- Exhibits179: Information sources
- Exhibits180: Data validation
- Exhibits181: Validation techniques employed for market sizing
- Exhibits182: Data synthesis
- Exhibits183: 360 degree market analysis
- Exhibits184: List of abbreviations
Renal Biomarkers Market 2024-2028
The renal biomarkers market is forecasted to grow by USD 1207.9 mn during 2023-2028, accelerating at a CAGR of 13% during the forecast period. The report on the renal biomarkers market provides a holistic analysis, market size and forecast, trends, growth drivers, and challenges, as well as vendor analysis covering around 25 vendors.
The report offers an up-to-date analysis regarding the current market scenario, the latest trends and drivers, and the overall market environment. The market is driven by rising prevalence of chronic kidney diseases, increase in incidence of acute kidney injury (AKI) and associated risk factors, and rapid increase in aging population.
| Market Scope | |
|---|---|
| Base Year | 2024 |
| End Year | 2028 |
| Series Year | 2024-2028 |
| Growth Momentum | Accelerate |
| YOY 2024 | 11.2% |
| CAGR | 13% |
| Incremental Value | $1207.9 mn |
Technavio's renal biomarkers market is segmented as below:
By End-user
- Hospitals
- Clinics and diagnostic laboratories
- Research laboratories
By Geographical Landscape
- North America
- Europe
- Asia
- Rest of World (ROW)
This study identifies the increasing awareness about kidney diseases as one of the prime reasons driving the renal biomarkers market growth during the next few years. Also, opportunities in emerging markets and focus on miniaturization and wearable technology will lead to sizable demand in the market.
The report on the renal biomarkers market covers the following areas:
- Renal Biomarkers Market sizing
- Renal Biomarkers Market forecast
- Renal Biomarkers Market industry analysis
The robust vendor analysis is designed to help clients improve their market position, and in line with this, this report provides a detailed analysis of several leading renal biomarkers market vendors that include Abbott Laboratories, BioMerieux SA, BioPorto AS, COBO SCIENTIFIC ApS, EKF Diagnostics Holdings Plc, F. Hoffmann La Roche Ltd., IQVIA Holdings Inc., Randox Laboratories Ltd., RenalSense Ltd., Siemens AG, SphingoTec GmbH, and Thermo Fisher Scientific Inc.. Also, the renal biomarkers market analysis report includes information on upcoming trends and challenges that will influence market growth. This is to help companies strategize and leverage all forthcoming growth opportunities.
The study was conducted using an objective combination of primary and secondary information including inputs from key participants in the industry. The report contains a comprehensive market and vendor landscape in addition to an analysis of the key vendors.
The publisher presents a detailed picture of the market by the way of study, synthesis, and summation of data from multiple sources by an analysis of key parameters such as profit, pricing, competition, and promotions. It presents various market facets by identifying the key industry influencers. The data presented is comprehensive, reliable, and a result of extensive primary and secondary research. The market research reports provide a complete competitive landscape and an in-depth vendor selection methodology and analysis using qualitative and quantitative research to forecast accurate market growth.
Table of Contents
1 Executive Summary
- 1.1 Market overview
- Executive Summary - Chart on Market Overview
- Executive Summary - Data Table on Market Overview
- Executive Summary - Chart on Global Market Characteristics
- Executive Summary - Chart on Market By Geographical Landscape
- Executive Summary - Chart on Market Segmentation by End-user
- Executive Summary - Chart on Incremental Growth
- Executive Summary - Data Table on Incremental Growth
- Executive Summary - Chart on Company Market Positioning
2 Technavio Analysis
- 2.1 Analysis of price sensitivity, lifecycle, customer purchase basket, adoption rates, and purchase criteria
- Analysis of price sensitivity, lifecycle, customer purchase basket, adoption rates, and purchase criteria
- 2.2 Criticality of inputs and Factors of differentiation
- Overview on criticality of inputs and factors of differentiation
- 2.3 Factors of disruption
- Overview on factors of disruption
- 2.4 Impact of drivers and challenges
- Impact of drivers and challenges in 2023 and 2028
3 Market Landscape
- 3.1 Market ecosystem
- Parent Market
- Data Table on - Parent Market
- 3.2 Market characteristics
- Market characteristics analysis
- 3.3 Value chain analysis
- Value Chain Analysis
4 Market Sizing
- 4.1 Market definition
- Offerings of companies included in the market definition
- 4.2 Market segment analysis
- Market segments
- 4.3 Market size 2023
- 4.4 Market outlook: Forecast for 2023-2028
- Chart on Global - Market size and forecast 2023-2028 ($ million)
- Data Table on Global - Market size and forecast 2023-2028 ($ million)
- Chart on Global Market: Year-over-year growth 2023-2028 (%)
- Data Table on Global Market: Year-over-year growth 2023-2028 (%)
5 Historic Market Size
- 5.1 Global Renal Biomarkers Market 2018 - 2022
- Historic Market Size - Data Table on Global Renal Biomarkers Market 2018 - 2022 ($ million)
- 5.2 End-user segment analysis 2018 - 2022
- Historic Market Size - End-user Segment 2018 - 2022 ($ million)
- 5.3 Geography segment analysis 2018 - 2022
- Historic Market Size - Geography Segment 2018 - 2022 ($ million)
- 5.4 Country segment analysis 2018 - 2022
- Historic Market Size - Country Segment 2018 - 2022 ($ million)
6 Five Forces Analysis
- 6.1 Five forces summary
- Five forces analysis - Comparison between 2023 and 2028
- 6.2 Bargaining power of buyers
- Bargaining power of buyers - Impact of key factors 2023 and 2028
- 6.3 Bargaining power of suppliers
- Bargaining power of suppliers - Impact of key factors in 2023 and 2028
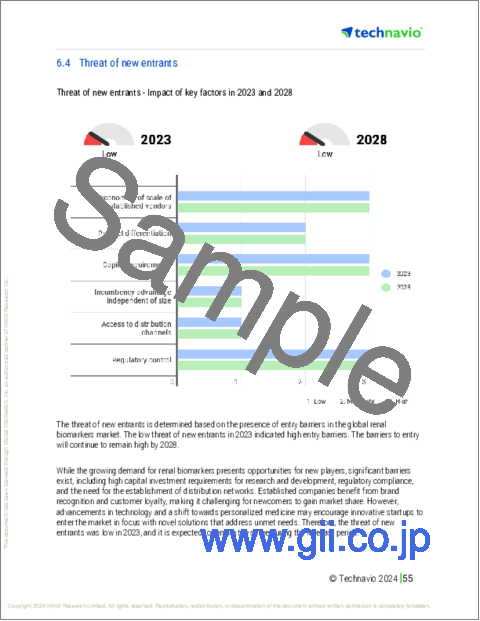
- 6.4 Threat of new entrants
- Threat of new entrants - Impact of key factors in 2023 and 2028
- 6.5 Threat of substitutes
- Threat of substitutes - Impact of key factors in 2023 and 2028
- 6.6 Threat of rivalry
- Threat of rivalry - Impact of key factors in 2023 and 2028
- 6.7 Market condition
- Chart on Market condition - Five forces 2023 and 2028
7 Market Segmentation by End-user
- 7.1 Market segments
- Chart on End-user - Market share 2023-2028 (%)
- Data Table on End-user - Market share 2023-2028 (%)
- 7.2 Comparison by End-user
- Chart on Comparison by End-user
- Data Table on Comparison by End-user
- 7.3 Hospitals - Market size and forecast 2023-2028
- Chart on Hospitals - Market size and forecast 2023-2028 ($ million)
- Data Table on Hospitals - Market size and forecast 2023-2028 ($ million)
- Chart on Hospitals - Year-over-year growth 2023-2028 (%)
- Data Table on Hospitals - Year-over-year growth 2023-2028 (%)
- 7.4 Clinics and diagnostic laboratories - Market size and forecast 2023-2028
- Chart on Clinics and diagnostic laboratories - Market size and forecast 2023-2028 ($ million)
- Data Table on Clinics and diagnostic laboratories - Market size and forecast 2023-2028 ($ million)
- Chart on Clinics and diagnostic laboratories - Year-over-year growth 2023-2028 (%)
- Data Table on Clinics and diagnostic laboratories - Year-over-year growth 2023-2028 (%)
- 7.5 Research laboratories - Market size and forecast 2023-2028
- Chart on Research laboratories - Market size and forecast 2023-2028 ($ million)
- Data Table on Research laboratories - Market size and forecast 2023-2028 ($ million)
- Chart on Research laboratories - Year-over-year growth 2023-2028 (%)
- Data Table on Research laboratories - Year-over-year growth 2023-2028 (%)
- 7.6 Market opportunity by End-user
- Market opportunity by End-user ($ million)
- Data Table on Market opportunity by End-user ($ million)
8 Customer Landscape
- 8.1 Customer landscape overview
- Analysis of price sensitivity, lifecycle, customer purchase basket, adoption rates, and purchase criteria
9 Geographic Landscape
- 9.1 Geographic segmentation
- Chart on Market share By Geographical Landscape 2023-2028 (%)
- Data Table on Market share By Geographical Landscape 2023-2028 (%)
- 9.2 Geographic comparison
- Chart on Geographic comparison
- Data Table on Geographic comparison
- 9.3 North America - Market size and forecast 2023-2028
- Chart on North America - Market size and forecast 2023-2028 ($ million)
- Data Table on North America - Market size and forecast 2023-2028 ($ million)
- Chart on North America - Year-over-year growth 2023-2028 (%)
- Data Table on North America - Year-over-year growth 2023-2028 (%)
- 9.4 Europe - Market size and forecast 2023-2028
- Chart on Europe - Market size and forecast 2023-2028 ($ million)
- Data Table on Europe - Market size and forecast 2023-2028 ($ million)
- Chart on Europe - Year-over-year growth 2023-2028 (%)
- Data Table on Europe - Year-over-year growth 2023-2028 (%)
- 9.5 Asia - Market size and forecast 2023-2028
- Chart on Asia - Market size and forecast 2023-2028 ($ million)
- Data Table on Asia - Market size and forecast 2023-2028 ($ million)
- Chart on Asia - Year-over-year growth 2023-2028 (%)
- Data Table on Asia - Year-over-year growth 2023-2028 (%)
- 9.6 Rest of World (ROW) - Market size and forecast 2023-2028
- Chart on Rest of World (ROW) - Market size and forecast 2023-2028 ($ million)
- Data Table on Rest of World (ROW) - Market size and forecast 2023-2028 ($ million)
- Chart on Rest of World (ROW) - Year-over-year growth 2023-2028 (%)
- Data Table on Rest of World (ROW) - Year-over-year growth 2023-2028 (%)
- 9.7 US - Market size and forecast 2023-2028
- Chart on US - Market size and forecast 2023-2028 ($ million)
- Data Table on US - Market size and forecast 2023-2028 ($ million)
- Chart on US - Year-over-year growth 2023-2028 (%)
- Data Table on US - Year-over-year growth 2023-2028 (%)
- 9.8 Canada - Market size and forecast 2023-2028
- Chart on Canada - Market size and forecast 2023-2028 ($ million)
- Data Table on Canada - Market size and forecast 2023-2028 ($ million)
- Chart on Canada - Year-over-year growth 2023-2028 (%)
- Data Table on Canada - Year-over-year growth 2023-2028 (%)
- 9.9 Germany - Market size and forecast 2023-2028
- Chart on Germany - Market size and forecast 2023-2028 ($ million)
- Data Table on Germany - Market size and forecast 2023-2028 ($ million)
- Chart on Germany - Year-over-year growth 2023-2028 (%)
- Data Table on Germany - Year-over-year growth 2023-2028 (%)
- 9.10 UK - Market size and forecast 2023-2028
- Chart on UK - Market size and forecast 2023-2028 ($ million)
- Data Table on UK - Market size and forecast 2023-2028 ($ million)
- Chart on UK - Year-over-year growth 2023-2028 (%)
- Data Table on UK - Year-over-year growth 2023-2028 (%)
- 9.11 France - Market size and forecast 2023-2028
- Chart on France - Market size and forecast 2023-2028 ($ million)
- Data Table on France - Market size and forecast 2023-2028 ($ million)
- Chart on France - Year-over-year growth 2023-2028 (%)
- Data Table on France - Year-over-year growth 2023-2028 (%)
- 9.12 India - Market size and forecast 2023-2028
- Chart on India - Market size and forecast 2023-2028 ($ million)
- Data Table on India - Market size and forecast 2023-2028 ($ million)
- Chart on India - Year-over-year growth 2023-2028 (%)
- Data Table on India - Year-over-year growth 2023-2028 (%)
- 9.13 Spain - Market size and forecast 2023-2028
- Chart on Spain - Market size and forecast 2023-2028 ($ million)
- Data Table on Spain - Market size and forecast 2023-2028 ($ million)
- Chart on Spain - Year-over-year growth 2023-2028 (%)
- Data Table on Spain - Year-over-year growth 2023-2028 (%)
- 9.14 China - Market size and forecast 2023-2028
- Chart on China - Market size and forecast 2023-2028 ($ million)
- Data Table on China - Market size and forecast 2023-2028 ($ million)
- Chart on China - Year-over-year growth 2023-2028 (%)
- Data Table on China - Year-over-year growth 2023-2028 (%)
- 9.15 Saudi Arabia - Market size and forecast 2023-2028
- Chart on Saudi Arabia - Market size and forecast 2023-2028 ($ million)
- Data Table on Saudi Arabia - Market size and forecast 2023-2028 ($ million)
- Chart on Saudi Arabia - Year-over-year growth 2023-2028 (%)
- Data Table on Saudi Arabia - Year-over-year growth 2023-2028 (%)
- 9.16 Singapore - Market size and forecast 2023-2028
- Chart on Singapore - Market size and forecast 2023-2028 ($ million)
- Data Table on Singapore - Market size and forecast 2023-2028 ($ million)
- Chart on Singapore - Year-over-year growth 2023-2028 (%)
- Data Table on Singapore - Year-over-year growth 2023-2028 (%)
- 9.17 Market opportunity By Geographical Landscape
- Market opportunity By Geographical Landscape ($ million)
- Data Tables on Market opportunity By Geographical Landscape ($ million)
10 Drivers, Challenges, and Opportunity/Restraints
- 10.1 Market drivers
- 10.2 Market challenges
- 10.3 Impact of drivers and challenges
- Impact of drivers and challenges in 2023 and 2028
- 10.4 Market opportunities/restraints
11 Competitive Landscape
- 11.1 Overview
- 11.2 Competitive Landscape
- Overview on criticality of inputs and factors of differentiation
- 11.3 Landscape disruption
- Overview on factors of disruption
- 11.4 Industry risks
- Impact of key risks on business
12 Competitive Analysis
- 12.1 Companies profiled
- Companies covered
- 12.2 Company ranking index
- Company ranking index
- 12.3 Market positioning of companies
- Matrix on companies position and classification
- 12.4 Abbott Laboratories
- Abbott Laboratories - Overview
- Abbott Laboratories - Business segments
- Abbott Laboratories - Key news
- Abbott Laboratories - Key offerings
- Abbott Laboratories - Segment focus
- SWOT
- 12.5 BioMerieux SA
- BioMerieux SA - Overview
- BioMerieux SA - Business segments
- BioMerieux SA - Key news
- BioMerieux SA - Key offerings
- BioMerieux SA - Segment focus
- SWOT
- 12.6 BioPorto AS
- BioPorto AS - Overview
- BioPorto AS - Product / Service
- BioPorto AS - Key offerings
- SWOT
- 12.7 F. Hoffmann La Roche Ltd.
- F. Hoffmann La Roche Ltd. - Overview
- F. Hoffmann La Roche Ltd. - Business segments
- F. Hoffmann La Roche Ltd. - Key news
- F. Hoffmann La Roche Ltd. - Key offerings
- F. Hoffmann La Roche Ltd. - Segment focus
- SWOT
- 12.8 IQVIA Holdings Inc.
- IQVIA Holdings Inc. - Overview
- IQVIA Holdings Inc. - Business segments
- IQVIA Holdings Inc. - Key news
- IQVIA Holdings Inc. - Key offerings
- IQVIA Holdings Inc. - Segment focus
- SWOT
- 12.9 Randox Laboratories Ltd.
- Randox Laboratories Ltd. - Overview
- Randox Laboratories Ltd. - Product / Service
- Randox Laboratories Ltd. - Key news
- Randox Laboratories Ltd. - Key offerings
- SWOT
- 12.10 RenalSense Ltd.
- RenalSense Ltd. - Overview
- RenalSense Ltd. - Product / Service
- RenalSense Ltd. - Key offerings
- SWOT
- 12.11 Siemens AG
- Siemens AG - Overview
- Siemens AG - Business segments
- Siemens AG - Key news
- Siemens AG - Key offerings
- Siemens AG - Segment focus
- SWOT
- 12.12 SphingoTec GmbH
- SphingoTec GmbH - Overview
- SphingoTec GmbH - Product / Service
- SphingoTec GmbH - Key offerings
- SWOT
- 12.13 Thermo Fisher Scientific Inc.
- Thermo Fisher Scientific Inc. - Overview
- Thermo Fisher Scientific Inc. - Business segments
- Thermo Fisher Scientific Inc. - Key news
- Thermo Fisher Scientific Inc. - Key offerings
- Thermo Fisher Scientific Inc. - Segment focus
- SWOT
13 Appendix
- 13.1 Scope of the report
- 13.2 Inclusions and exclusions checklist
- Inclusions checklist
- Exclusions checklist
- 13.3 Currency conversion rates for US$
- Currency conversion rates for US$
- 13.4 Research methodology
- Research methodology
- 13.5 Data procurement
- Information sources
- 13.6 Data validation
- Data validation
- 13.7 Validation techniques employed for market sizing
- Validation techniques employed for market sizing
- 13.8 Data synthesis
- Data synthesis
- 13.9 360 degree market analysis
- 360 degree market analysis
- 13.10 List of abbreviations
- List of abbreviations
