|
|
市場調査レポート
商品コード
1601879
動物用CROの世界市場 2024年~2028年Global Veterinary CRO Market 2024-2028 |
||||||
|
|||||||
カスタマイズ可能
|
|||||||

| 動物用CROの世界市場 2024年~2028年 |
|
出版日: 2024年11月16日
発行: TechNavio
ページ情報: 英文 159 Pages
納期: 即納可能
|

全表示
- 概要
- 図表
- 目次
動物用CRO市場 2024年~2028年
動物用CRO市場は2023年~2028年に2億80万米ドル、予測期間中のCAGRは5.8%で成長すると予測されます。当レポートでは、動物用CRO市場の全体的な分析、市場規模・予測、動向、成長促進要因、課題、約25のベンダーを網羅したベンダー分析などを掲載しています。
現在の市場シナリオ、最新動向と促進要因、市場環境全体に関する最新分析を提供しています。コンパニオンアニマルの飼育数の増加、動物医療費の急増、動物用医薬品メーカーの研究開発活動が市場を牽引しています。
| 市場範囲 | |
|---|---|
| 基準年 | 2024年 |
| 終了年 | 2028年 |
| 予測期間 | 2024年~2028年 |
| 成長モメンタム | 加速 |
| 前年比2024年 | 5.4% |
| CAGR | 5.8% |
| 増分額 | 2億80万米ドル |
本調査では、コンパニオンアニマルにおける疾病の蔓延が、今後数年間の動物用CRO市場成長を促進する主要な理由の一つであると指摘しています。また、動物ヘルスケアに関する意識の高まりと動物用CROへの投資の増加は、市場の大きな需要につながります。
目次
第1章 エグゼクティブサマリー
- 市場概要
第2章 Technavio別分析
- 価格・ライフサイクル・顧客購入バスケット・採用率・購入基準の分析
- インプットの重要性と差別化の要因
- 混乱の要因
- 促進要因と課題の影響
第3章 市場情勢
- 市場エコシステム
- 市場の特徴
- バリューチェーン分析
第4章 市場規模
- 市場の定義
- 市場セグメント分析
- 市場規模 2023年
- 市場の見通し 2023年~2028年
第5章 市場規模実績
- 動物用CROの世界市場 2018年~2022年
- タイプセグメント分析 2018年~2022年
- 地域別セグメント分析 2018年~2022年
- 国別セグメント分析 2018年~2022年
第6章 定性分析
- 動物用CROの世界市場へのAIの影響
第7章 ファイブフォース分析
- ファイブフォースの要約
- 買い手の交渉力
- 供給企業の交渉力
- 新規参入業者の脅威
- 代替品の脅威
- 競争の脅威
- 市況
第8章 市場セグメンテーション:タイプ別
- 市場セグメント
- 比較:タイプ別
- 臨床試験:市場規模と予測 2023年~2028年
- 毒物学:市場規模と予測 2023年~2028年
- 市場認可と規制サポート:市場規模と予測 2023年~2028年
- 市場機会:タイプ別
第9章 顧客情勢
- 顧客情勢の概要
第10章 地域別情勢
- 地域別セグメンテーション
- 地域別比較
- 北米:市場規模と予測 2023年~2028年
- 欧州:市場規模と予測 2023年~2028年
- アジア:市場規模と予測 2023年~2028年
- 世界のその他の地域:市場規模と予測 2023年~2028年
- 米国:市場規模と予測 2023年~2028年
- カナダ:市場規模と予測 2023年~2028年
- ドイツ:市場規模と予測 2023年~2028年
- 中国:市場規模と予測 2023年~2028年
- 英国:市場規模と予測 2023年~2028年
- メキシコ:市場規模と予測 2023年~2028年
- フランス:市場規模と予測 2023年~2028年
- 日本:市場規模と予測 2023年~2028年
- インド:市場規模と予測 2023年~2028年
- スペイン:市場規模と予測 2023年~2028年
- 市場機会:地域情勢別
第11章 促進要因・課題・機会・抑制要因
- 市場促進要因
- 市場の課題
- 促進要因と課題の影響
- 市場の機会・抑制要因
第12章 競合情勢
- 概要
- 競合情勢
- 混乱の状況
- 業界のリスク
第13章 競合分析
- 企業プロファイル
- 企業ランキング指数
- 企業の市場ポジショニング
- Cebiphar
- Charles River Laboratories International Inc.
- Clinvet
- KLIFOVET GmbH
- knoell
- Lohlein and Wolf vet research
- Oncovet Clinical Research
- ONDAX Scientific SL
- Veterinary Research Management
- VETSPIN SRL
第14章 付録
Exhibits:
- Exhibits1: Executive Summary - Chart on Market Overview
- Exhibits2: Executive Summary - Data Table on Market Overview
- Exhibits3: Executive Summary - Chart on Global Market Characteristics
- Exhibits4: Executive Summary - Chart on Market By Geographical Landscape
- Exhibits5: Executive Summary - Chart on Market Segmentation by Type
- Exhibits6: Executive Summary - Chart on Incremental Growth
- Exhibits7: Executive Summary - Data Table on Incremental Growth
- Exhibits8: Executive Summary - Chart on Company Market Positioning
- Exhibits9: Analysis of price sensitivity, lifecycle, customer purchase basket, adoption rates, and purchase criteria
- Exhibits10: Overview on criticality of inputs and factors of differentiation
- Exhibits11: Overview on factors of disruption
- Exhibits12: Impact of drivers and challenges in 2023 and 2028
- Exhibits13: Parent Market
- Exhibits14: Data Table on - Parent Market
- Exhibits15: Market characteristics analysis
- Exhibits16: Value Chain Analysis
- Exhibits17: Offerings of companies included in the market definition
- Exhibits18: Market segments
- Exhibits19: Chart on Global - Market size and forecast 2023-2028 ($ million)
- Exhibits20: Data Table on Global - Market size and forecast 2023-2028 ($ million)
- Exhibits21: Chart on Global Market: Year-over-year growth 2023-2028 (%)
- Exhibits22: Data Table on Global Market: Year-over-year growth 2023-2028 (%)
- Exhibits23: Historic Market Size - Data Table on Global Veterinary CRO Market 2018 - 2022 ($ million)
- Exhibits24: Historic Market Size - Type Segment 2018 - 2022 ($ million)
- Exhibits25: Historic Market Size - Geography Segment 2018 - 2022 ($ million)
- Exhibits26: Historic Market Size - Country Segment 2018 - 2022 ($ million)
- Exhibits27: Five forces analysis - Comparison between 2023 and 2028
- Exhibits28: Bargaining power of buyers - Impact of key factors 2023 and 2028
- Exhibits29: Bargaining power of suppliers - Impact of key factors in 2023 and 2028
- Exhibits30: Threat of new entrants - Impact of key factors in 2023 and 2028
- Exhibits31: Threat of substitutes - Impact of key factors in 2023 and 2028
- Exhibits32: Threat of rivalry - Impact of key factors in 2023 and 2028
- Exhibits33: Chart on Market condition - Five forces 2023 and 2028
- Exhibits34: Chart on Type - Market share 2023-2028 (%)
- Exhibits35: Data Table on Type - Market share 2023-2028 (%)
- Exhibits36: Chart on Comparison by Type
- Exhibits37: Data Table on Comparison by Type
- Exhibits38: Chart on Clinical trials - Market size and forecast 2023-2028 ($ million)
- Exhibits39: Data Table on Clinical trials - Market size and forecast 2023-2028 ($ million)
- Exhibits40: Chart on Clinical trials - Year-over-year growth 2023-2028 (%)
- Exhibits41: Data Table on Clinical trials - Year-over-year growth 2023-2028 (%)
- Exhibits42: Chart on Toxicology - Market size and forecast 2023-2028 ($ million)
- Exhibits43: Data Table on Toxicology - Market size and forecast 2023-2028 ($ million)
- Exhibits44: Chart on Toxicology - Year-over-year growth 2023-2028 (%)
- Exhibits45: Data Table on Toxicology - Year-over-year growth 2023-2028 (%)
- Exhibits46: Chart on Market authorization and regulatory support - Market size and forecast 2023-2028 ($ million)
- Exhibits47: Data Table on Market authorization and regulatory support - Market size and forecast 2023-2028 ($ million)
- Exhibits48: Chart on Market authorization and regulatory support - Year-over-year growth 2023-2028 (%)
- Exhibits49: Data Table on Market authorization and regulatory support - Year-over-year growth 2023-2028 (%)
- Exhibits50: Market opportunity by Type ($ million)
- Exhibits51: Data Table on Market opportunity by Type ($ million)
- Exhibits52: Analysis of price sensitivity, lifecycle, customer purchase basket, adoption rates, and purchase criteria
- Exhibits53: Chart on Market share By Geographical Landscape 2023-2028 (%)
- Exhibits54: Data Table on Market share By Geographical Landscape 2023-2028 (%)
- Exhibits55: Chart on Geographic comparison
- Exhibits56: Data Table on Geographic comparison
- Exhibits57: Chart on North America - Market size and forecast 2023-2028 ($ million)
- Exhibits58: Data Table on North America - Market size and forecast 2023-2028 ($ million)
- Exhibits59: Chart on North America - Year-over-year growth 2023-2028 (%)
- Exhibits60: Data Table on North America - Year-over-year growth 2023-2028 (%)
- Exhibits61: Chart on Europe - Market size and forecast 2023-2028 ($ million)
- Exhibits62: Data Table on Europe - Market size and forecast 2023-2028 ($ million)
- Exhibits63: Chart on Europe - Year-over-year growth 2023-2028 (%)
- Exhibits64: Data Table on Europe - Year-over-year growth 2023-2028 (%)
- Exhibits65: Chart on Asia - Market size and forecast 2023-2028 ($ million)
- Exhibits66: Data Table on Asia - Market size and forecast 2023-2028 ($ million)
- Exhibits67: Chart on Asia - Year-over-year growth 2023-2028 (%)
- Exhibits68: Data Table on Asia - Year-over-year growth 2023-2028 (%)
- Exhibits69: Chart on Rest of World (ROW) - Market size and forecast 2023-2028 ($ million)
- Exhibits70: Data Table on Rest of World (ROW) - Market size and forecast 2023-2028 ($ million)
- Exhibits71: Chart on Rest of World (ROW) - Year-over-year growth 2023-2028 (%)
- Exhibits72: Data Table on Rest of World (ROW) - Year-over-year growth 2023-2028 (%)
- Exhibits73: Chart on US - Market size and forecast 2023-2028 ($ million)
- Exhibits74: Data Table on US - Market size and forecast 2023-2028 ($ million)
- Exhibits75: Chart on US - Year-over-year growth 2023-2028 (%)
- Exhibits76: Data Table on US - Year-over-year growth 2023-2028 (%)
- Exhibits77: Chart on Canada - Market size and forecast 2023-2028 ($ million)
- Exhibits78: Data Table on Canada - Market size and forecast 2023-2028 ($ million)
- Exhibits79: Chart on Canada - Year-over-year growth 2023-2028 (%)
- Exhibits80: Data Table on Canada - Year-over-year growth 2023-2028 (%)
- Exhibits81: Chart on Germany - Market size and forecast 2023-2028 ($ million)
- Exhibits82: Data Table on Germany - Market size and forecast 2023-2028 ($ million)
- Exhibits83: Chart on Germany - Year-over-year growth 2023-2028 (%)
- Exhibits84: Data Table on Germany - Year-over-year growth 2023-2028 (%)
- Exhibits85: Chart on China - Market size and forecast 2023-2028 ($ million)
- Exhibits86: Data Table on China - Market size and forecast 2023-2028 ($ million)
- Exhibits87: Chart on China - Year-over-year growth 2023-2028 (%)
- Exhibits88: Data Table on China - Year-over-year growth 2023-2028 (%)
- Exhibits89: Chart on UK - Market size and forecast 2023-2028 ($ million)
- Exhibits90: Data Table on UK - Market size and forecast 2023-2028 ($ million)
- Exhibits91: Chart on UK - Year-over-year growth 2023-2028 (%)
- Exhibits92: Data Table on UK - Year-over-year growth 2023-2028 (%)
- Exhibits93: Chart on Mexico - Market size and forecast 2023-2028 ($ million)
- Exhibits94: Data Table on Mexico - Market size and forecast 2023-2028 ($ million)
- Exhibits95: Chart on Mexico - Year-over-year growth 2023-2028 (%)
- Exhibits96: Data Table on Mexico - Year-over-year growth 2023-2028 (%)
- Exhibits97: Chart on France - Market size and forecast 2023-2028 ($ million)
- Exhibits98: Data Table on France - Market size and forecast 2023-2028 ($ million)
- Exhibits99: Chart on France - Year-over-year growth 2023-2028 (%)
- Exhibits100: Data Table on France - Year-over-year growth 2023-2028 (%)
- Exhibits101: Chart on Japan - Market size and forecast 2023-2028 ($ million)
- Exhibits102: Data Table on Japan - Market size and forecast 2023-2028 ($ million)
- Exhibits103: Chart on Japan - Year-over-year growth 2023-2028 (%)
- Exhibits104: Data Table on Japan - Year-over-year growth 2023-2028 (%)
- Exhibits105: Chart on India - Market size and forecast 2023-2028 ($ million)
- Exhibits106: Data Table on India - Market size and forecast 2023-2028 ($ million)
- Exhibits107: Chart on India - Year-over-year growth 2023-2028 (%)
- Exhibits108: Data Table on India - Year-over-year growth 2023-2028 (%)
- Exhibits109: Chart on Spain - Market size and forecast 2023-2028 ($ million)
- Exhibits110: Data Table on Spain - Market size and forecast 2023-2028 ($ million)
- Exhibits111: Chart on Spain - Year-over-year growth 2023-2028 (%)
- Exhibits112: Data Table on Spain - Year-over-year growth 2023-2028 (%)
- Exhibits113: Market opportunity By Geographical Landscape ($ million)
- Exhibits114: Data Tables on Market opportunity By Geographical Landscape ($ million)
- Exhibits115: Impact of drivers and challenges in 2023 and 2028
- Exhibits116: Overview on criticality of inputs and factors of differentiation
- Exhibits117: Overview on factors of disruption
- Exhibits118: Impact of key risks on business
- Exhibits119: Companies covered
- Exhibits120: Company ranking index
- Exhibits121: Matrix on companies position and classification
- Exhibits122: Cebiphar - Overview
- Exhibits123: Cebiphar - Product / Service
- Exhibits124: Cebiphar - Key offerings
- Exhibits125: SWOT
- Exhibits126: Charles River Laboratories International Inc. - Overview
- Exhibits127: Charles River Laboratories International Inc. - Business segments
- Exhibits128: Charles River Laboratories International Inc. - Key offerings
- Exhibits129: Charles River Laboratories International Inc. - Segment focus
- Exhibits130: SWOT
- Exhibits131: Clinvet - Overview
- Exhibits132: Clinvet - Product / Service
- Exhibits133: Clinvet - Key offerings
- Exhibits134: SWOT
- Exhibits135: KLIFOVET GmbH - Overview
- Exhibits136: KLIFOVET GmbH - Product / Service
- Exhibits137: KLIFOVET GmbH - Key offerings
- Exhibits138: SWOT
- Exhibits139: knoell - Overview
- Exhibits140: knoell - Product / Service
- Exhibits141: knoell - Key offerings
- Exhibits142: SWOT
- Exhibits143: Lohlein and Wolf vet research - Overview
- Exhibits144: Lohlein and Wolf vet research - Product / Service
- Exhibits145: Lohlein and Wolf vet research - Key offerings
- Exhibits146: SWOT
- Exhibits147: Oncovet Clinical Research - Overview
- Exhibits148: Oncovet Clinical Research - Product / Service
- Exhibits149: Oncovet Clinical Research - Key offerings
- Exhibits150: SWOT
- Exhibits151: ONDAX Scientific SL - Overview
- Exhibits152: ONDAX Scientific SL - Product / Service
- Exhibits153: ONDAX Scientific SL - Key offerings
- Exhibits154: SWOT
- Exhibits155: Veterinary Research Management - Overview
- Exhibits156: Veterinary Research Management - Product / Service
- Exhibits157: Veterinary Research Management - Key offerings
- Exhibits158: SWOT
- Exhibits159: VETSPIN SRL - Overview
- Exhibits160: VETSPIN SRL - Product / Service
- Exhibits161: VETSPIN SRL - Key offerings
- Exhibits162: SWOT
- Exhibits163: Inclusions checklist
- Exhibits164: Exclusions checklist
- Exhibits165: Currency conversion rates for US$
- Exhibits166: Research methodology
- Exhibits167: Information sources
- Exhibits168: Data validation
- Exhibits169: Validation techniques employed for market sizing
- Exhibits170: Data synthesis
- Exhibits171: 360 degree market analysis
- Exhibits172: List of abbreviations
Veterinary CRO Market 2024-2028
The veterinary cro market is forecasted to grow by USD 200.8 mn during 2023-2028, accelerating at a CAGR of 5.8% during the forecast period. The report on the veterinary cro market provides a holistic analysis, market size and forecast, trends, growth drivers, and challenges, as well as vendor analysis covering around 25 vendors.
The report offers an up-to-date analysis regarding the current market scenario, the latest trends and drivers, and the overall market environment. The market is driven by increase in ownership of companion animals, surge in animal health expenditure, and research and development activities among veterinary medicine manufacturers.
| Market Scope | |
|---|---|
| Base Year | 2024 |
| End Year | 2028 |
| Series Year | 2024-2028 |
| Growth Momentum | Accelerate |
| YOY 2024 | 5.4% |
| CAGR | 5.8% |
| Incremental Value | $200.8 mn |
Technavio's veterinary cro market is segmented as below:
By Type
- Clinical trials
- Toxicology
- Market authorization and regulatory support
By Geographical Landscape
- North America
- Europe
- Asia
- Rest of World (ROW)
This study identifies the increase in prevalence of diseases among companion animals as one of the prime reasons driving the veterinary cro market growth during the next few years. Also, rise in awareness regarding animal healthcare and higher investment in veterinary cro will lead to sizable demand in the market.
The report on the veterinary cro market covers the following areas:
- Veterinary CRO Market sizing
- Veterinary CRO Market forecast
- Veterinary CRO Market industry analysis
The robust vendor analysis is designed to help clients improve their market position, and in line with this, this report provides a detailed analysis of several leading veterinary cro market vendors that include Argenta Ltd., Avogadro LS, Cebiphar, Charles River Laboratories International Inc., Clinvet, GD, Ictyopharma, Invetus, Kingfisher International, KLIFOVET GmbH, knoell, Lohlein and Wolf vet research, Oncovet Clinical Research, ONDAX Scientific SL, Ridgeway Research Ltd., Rockstep Solutions, RTI LLC, Veterinary Research Management, VETSPIN SRL, and Wageningen University and Research. Also, the veterinary cro market analysis report includes information on upcoming trends and challenges that will influence market growth. This is to help companies strategize and leverage all forthcoming growth opportunities.
The study was conducted using an objective combination of primary and secondary information including inputs from key participants in the industry. The report contains a comprehensive market and vendor landscape in addition to an analysis of the key vendors.
The publisher presents a detailed picture of the market by the way of study, synthesis, and summation of data from multiple sources by an analysis of key parameters such as profit, pricing, competition, and promotions. It presents various market facets by identifying the key industry influencers. The data presented is comprehensive, reliable, and a result of extensive primary and secondary research. The market research reports provide a complete competitive landscape and an in-depth vendor selection methodology and analysis using qualitative and quantitative research to forecast accurate market growth.
Table of Contents
1 Executive Summary
- 1.1 Market overview
- Executive Summary - Chart on Market Overview
- Executive Summary - Data Table on Market Overview
- Executive Summary - Chart on Global Market Characteristics
- Executive Summary - Chart on Market By Geographical Landscape
- Executive Summary - Chart on Market Segmentation by Type
- Executive Summary - Chart on Incremental Growth
- Executive Summary - Data Table on Incremental Growth
- Executive Summary - Chart on Company Market Positioning
2 Technavio Analysis
- 2.1 Analysis of price sensitivity, lifecycle, customer purchase basket, adoption rates, and purchase criteria
- Analysis of price sensitivity, lifecycle, customer purchase basket, adoption rates, and purchase criteria
- 2.2 Criticality of inputs and Factors of differentiation
- Overview on criticality of inputs and factors of differentiation
- 2.3 Factors of disruption
- Overview on factors of disruption
- 2.4 Impact of drivers and challenges
- Impact of drivers and challenges in 2023 and 2028
3 Market Landscape
- 3.1 Market ecosystem
- Parent Market
- Data Table on - Parent Market
- 3.2 Market characteristics
- Market characteristics analysis
- 3.3 Value chain analysis
- Value Chain Analysis
4 Market Sizing
- 4.1 Market definition
- Offerings of companies included in the market definition
- 4.2 Market segment analysis
- Market segments
- 4.3 Market size 2023
- 4.4 Market outlook: Forecast for 2023-2028
- Chart on Global - Market size and forecast 2023-2028 ($ million)
- Data Table on Global - Market size and forecast 2023-2028 ($ million)
- Chart on Global Market: Year-over-year growth 2023-2028 (%)
- Data Table on Global Market: Year-over-year growth 2023-2028 (%)
5 Historic Market Size
- 5.1 Global Veterinary CRO Market 2018 - 2022
- Historic Market Size - Data Table on Global Veterinary CRO Market 2018 - 2022 ($ million)
- 5.2 Type segment analysis 2018 - 2022
- Historic Market Size - Type Segment 2018 - 2022 ($ million)
- 5.3 Geography segment analysis 2018 - 2022
- Historic Market Size - Geography Segment 2018 - 2022 ($ million)
- 5.4 Country segment analysis 2018 - 2022
- Historic Market Size - Country Segment 2018 - 2022 ($ million)
6 Qualitative Analysis
- 6.1 The AI impact on Global Veterinary CRO Market
7 Five Forces Analysis
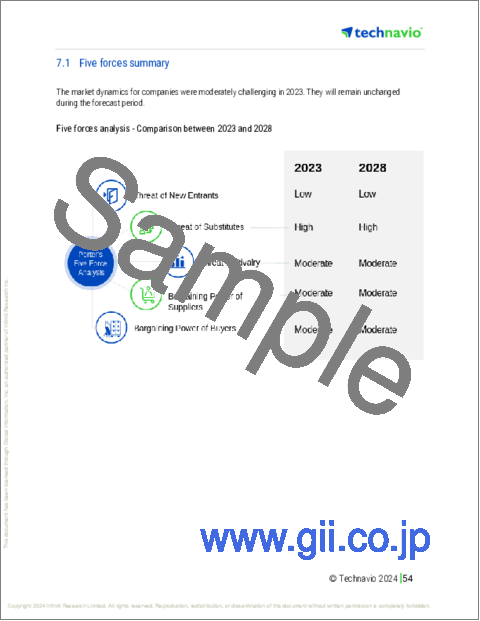
- 7.1 Five forces summary
- Five forces analysis - Comparison between 2023 and 2028
- 7.2 Bargaining power of buyers
- Bargaining power of buyers - Impact of key factors 2023 and 2028
- 7.3 Bargaining power of suppliers
- Bargaining power of suppliers - Impact of key factors in 2023 and 2028
- 7.4 Threat of new entrants
- Threat of new entrants - Impact of key factors in 2023 and 2028
- 7.5 Threat of substitutes
- Threat of substitutes - Impact of key factors in 2023 and 2028
- 7.6 Threat of rivalry
- Threat of rivalry - Impact of key factors in 2023 and 2028
- 7.7 Market condition
- Chart on Market condition - Five forces 2023 and 2028
8 Market Segmentation by Type
- 8.1 Market segments
- Chart on Type - Market share 2023-2028 (%)
- Data Table on Type - Market share 2023-2028 (%)
- 8.2 Comparison by Type
- Chart on Comparison by Type
- Data Table on Comparison by Type
- 8.3 Clinical trials - Market size and forecast 2023-2028
- Chart on Clinical trials - Market size and forecast 2023-2028 ($ million)
- Data Table on Clinical trials - Market size and forecast 2023-2028 ($ million)
- Chart on Clinical trials - Year-over-year growth 2023-2028 (%)
- Data Table on Clinical trials - Year-over-year growth 2023-2028 (%)
- 8.4 Toxicology - Market size and forecast 2023-2028
- Chart on Toxicology - Market size and forecast 2023-2028 ($ million)
- Data Table on Toxicology - Market size and forecast 2023-2028 ($ million)
- Chart on Toxicology - Year-over-year growth 2023-2028 (%)
- Data Table on Toxicology - Year-over-year growth 2023-2028 (%)
- 8.5 Market authorization and regulatory support - Market size and forecast 2023-2028
- Chart on Market authorization and regulatory support - Market size and forecast 2023-2028 ($ million)
- Data Table on Market authorization and regulatory support - Market size and forecast 2023-2028 ($ million)
- Chart on Market authorization and regulatory support - Year-over-year growth 2023-2028 (%)
- Data Table on Market authorization and regulatory support - Year-over-year growth 2023-2028 (%)
- 8.6 Market opportunity by Type
- Market opportunity by Type ($ million)
- Data Table on Market opportunity by Type ($ million)
9 Customer Landscape
- 9.1 Customer landscape overview
- Analysis of price sensitivity, lifecycle, customer purchase basket, adoption rates, and purchase criteria
10 Geographic Landscape
- 10.1 Geographic segmentation
- Chart on Market share By Geographical Landscape 2023-2028 (%)
- Data Table on Market share By Geographical Landscape 2023-2028 (%)
- 10.2 Geographic comparison
- Chart on Geographic comparison
- Data Table on Geographic comparison
- 10.3 North America - Market size and forecast 2023-2028
- Chart on North America - Market size and forecast 2023-2028 ($ million)
- Data Table on North America - Market size and forecast 2023-2028 ($ million)
- Chart on North America - Year-over-year growth 2023-2028 (%)
- Data Table on North America - Year-over-year growth 2023-2028 (%)
- 10.4 Europe - Market size and forecast 2023-2028
- Chart on Europe - Market size and forecast 2023-2028 ($ million)
- Data Table on Europe - Market size and forecast 2023-2028 ($ million)
- Chart on Europe - Year-over-year growth 2023-2028 (%)
- Data Table on Europe - Year-over-year growth 2023-2028 (%)
- 10.5 Asia - Market size and forecast 2023-2028
- Chart on Asia - Market size and forecast 2023-2028 ($ million)
- Data Table on Asia - Market size and forecast 2023-2028 ($ million)
- Chart on Asia - Year-over-year growth 2023-2028 (%)
- Data Table on Asia - Year-over-year growth 2023-2028 (%)
- 10.6 Rest of World (ROW) - Market size and forecast 2023-2028
- Chart on Rest of World (ROW) - Market size and forecast 2023-2028 ($ million)
- Data Table on Rest of World (ROW) - Market size and forecast 2023-2028 ($ million)
- Chart on Rest of World (ROW) - Year-over-year growth 2023-2028 (%)
- Data Table on Rest of World (ROW) - Year-over-year growth 2023-2028 (%)
- 10.7 US - Market size and forecast 2023-2028
- Chart on US - Market size and forecast 2023-2028 ($ million)
- Data Table on US - Market size and forecast 2023-2028 ($ million)
- Chart on US - Year-over-year growth 2023-2028 (%)
- Data Table on US - Year-over-year growth 2023-2028 (%)
- 10.8 Canada - Market size and forecast 2023-2028
- Chart on Canada - Market size and forecast 2023-2028 ($ million)
- Data Table on Canada - Market size and forecast 2023-2028 ($ million)
- Chart on Canada - Year-over-year growth 2023-2028 (%)
- Data Table on Canada - Year-over-year growth 2023-2028 (%)
- 10.9 Germany - Market size and forecast 2023-2028
- Chart on Germany - Market size and forecast 2023-2028 ($ million)
- Data Table on Germany - Market size and forecast 2023-2028 ($ million)
- Chart on Germany - Year-over-year growth 2023-2028 (%)
- Data Table on Germany - Year-over-year growth 2023-2028 (%)
- 10.10 China - Market size and forecast 2023-2028
- Chart on China - Market size and forecast 2023-2028 ($ million)
- Data Table on China - Market size and forecast 2023-2028 ($ million)
- Chart on China - Year-over-year growth 2023-2028 (%)
- Data Table on China - Year-over-year growth 2023-2028 (%)
- 10.11 UK - Market size and forecast 2023-2028
- Chart on UK - Market size and forecast 2023-2028 ($ million)
- Data Table on UK - Market size and forecast 2023-2028 ($ million)
- Chart on UK - Year-over-year growth 2023-2028 (%)
- Data Table on UK - Year-over-year growth 2023-2028 (%)
- 10.12 Mexico - Market size and forecast 2023-2028
- Chart on Mexico - Market size and forecast 2023-2028 ($ million)
- Data Table on Mexico - Market size and forecast 2023-2028 ($ million)
- Chart on Mexico - Year-over-year growth 2023-2028 (%)
- Data Table on Mexico - Year-over-year growth 2023-2028 (%)
- 10.13 France - Market size and forecast 2023-2028
- Chart on France - Market size and forecast 2023-2028 ($ million)
- Data Table on France - Market size and forecast 2023-2028 ($ million)
- Chart on France - Year-over-year growth 2023-2028 (%)
- Data Table on France - Year-over-year growth 2023-2028 (%)
- 10.14 Japan - Market size and forecast 2023-2028
- Chart on Japan - Market size and forecast 2023-2028 ($ million)
- Data Table on Japan - Market size and forecast 2023-2028 ($ million)
- Chart on Japan - Year-over-year growth 2023-2028 (%)
- Data Table on Japan - Year-over-year growth 2023-2028 (%)
- 10.15 India - Market size and forecast 2023-2028
- Chart on India - Market size and forecast 2023-2028 ($ million)
- Data Table on India - Market size and forecast 2023-2028 ($ million)
- Chart on India - Year-over-year growth 2023-2028 (%)
- Data Table on India - Year-over-year growth 2023-2028 (%)
- 10.16 Spain - Market size and forecast 2023-2028
- Chart on Spain - Market size and forecast 2023-2028 ($ million)
- Data Table on Spain - Market size and forecast 2023-2028 ($ million)
- Chart on Spain - Year-over-year growth 2023-2028 (%)
- Data Table on Spain - Year-over-year growth 2023-2028 (%)
- 10.17 Market opportunity By Geographical Landscape
- Market opportunity By Geographical Landscape ($ million)
- Data Tables on Market opportunity By Geographical Landscape ($ million)
11 Drivers, Challenges, and Opportunity/Restraints
- 11.1 Market drivers
- 11.2 Market challenges
- 11.3 Impact of drivers and challenges
- Impact of drivers and challenges in 2023 and 2028
- 11.4 Market opportunities/restraints
12 Competitive Landscape
- 12.1 Overview
- 12.2 Competitive Landscape
- Overview on criticality of inputs and factors of differentiation
- 12.3 Landscape disruption
- Overview on factors of disruption
- 12.4 Industry risks
- Impact of key risks on business
13 Competitive Analysis
- 13.1 Companies profiled
- Companies covered
- 13.2 Company ranking index
- Company ranking index
- 13.3 Market positioning of companies
- Matrix on companies position and classification
- 13.4 Cebiphar
- Cebiphar - Overview
- Cebiphar - Product / Service
- Cebiphar - Key offerings
- SWOT
- 13.5 Charles River Laboratories International Inc.
- Charles River Laboratories International Inc. - Overview
- Charles River Laboratories International Inc. - Business segments
- Charles River Laboratories International Inc. - Key offerings
- Charles River Laboratories International Inc. - Segment focus
- SWOT
- 13.6 Clinvet
- Clinvet - Overview
- Clinvet - Product / Service
- Clinvet - Key offerings
- SWOT
- 13.7 KLIFOVET GmbH
- KLIFOVET GmbH - Overview
- KLIFOVET GmbH - Product / Service
- KLIFOVET GmbH - Key offerings
- SWOT
- 13.8 knoell
- knoell - Overview
- knoell - Product / Service
- knoell - Key offerings
- SWOT
- 13.9 Lohlein and Wolf vet research
- Lohlein and Wolf vet research - Overview
- Lohlein and Wolf vet research - Product / Service
- Lohlein and Wolf vet research - Key offerings
- SWOT
- 13.10 Oncovet Clinical Research
- Oncovet Clinical Research - Overview
- Oncovet Clinical Research - Product / Service
- Oncovet Clinical Research - Key offerings
- SWOT
- 13.11 ONDAX Scientific SL
- ONDAX Scientific SL - Overview
- ONDAX Scientific SL - Product / Service
- ONDAX Scientific SL - Key offerings
- SWOT
- 13.12 Veterinary Research Management
- Veterinary Research Management - Overview
- Veterinary Research Management - Product / Service
- Veterinary Research Management - Key offerings
- SWOT
- 13.13 VETSPIN SRL
- VETSPIN SRL - Overview
- VETSPIN SRL - Product / Service
- VETSPIN SRL - Key offerings
- SWOT
14 Appendix
- 14.1 Scope of the report
- 14.2 Inclusions and exclusions checklist
- Inclusions checklist
- Exclusions checklist
- 14.3 Currency conversion rates for US$
- Currency conversion rates for US$
- 14.4 Research methodology
- Research methodology
- 14.5 Data procurement
- Information sources
- 14.6 Data validation
- Data validation
- 14.7 Validation techniques employed for market sizing
- Validation techniques employed for market sizing
- 14.8 Data synthesis
- Data synthesis
- 14.9 360 degree market analysis
- 360 degree market analysis
- 14.10 List of abbreviations
- List of abbreviations
