|
|
市場調査レポート
商品コード
1584054
抗菌包装の世界市場、2024~2028年Global Antimicrobial Packaging Market 2024-2028 |
||||||

|
|||||||
カスタマイズ可能
|
|||||||

| 抗菌包装の世界市場、2024~2028年 |
|
出版日: 2024年10月11日
発行: TechNavio
ページ情報: 英文 164 Pages
納期: 即納可能
|

全表示
- 概要
- 図表
- 目次
抗菌包装市場、2024~2028年
抗菌包装市場は2023~2028年に49億3,500万米ドル、予測期間中のCAGRは7.4%で成長すると予測されます。当レポートでは、抗菌包装市場の全体的な分析、市場規模・予測、動向、成長促進要因、課題、約25のベンダーを網羅したベンダー分析などを掲載しています。
現在の市場シナリオ、最新動向と促進要因、市場環境全体に関する最新分析を提供しています。市場は、包装飲料の消費拡大、消費者の健康に対する意識の高まりと製品の保存性の向上、医療業界からの抗菌包装に対する需要の高まりによって牽引されています。
| 市場範囲 | |
|---|---|
| 基準年 | 2024年 |
| 終了年 | 2028年 |
| 予測期間 | 2024~2028年 |
| 成長モメンタム | 加速 |
| 前年比[2024年] | 6.4% |
| CAGR | 7.4% |
| 増分額 | 49億3,500万米ドル |
本調査では、今後数年間の抗菌包装市場成長を促進する主要要因の一つとして、持続可能で生分解可能な抗菌包装ソリューションの採用を挙げています。また、抗菌包装製品の技術開拓と世界の人々の可処分所得の急増は、市場の大きな需要につながると考えられます。
目次
第1章 エグゼクティブサマリー
- 市場概要
第2章 市場情勢
- 市場エコシステム
- 市場の特徴
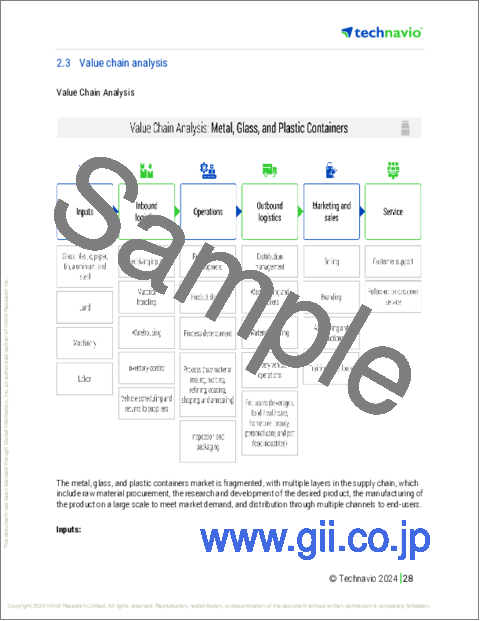
- バリューチェーン分析
第3章 市場規模の評価
- 市場の定義
- 市場セグメント分析
- 市場規模 2023年
- 市場の展望 2023~2028年
第4章 市場規模実績
- 抗菌包装の世界市場 2018~2022年
- 材料別セグメント分析 2018~2022年
- タイプ別セグメント分析 2018~2022年
- 地域別セグメント分析 2018~2022年
- 国別セグメント分析 2018~2022年
第5章 ファイブフォース分析
- ファイブフォースの要約
- 買い手の交渉力
- 供給企業の交渉力
- 新規参入業者の脅威
- 代替品の脅威
- 競争の脅威
- 市況
第6章 材料別市場セグメンテーション
- 市場セグメンテーション
- 比較:材料別
- プラスチック:市場規模と予測 2023~2028年
- バイオポリマー:市場規模と予測 2023~2028年
- 板紙:市場規模と予測 2023~2028年
- 材料別の市場機会
第7章 タイプ別市場セグメンテーション
- 市場セグメンテーション
- 比較:タイプ別
- バッグ:市場規模と予測 2023~2028年
- ポーチ:市場規模と予測 2023~2028年
- トレイ:市場規模と予測 2023~2028年
- カートンパッケージ:市場規模と予測 2023~2028年
- その他:市場規模と予測 2023~2028年
- タイプ別の市場機会
第8章 顧客情勢
- 顧客情勢概要
第9章 地域別情勢
- 地域別セグメンテーション
- 比較:地域別
- 北米:市場規模と予測 2023~2028年
- 欧州:市場規模と予測 2023~2028年
- アジア太平洋:市場規模と予測 2023~2028年
- 南米:市場規模と予測 2023~2028年
- 中東・アフリカ:市場規模と予測 2023~2028年
- 米国:市場規模と予測 2023~2028年
- ドイツ:市場規模と予測 2023~2028年
- 中国:市場規模と予測 2023~2028年
- 英国:市場規模と予測 2023~2028年
- 日本:市場規模と予測 2023~2028年
- 地域情勢別の市場機会
第10章 促進要因・課題・機会・抑制要因
- 市場促進要因
- 市場課題
- 促進要因と課題の影響
- 市場機会・抑制要因
第11章 競合情勢
- 概要
- 競合情勢
- 混乱の状況
- 業界のリスク
第12章 競合分析
- 企業プロファイル
- 企業の市場ポジショニング
- API Group Corp.
- AptarGroup Inc.
- Avient Corp.
- BASF SE
- Berry Global Inc.
- BioCote Ltd.
- Dow Inc.
- Ecoduka
- KP Holding GmbH and Co. KG
- Lageen Tubes
- MicrobeGuard Corp.
- Mondi Plc
- Saudi Basic Industries Corp.
- Sciessent LLC
- Tekni Plex Inc.
第13章 付録
Exhibits:
- Exhibits1: Executive Summary - Chart on Market Overview
- Exhibits2: Executive Summary - Data Table on Market Overview
- Exhibits3: Executive Summary - Chart on Global Market Characteristics
- Exhibits4: Executive Summary - Chart on Market By Geographical Landscape
- Exhibits5: Executive Summary - Chart on Market Segmentation by Material
- Exhibits6: Executive Summary - Chart on Market Segmentation by Type
- Exhibits7: Executive Summary - Chart on Incremental Growth
- Exhibits8: Executive Summary - Data Table on Incremental Growth
- Exhibits9: Executive Summary - Chart on Company Market Positioning
- Exhibits10: Parent Market
- Exhibits11: Data Table on - Parent Market
- Exhibits12: Market characteristics analysis
- Exhibits13: Value Chain Analysis
- Exhibits14: Offerings of companies included in the market definition
- Exhibits15: Market segments
- Exhibits16: Chart on Global - Market size and forecast 2023-2028 ($ million)
- Exhibits17: Data Table on Global - Market size and forecast 2023-2028 ($ million)
- Exhibits18: Chart on Global Market: Year-over-year growth 2023-2028 (%)
- Exhibits19: Data Table on Global Market: Year-over-year growth 2023-2028 (%)
- Exhibits20: Historic Market Size - Data Table on Global Antimicrobial Packaging Market 2018 - 2022 ($ million)
- Exhibits21: Historic Market Size - Material Segment 2018 - 2022 ($ million)
- Exhibits22: Historic Market Size - Type Segment 2018 - 2022 ($ million)
- Exhibits23: Historic Market Size - Geography Segment 2018 - 2022 ($ million)
- Exhibits24: Historic Market Size - Country Segment 2018 - 2022 ($ million)
- Exhibits25: Five forces analysis - Comparison between 2023 and 2028
- Exhibits26: Bargaining power of buyers - Impact of key factors 2023 and 2028
- Exhibits27: Bargaining power of suppliers - Impact of key factors in 2023 and 2028
- Exhibits28: Threat of new entrants - Impact of key factors in 2023 and 2028
- Exhibits29: Threat of substitutes - Impact of key factors in 2023 and 2028
- Exhibits30: Threat of rivalry - Impact of key factors in 2023 and 2028
- Exhibits31: Chart on Market condition - Five forces 2023 and 2028
- Exhibits32: Chart on Material - Market share 2023-2028 (%)
- Exhibits33: Data Table on Material - Market share 2023-2028 (%)
- Exhibits34: Chart on Comparison by Material
- Exhibits35: Data Table on Comparison by Material
- Exhibits36: Chart on Plastic - Market size and forecast 2023-2028 ($ million)
- Exhibits37: Data Table on Plastic - Market size and forecast 2023-2028 ($ million)
- Exhibits38: Chart on Plastic - Year-over-year growth 2023-2028 (%)
- Exhibits39: Data Table on Plastic - Year-over-year growth 2023-2028 (%)
- Exhibits40: Chart on Biopolymer - Market size and forecast 2023-2028 ($ million)
- Exhibits41: Data Table on Biopolymer - Market size and forecast 2023-2028 ($ million)
- Exhibits42: Chart on Biopolymer - Year-over-year growth 2023-2028 (%)
- Exhibits43: Data Table on Biopolymer - Year-over-year growth 2023-2028 (%)
- Exhibits44: Chart on Paperboard - Market size and forecast 2023-2028 ($ million)
- Exhibits45: Data Table on Paperboard - Market size and forecast 2023-2028 ($ million)
- Exhibits46: Chart on Paperboard - Year-over-year growth 2023-2028 (%)
- Exhibits47: Data Table on Paperboard - Year-over-year growth 2023-2028 (%)
- Exhibits48: Market opportunity by Material ($ million)
- Exhibits49: Data Table on Market opportunity by Material ($ million)
- Exhibits50: Chart on Type - Market share 2023-2028 (%)
- Exhibits51: Data Table on Type - Market share 2023-2028 (%)
- Exhibits52: Chart on Comparison by Type
- Exhibits53: Data Table on Comparison by Type
- Exhibits54: Chart on Bags - Market size and forecast 2023-2028 ($ million)
- Exhibits55: Data Table on Bags - Market size and forecast 2023-2028 ($ million)
- Exhibits56: Chart on Bags - Year-over-year growth 2023-2028 (%)
- Exhibits57: Data Table on Bags - Year-over-year growth 2023-2028 (%)
- Exhibits58: Chart on Pouches - Market size and forecast 2023-2028 ($ million)
- Exhibits59: Data Table on Pouches - Market size and forecast 2023-2028 ($ million)
- Exhibits60: Chart on Pouches - Year-over-year growth 2023-2028 (%)
- Exhibits61: Data Table on Pouches - Year-over-year growth 2023-2028 (%)
- Exhibits62: Chart on Trays - Market size and forecast 2023-2028 ($ million)
- Exhibits63: Data Table on Trays - Market size and forecast 2023-2028 ($ million)
- Exhibits64: Chart on Trays - Year-over-year growth 2023-2028 (%)
- Exhibits65: Data Table on Trays - Year-over-year growth 2023-2028 (%)
- Exhibits66: Chart on Carton packages - Market size and forecast 2023-2028 ($ million)
- Exhibits67: Data Table on Carton packages - Market size and forecast 2023-2028 ($ million)
- Exhibits68: Chart on Carton packages - Year-over-year growth 2023-2028 (%)
- Exhibits69: Data Table on Carton packages - Year-over-year growth 2023-2028 (%)
- Exhibits70: Chart on Others - Market size and forecast 2023-2028 ($ million)
- Exhibits71: Data Table on Others - Market size and forecast 2023-2028 ($ million)
- Exhibits72: Chart on Others - Year-over-year growth 2023-2028 (%)
- Exhibits73: Data Table on Others - Year-over-year growth 2023-2028 (%)
- Exhibits74: Market opportunity by Type ($ million)
- Exhibits75: Data Table on Market opportunity by Type ($ million)
- Exhibits76: Analysis of price sensitivity, lifecycle, customer purchase basket, adoption rates, and purchase criteria
- Exhibits77: Chart on Market share By Geographical Landscape 2023-2028 (%)
- Exhibits78: Data Table on Market share By Geographical Landscape 2023-2028 (%)
- Exhibits79: Chart on Geographic comparison
- Exhibits80: Data Table on Geographic comparison
- Exhibits81: Chart on North America - Market size and forecast 2023-2028 ($ million)
- Exhibits82: Data Table on North America - Market size and forecast 2023-2028 ($ million)
- Exhibits83: Chart on North America - Year-over-year growth 2023-2028 (%)
- Exhibits84: Data Table on North America - Year-over-year growth 2023-2028 (%)
- Exhibits85: Chart on Europe - Market size and forecast 2023-2028 ($ million)
- Exhibits86: Data Table on Europe - Market size and forecast 2023-2028 ($ million)
- Exhibits87: Chart on Europe - Year-over-year growth 2023-2028 (%)
- Exhibits88: Data Table on Europe - Year-over-year growth 2023-2028 (%)
- Exhibits89: Chart on APAC - Market size and forecast 2023-2028 ($ million)
- Exhibits90: Data Table on APAC - Market size and forecast 2023-2028 ($ million)
- Exhibits91: Chart on APAC - Year-over-year growth 2023-2028 (%)
- Exhibits92: Data Table on APAC - Year-over-year growth 2023-2028 (%)
- Exhibits93: Chart on South America - Market size and forecast 2023-2028 ($ million)
- Exhibits94: Data Table on South America - Market size and forecast 2023-2028 ($ million)
- Exhibits95: Chart on South America - Year-over-year growth 2023-2028 (%)
- Exhibits96: Data Table on South America - Year-over-year growth 2023-2028 (%)
- Exhibits97: Chart on Middle East and Africa - Market size and forecast 2023-2028 ($ million)
- Exhibits98: Data Table on Middle East and Africa - Market size and forecast 2023-2028 ($ million)
- Exhibits99: Chart on Middle East and Africa - Year-over-year growth 2023-2028 (%)
- Exhibits100: Data Table on Middle East and Africa - Year-over-year growth 2023-2028 (%)
- Exhibits101: Chart on US - Market size and forecast 2023-2028 ($ million)
- Exhibits102: Data Table on US - Market size and forecast 2023-2028 ($ million)
- Exhibits103: Chart on US - Year-over-year growth 2023-2028 (%)
- Exhibits104: Data Table on US - Year-over-year growth 2023-2028 (%)
- Exhibits105: Chart on Germany - Market size and forecast 2023-2028 ($ million)
- Exhibits106: Data Table on Germany - Market size and forecast 2023-2028 ($ million)
- Exhibits107: Chart on Germany - Year-over-year growth 2023-2028 (%)
- Exhibits108: Data Table on Germany - Year-over-year growth 2023-2028 (%)
- Exhibits109: Chart on China - Market size and forecast 2023-2028 ($ million)
- Exhibits110: Data Table on China - Market size and forecast 2023-2028 ($ million)
- Exhibits111: Chart on China - Year-over-year growth 2023-2028 (%)
- Exhibits112: Data Table on China - Year-over-year growth 2023-2028 (%)
- Exhibits113: Chart on UK - Market size and forecast 2023-2028 ($ million)
- Exhibits114: Data Table on UK - Market size and forecast 2023-2028 ($ million)
- Exhibits115: Chart on UK - Year-over-year growth 2023-2028 (%)
- Exhibits116: Data Table on UK - Year-over-year growth 2023-2028 (%)
- Exhibits117: Chart on Japan - Market size and forecast 2023-2028 ($ million)
- Exhibits118: Data Table on Japan - Market size and forecast 2023-2028 ($ million)
- Exhibits119: Chart on Japan - Year-over-year growth 2023-2028 (%)
- Exhibits120: Data Table on Japan - Year-over-year growth 2023-2028 (%)
- Exhibits121: Market opportunity By Geographical Landscape ($ million)
- Exhibits122: Data Tables on Market opportunity By Geographical Landscape ($ million)
- Exhibits123: Impact of drivers and challenges in 2023 and 2028
- Exhibits124: Overview on criticality of inputs and factors of differentiation
- Exhibits125: Overview on factors of disruption
- Exhibits126: Impact of key risks on business
- Exhibits127: Companies covered
- Exhibits128: Matrix on companies position and classification
- Exhibits129: API Group Corp. - Overview
- Exhibits130: API Group Corp. - Business segments
- Exhibits131: API Group Corp. - Key news
- Exhibits132: API Group Corp. - Key offerings
- Exhibits133: API Group Corp. - Segment focus
- Exhibits134: AptarGroup Inc. - Overview
- Exhibits135: AptarGroup Inc. - Business segments
- Exhibits136: AptarGroup Inc. - Key news
- Exhibits137: AptarGroup Inc. - Key offerings
- Exhibits138: AptarGroup Inc. - Segment focus
- Exhibits139: Avient Corp. - Overview
- Exhibits140: Avient Corp. - Business segments
- Exhibits141: Avient Corp. - Key news
- Exhibits142: Avient Corp. - Key offerings
- Exhibits143: Avient Corp. - Segment focus
- Exhibits144: BASF SE - Overview
- Exhibits145: BASF SE - Business segments
- Exhibits146: BASF SE - Key news
- Exhibits147: BASF SE - Key offerings
- Exhibits148: BASF SE - Segment focus
- Exhibits149: Berry Global Inc. - Overview
- Exhibits150: Berry Global Inc. - Business segments
- Exhibits151: Berry Global Inc. - Key news
- Exhibits152: Berry Global Inc. - Key offerings
- Exhibits153: Berry Global Inc. - Segment focus
- Exhibits154: BioCote Ltd. - Overview
- Exhibits155: BioCote Ltd. - Product / Service
- Exhibits156: BioCote Ltd. - Key offerings
- Exhibits157: Dow Inc. - Overview
- Exhibits158: Dow Inc. - Business segments
- Exhibits159: Dow Inc. - Key news
- Exhibits160: Dow Inc. - Key offerings
- Exhibits161: Dow Inc. - Segment focus
- Exhibits162: Ecoduka - Overview
- Exhibits163: Ecoduka - Product / Service
- Exhibits164: Ecoduka - Key offerings
- Exhibits165: KP Holding GmbH and Co. KG - Overview
- Exhibits166: KP Holding GmbH and Co. KG - Product / Service
- Exhibits167: KP Holding GmbH and Co. KG - Key offerings
- Exhibits168: Lageen Tubes - Overview
- Exhibits169: Lageen Tubes - Product / Service
- Exhibits170: Lageen Tubes - Key offerings
- Exhibits171: MicrobeGuard Corp. - Overview
- Exhibits172: MicrobeGuard Corp. - Product / Service
- Exhibits173: MicrobeGuard Corp. - Key offerings
- Exhibits174: Mondi Plc - Overview
- Exhibits175: Mondi Plc - Business segments
- Exhibits176: Mondi Plc - Key news
- Exhibits177: Mondi Plc - Key offerings
- Exhibits178: Mondi Plc - Segment focus
- Exhibits179: Saudi Basic Industries Corp. - Overview
- Exhibits180: Saudi Basic Industries Corp. - Business segments
- Exhibits181: Saudi Basic Industries Corp. - Key offerings
- Exhibits182: Saudi Basic Industries Corp. - Segment focus
- Exhibits183: Sciessent LLC - Overview
- Exhibits184: Sciessent LLC - Product / Service
- Exhibits185: Sciessent LLC - Key offerings
- Exhibits186: Tekni Plex Inc. - Overview
- Exhibits187: Tekni Plex Inc. - Product / Service
- Exhibits188: Tekni Plex Inc. - Key offerings
- Exhibits189: Inclusions checklist
- Exhibits190: Exclusions checklist
- Exhibits191: Currency conversion rates for US$
- Exhibits192: Research methodology
- Exhibits193: Information sources
- Exhibits194: Data validation
- Exhibits195: Validation techniques employed for market sizing
- Exhibits196: Data synthesis
- Exhibits197: 360 degree market analysis
- Exhibits198: List of abbreviations
Antimicrobial Packaging Market 2024-2028
The antimicrobial packaging market is forecasted to grow by USD 4935 mn during 2023-2028, accelerating at a CAGR of 7.4% during the forecast period. The report on the antimicrobial packaging market provides a holistic analysis, market size and forecast, trends, growth drivers, and challenges, as well as vendor analysis covering around 25 vendors.
The report offers an up-to-date analysis regarding the current market scenario, the latest trends and drivers, and the overall market environment. The market is driven by growing consumption of packaged beverages, increase in awareness of consumer health and better product shelf lives, and rising demand for antimicrobial packaging from healthcare industry.
| Market Scope | |
|---|---|
| Base Year | 2024 |
| End Year | 2028 |
| Series Year | 2024-2028 |
| Growth Momentum | Accelerate |
| YOY 2024 | 6.4% |
| CAGR | 7.4% |
| Incremental Value | $4935 mn |
Technavio's antimicrobial packaging market is segmented as below:
By Material
- Plastic
- Biopolymer
- Paperboard
By Type
- Bags
- Pouches
- Trays
- Carton packages
- Others
By Geographical Landscape
- North America
- Europe
- APAC
- South America
- Middle East and Africa
This study identifies the adoption of sustainable and biodegradable antimicrobial packaging solutions as one of the prime reasons driving the antimicrobial packaging market growth during the next few years. Also, technological developments in antimicrobial packaging products and surge in disposable income of people worldwide will lead to sizable demand in the market.
The report on the antimicrobial packaging market covers the following areas:
- Antimicrobial Packaging Market sizing
- Antimicrobial Packaging Market forecast
- Antimicrobial Packaging Market industry analysis
The robust vendor analysis is designed to help clients improve their market position, and in line with this, this report provides a detailed analysis of several leading antimicrobial packaging market vendors that include API Group Corp., AptarGroup Inc., Avient Corp., BASF SE, Berry Global Inc., BioCote Ltd., COEXPAN SA, Dow Inc., Ecoduka, Great American Packaging, KP Holding GmbH and Co. KG, Lageen Tubes, MicrobeGuard Corp., Mondi Plc, Parx Materials N.V, RTP Co., Saudi Basic Industries Corp., Sciessent LLC, Tekni Plex Inc., and Xiamen Changsu Industrial Co. Ltd.. Also, the antimicrobial packaging market analysis report includes information on upcoming trends and challenges that will influence market growth. This is to help companies strategize and leverage all forthcoming growth opportunities.
The study was conducted using an objective combination of primary and secondary information including inputs from key participants in the industry. The report contains a comprehensive market and vendor landscape in addition to an analysis of the key vendors.
The publisher presents a detailed picture of the market by the way of study, synthesis, and summation of data from multiple sources by an analysis of key parameters such as profit, pricing, competition, and promotions. It presents various market facets by identifying the key industry influencers. The data presented is comprehensive, reliable, and a result of extensive primary and secondary research. The market research reports provide a complete competitive landscape and an in-depth vendor selection methodology and analysis using qualitative and quantitative research to forecast accurate market growth.
Table of Contents
1 Executive Summary
- 1.1 Market overview
- Executive Summary - Chart on Market Overview
- Executive Summary - Data Table on Market Overview
- Executive Summary - Chart on Global Market Characteristics
- Executive Summary - Chart on Market By Geographical Landscape
- Executive Summary - Chart on Market Segmentation by Material
- Executive Summary - Chart on Market Segmentation by Type
- Executive Summary - Chart on Incremental Growth
- Executive Summary - Data Table on Incremental Growth
- Executive Summary - Chart on Company Market Positioning
2 Market Landscape
- 2.1 Market ecosystem
- Parent Market
- Data Table on - Parent Market
- 2.2 Market characteristics
- Market characteristics analysis
- 2.3 Value chain analysis
- Value Chain Analysis
3 Market Sizing
- 3.1 Market definition
- Offerings of companies included in the market definition
- 3.2 Market segment analysis
- Market segments
- 3.3 Market size 2023
- 3.4 Market outlook: Forecast for 2023-2028
- Chart on Global - Market size and forecast 2023-2028 ($ million)
- Data Table on Global - Market size and forecast 2023-2028 ($ million)
- Chart on Global Market: Year-over-year growth 2023-2028 (%)
- Data Table on Global Market: Year-over-year growth 2023-2028 (%)
4 Historic Market Size
- 4.1 Global Antimicrobial Packaging Market 2018 - 2022
- Historic Market Size - Data Table on Global Antimicrobial Packaging Market 2018 - 2022 ($ million)
- 4.2 Material segment analysis 2018 - 2022
- Historic Market Size - Material Segment 2018 - 2022 ($ million)
- 4.3 Type segment analysis 2018 - 2022
- Historic Market Size - Type Segment 2018 - 2022 ($ million)
- 4.4 Geography segment analysis 2018 - 2022
- Historic Market Size - Geography Segment 2018 - 2022 ($ million)
- 4.5 Country segment analysis 2018 - 2022
- Historic Market Size - Country Segment 2018 - 2022 ($ million)
5 Five Forces Analysis
- 5.1 Five forces summary
- Five forces analysis - Comparison between 2023 and 2028
- 5.2 Bargaining power of buyers
- Bargaining power of buyers - Impact of key factors 2023 and 2028
- 5.3 Bargaining power of suppliers
- Bargaining power of suppliers - Impact of key factors in 2023 and 2028
- 5.4 Threat of new entrants
- Threat of new entrants - Impact of key factors in 2023 and 2028
- 5.5 Threat of substitutes
- Threat of substitutes - Impact of key factors in 2023 and 2028
- 5.6 Threat of rivalry
- Threat of rivalry - Impact of key factors in 2023 and 2028
- 5.7 Market condition
- Chart on Market condition - Five forces 2023 and 2028
6 Market Segmentation by Material
- 6.1 Market segments
- Chart on Material - Market share 2023-2028 (%)
- Data Table on Material - Market share 2023-2028 (%)
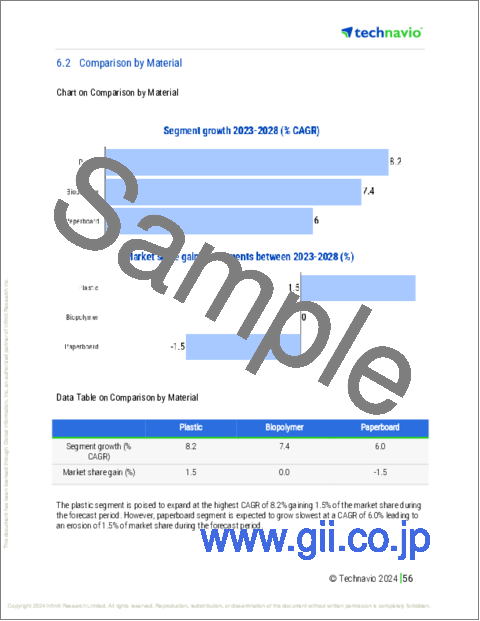
- 6.2 Comparison by Material
- Chart on Comparison by Material
- Data Table on Comparison by Material
- 6.3 Plastic - Market size and forecast 2023-2028
- Chart on Plastic - Market size and forecast 2023-2028 ($ million)
- Data Table on Plastic - Market size and forecast 2023-2028 ($ million)
- Chart on Plastic - Year-over-year growth 2023-2028 (%)
- Data Table on Plastic - Year-over-year growth 2023-2028 (%)
- 6.4 Biopolymer - Market size and forecast 2023-2028
- Chart on Biopolymer - Market size and forecast 2023-2028 ($ million)
- Data Table on Biopolymer - Market size and forecast 2023-2028 ($ million)
- Chart on Biopolymer - Year-over-year growth 2023-2028 (%)
- Data Table on Biopolymer - Year-over-year growth 2023-2028 (%)
- 6.5 Paperboard - Market size and forecast 2023-2028
- Chart on Paperboard - Market size and forecast 2023-2028 ($ million)
- Data Table on Paperboard - Market size and forecast 2023-2028 ($ million)
- Chart on Paperboard - Year-over-year growth 2023-2028 (%)
- Data Table on Paperboard - Year-over-year growth 2023-2028 (%)
- 6.6 Market opportunity by Material
- Market opportunity by Material ($ million)
- Data Table on Market opportunity by Material ($ million)
7 Market Segmentation by Type
- 7.1 Market segments
- Chart on Type - Market share 2023-2028 (%)
- Data Table on Type - Market share 2023-2028 (%)
- 7.2 Comparison by Type
- Chart on Comparison by Type
- Data Table on Comparison by Type
- 7.3 Bags - Market size and forecast 2023-2028
- Chart on Bags - Market size and forecast 2023-2028 ($ million)
- Data Table on Bags - Market size and forecast 2023-2028 ($ million)
- Chart on Bags - Year-over-year growth 2023-2028 (%)
- Data Table on Bags - Year-over-year growth 2023-2028 (%)
- 7.4 Pouches - Market size and forecast 2023-2028
- Chart on Pouches - Market size and forecast 2023-2028 ($ million)
- Data Table on Pouches - Market size and forecast 2023-2028 ($ million)
- Chart on Pouches - Year-over-year growth 2023-2028 (%)
- Data Table on Pouches - Year-over-year growth 2023-2028 (%)
- 7.5 Trays - Market size and forecast 2023-2028
- Chart on Trays - Market size and forecast 2023-2028 ($ million)
- Data Table on Trays - Market size and forecast 2023-2028 ($ million)
- Chart on Trays - Year-over-year growth 2023-2028 (%)
- Data Table on Trays - Year-over-year growth 2023-2028 (%)
- 7.6 Carton packages - Market size and forecast 2023-2028
- Chart on Carton packages - Market size and forecast 2023-2028 ($ million)
- Data Table on Carton packages - Market size and forecast 2023-2028 ($ million)
- Chart on Carton packages - Year-over-year growth 2023-2028 (%)
- Data Table on Carton packages - Year-over-year growth 2023-2028 (%)
- 7.7 Others - Market size and forecast 2023-2028
- Chart on Others - Market size and forecast 2023-2028 ($ million)
- Data Table on Others - Market size and forecast 2023-2028 ($ million)
- Chart on Others - Year-over-year growth 2023-2028 (%)
- Data Table on Others - Year-over-year growth 2023-2028 (%)
- 7.8 Market opportunity by Type
- Market opportunity by Type ($ million)
- Data Table on Market opportunity by Type ($ million)
8 Customer Landscape
- 8.1 Customer landscape overview
- Analysis of price sensitivity, lifecycle, customer purchase basket, adoption rates, and purchase criteria
9 Geographic Landscape
- 9.1 Geographic segmentation
- Chart on Market share By Geographical Landscape 2023-2028 (%)
- Data Table on Market share By Geographical Landscape 2023-2028 (%)
- 9.2 Geographic comparison
- Chart on Geographic comparison
- Data Table on Geographic comparison
- 9.3 North America - Market size and forecast 2023-2028
- Chart on North America - Market size and forecast 2023-2028 ($ million)
- Data Table on North America - Market size and forecast 2023-2028 ($ million)
- Chart on North America - Year-over-year growth 2023-2028 (%)
- Data Table on North America - Year-over-year growth 2023-2028 (%)
- 9.4 Europe - Market size and forecast 2023-2028
- Chart on Europe - Market size and forecast 2023-2028 ($ million)
- Data Table on Europe - Market size and forecast 2023-2028 ($ million)
- Chart on Europe - Year-over-year growth 2023-2028 (%)
- Data Table on Europe - Year-over-year growth 2023-2028 (%)
- 9.5 APAC - Market size and forecast 2023-2028
- Chart on APAC - Market size and forecast 2023-2028 ($ million)
- Data Table on APAC - Market size and forecast 2023-2028 ($ million)
- Chart on APAC - Year-over-year growth 2023-2028 (%)
- Data Table on APAC - Year-over-year growth 2023-2028 (%)
- 9.6 South America - Market size and forecast 2023-2028
- Chart on South America - Market size and forecast 2023-2028 ($ million)
- Data Table on South America - Market size and forecast 2023-2028 ($ million)
- Chart on South America - Year-over-year growth 2023-2028 (%)
- Data Table on South America - Year-over-year growth 2023-2028 (%)
- 9.7 Middle East and Africa - Market size and forecast 2023-2028
- Chart on Middle East and Africa - Market size and forecast 2023-2028 ($ million)
- Data Table on Middle East and Africa - Market size and forecast 2023-2028 ($ million)
- Chart on Middle East and Africa - Year-over-year growth 2023-2028 (%)
- Data Table on Middle East and Africa - Year-over-year growth 2023-2028 (%)
- 9.8 US - Market size and forecast 2023-2028
- Chart on US - Market size and forecast 2023-2028 ($ million)
- Data Table on US - Market size and forecast 2023-2028 ($ million)
- Chart on US - Year-over-year growth 2023-2028 (%)
- Data Table on US - Year-over-year growth 2023-2028 (%)
- 9.9 Germany - Market size and forecast 2023-2028
- Chart on Germany - Market size and forecast 2023-2028 ($ million)
- Data Table on Germany - Market size and forecast 2023-2028 ($ million)
- Chart on Germany - Year-over-year growth 2023-2028 (%)
- Data Table on Germany - Year-over-year growth 2023-2028 (%)
- 9.10 China - Market size and forecast 2023-2028
- Chart on China - Market size and forecast 2023-2028 ($ million)
- Data Table on China - Market size and forecast 2023-2028 ($ million)
- Chart on China - Year-over-year growth 2023-2028 (%)
- Data Table on China - Year-over-year growth 2023-2028 (%)
- 9.11 UK - Market size and forecast 2023-2028
- Chart on UK - Market size and forecast 2023-2028 ($ million)
- Data Table on UK - Market size and forecast 2023-2028 ($ million)
- Chart on UK - Year-over-year growth 2023-2028 (%)
- Data Table on UK - Year-over-year growth 2023-2028 (%)
- 9.12 Japan - Market size and forecast 2023-2028
- Chart on Japan - Market size and forecast 2023-2028 ($ million)
- Data Table on Japan - Market size and forecast 2023-2028 ($ million)
- Chart on Japan - Year-over-year growth 2023-2028 (%)
- Data Table on Japan - Year-over-year growth 2023-2028 (%)
- 9.13 Market opportunity By Geographical Landscape
- Market opportunity By Geographical Landscape ($ million)
- Data Tables on Market opportunity By Geographical Landscape ($ million)
10 Drivers, Challenges, and Opportunity/Restraints
- 10.1 Market drivers
- 10.2 Market challenges
- 10.3 Impact of drivers and challenges
- Impact of drivers and challenges in 2023 and 2028
- 10.4 Market opportunities/restraints
11 Competitive Landscape
- 11.1 Overview
- 11.2 Competitive Landscape
- Overview on criticality of inputs and factors of differentiation
- 11.3 Landscape disruption
- Overview on factors of disruption
- 11.4 Industry risks
- Impact of key risks on business
12 Competitive Analysis
- 12.1 Companies profiled
- Companies covered
- 12.2 Market positioning of companies
- Matrix on companies position and classification
- 12.3 API Group Corp.
- API Group Corp. - Overview
- API Group Corp. - Business segments
- API Group Corp. - Key news
- API Group Corp. - Key offerings
- API Group Corp. - Segment focus
- 12.4 AptarGroup Inc.
- AptarGroup Inc. - Overview
- AptarGroup Inc. - Business segments
- AptarGroup Inc. - Key news
- AptarGroup Inc. - Key offerings
- AptarGroup Inc. - Segment focus
- 12.5 Avient Corp.
- Avient Corp. - Overview
- Avient Corp. - Business segments
- Avient Corp. - Key news
- Avient Corp. - Key offerings
- Avient Corp. - Segment focus
- 12.6 BASF SE
- BASF SE - Overview
- BASF SE - Business segments
- BASF SE - Key news
- BASF SE - Key offerings
- BASF SE - Segment focus
- 12.7 Berry Global Inc.
- Berry Global Inc. - Overview
- Berry Global Inc. - Business segments
- Berry Global Inc. - Key news
- Berry Global Inc. - Key offerings
- Berry Global Inc. - Segment focus
- 12.8 BioCote Ltd.
- BioCote Ltd. - Overview
- BioCote Ltd. - Product / Service
- BioCote Ltd. - Key offerings
- 12.9 Dow Inc.
- Dow Inc. - Overview
- Dow Inc. - Business segments
- Dow Inc. - Key news
- Dow Inc. - Key offerings
- Dow Inc. - Segment focus
- 12.10 Ecoduka
- Ecoduka - Overview
- Ecoduka - Product / Service
- Ecoduka - Key offerings
- 12.11 KP Holding GmbH and Co. KG
- KP Holding GmbH and Co. KG - Overview
- KP Holding GmbH and Co. KG - Product / Service
- KP Holding GmbH and Co. KG - Key offerings
- 12.12 Lageen Tubes
- Lageen Tubes - Overview
- Lageen Tubes - Product / Service
- Lageen Tubes - Key offerings
- 12.13 MicrobeGuard Corp.
- MicrobeGuard Corp. - Overview
- MicrobeGuard Corp. - Product / Service
- MicrobeGuard Corp. - Key offerings
- 12.14 Mondi Plc
- Mondi Plc - Overview
- Mondi Plc - Business segments
- Mondi Plc - Key news
- Mondi Plc - Key offerings
- Mondi Plc - Segment focus
- 12.15 Saudi Basic Industries Corp.
- Saudi Basic Industries Corp. - Overview
- Saudi Basic Industries Corp. - Business segments
- Saudi Basic Industries Corp. - Key offerings
- Saudi Basic Industries Corp. - Segment focus
- 12.16 Sciessent LLC
- Sciessent LLC - Overview
- Sciessent LLC - Product / Service
- Sciessent LLC - Key offerings
- 12.17 Tekni Plex Inc.
- Tekni Plex Inc. - Overview
- Tekni Plex Inc. - Product / Service
- Tekni Plex Inc. - Key offerings
13 Appendix
- 13.1 Scope of the report
- 13.2 Inclusions and exclusions checklist
- Inclusions checklist
- Exclusions checklist
- 13.3 Currency conversion rates for US$
- Currency conversion rates for US$
- 13.4 Research methodology
- Research methodology
- 13.5 Data procurement
- Information sources
- 13.6 Data validation
- Data validation
- 13.7 Validation techniques employed for market sizing
- Validation techniques employed for market sizing
- 13.8 Data synthesis
- Data synthesis
- 13.9 360 degree market analysis
- 360 degree market analysis
- 13.10 List of abbreviations
- List of abbreviations

