|
|
市場調査レポート
商品コード
1911083
世界の準自律型乗用車市場2026-2030年Global Near Autonomous Passenger Car Market 2026-2030 |
||||||
|
|||||||
カスタマイズ可能
|
|||||||

| 世界の準自律型乗用車市場2026-2030年 |
|
出版日: 2026年01月14日
発行: TechNavio
ページ情報: 英文 285 Pages
納期: 即納可能
|

概要
世界の準自律型乗用車市場は、2025年から2030年にかけて9,713億米ドル規模に成長し、予測期間中のCAGRは43.4%と予測されております。
本報告書では、世界の準自律型乗用車市場に関する包括的な分析、市場規模と予測、動向、成長要因、課題に加え、約25社のベンダー分析を提供しております。
本レポートは、現在の市場状況、最新の動向と促進要因、市場環境全般に関する最新の分析を提供します。市場は、半自動運転車の普及拡大、自動車メーカーによる自動運転機能への需要増加、自動運転技術導入を促進する高度道路交通システム(ITS)によって牽引されています。
本調査は、業界の主要関係者からの情報を含む一次情報と二次情報を客観的に組み合わせて実施されました。本レポートには、主要企業の分析に加え、包括的な市場規模データ、地域別分析を伴うセグメント、ベンダー情勢が含まれています。レポートには過去データと予測データが掲載されています。
| 市場範囲 | |
|---|---|
| 基準年 | 2026年 |
| 終了年 | 2030年 |
| 予測期間 | 2026-2030 |
| 成長モメンタム | 加速 |
| 前年比2026年 | 40% |
| CAGR | 43.4% |
| 増分額 | 9,713億米ドル |
本調査では、今後数年間における世界の準自動運転乗用車市場の成長を牽引する主な要因の一つとして、自動運転車の研究開発に対する資金増加を挙げております。また、クラウドベースの高精細(HD)マップの採用拡大、合併・買収の増加、自動運転車の開発進展が、市場における相当な需要につながると見込まれます。
目次
第1章 エグゼクティブサマリー
- 市場概要
第2章 Technavio分析
- 価格・ライフサイクル・顧客購入バスケット・採用率・購入基準の分析
- インプットの重要性と差別化の要因
- 混乱の要因
- 促進要因と課題の影響
第3章 市場情勢
- 市場エコシステム
- 市場の特徴
- バリューチェーン分析
第4章 市場規模
- 市場の定義
- 市場セグメント分析
- 市場規模 2025
- 市場の見通し 2025-2030
第5章 市場規模実績
- 世界の準自律型乗用車市場 2020-2024
- 技術セグメント分析 2020-2024
- 推進方式セグメント分析 2020-2024
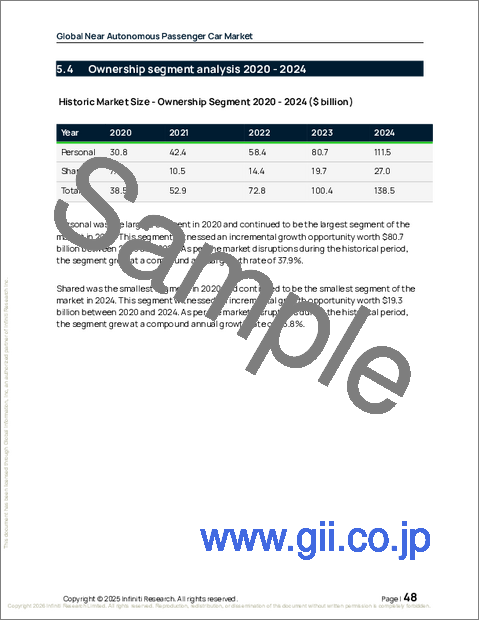
- 所有形態セグメント分析 2020-2024
- 地域別セグメント分析 2020-2024
- 国別セグメント分析 2020-2024
第6章 定性分析
- AIの影響:世界の準自律型乗用車市場
第7章 ファイブフォース分析
- ファイブフォースの要約
- 買い手の交渉力
- 供給企業の交渉力
- 新規参入業者の脅威
- 代替品の脅威
- 競争の脅威
- 市況
第8章 市場セグメンテーション:技術別
- 市場セグメント
- 比較:技術別
- ADASレベル1:市場規模と予測 2025-2030
- ADASレベル2:市場規模と予測 2025-2030
- 市場機会:技術別
第9章 市場セグメンテーション:推進力別
- 市場セグメント
- 比較:推進力別
- 内燃機関車:市場規模と予測 2025-2030
- バッテリー電気自動車:市場規模と予測 2025-2030
- ハイブリッド車:市場規模と予測 2025-2030
- 市場機会:推進力別
第10章 市場セグメンテーション:所有形態別
- 市場セグメント
- 比較:所有形態別
- 個人所有:市場規模と予測 2025-2030
- 共有型:市場規模と予測 2025-2030
- 市場機会:所有形態別
第11章 顧客情勢
- 顧客情勢の概要
第12章 地域別情勢
- 地域別セグメンテーション
- 地域別比較
- 北米:市場規模と予測 2025-2030
- 欧州:市場規模と予測 2025-2030
- アジア太平洋:市場規模と予測 2025-2030
- 南米:市場規模と予測 2025-2030
- 中東・アフリカ:市場規模と予測 2025-2030
- 市場機会:地域別
第13章 促進要因、課題、および機会
- 市場促進要因
- 市場の課題
- 促進要因と課題の影響
- 市場機会
第14章 競合情勢
- 概要
- 競合情勢
- 混乱の状況
- 業界のリスク
第15章 競合分析
- 企業プロファイル
- 企業ランキング指標
- 企業の市場ポジショニング
- Bayerische Motoren Werke AG
- Chery Automobile Co. Ltd.
- Chongqing Changan Auto. Ltd.
- Ford Motor Co.
- Geely Auto Group
- General Motors Co.
- Honda Motor Co. Ltd.
- Hyundai Motor Co.
- Mazda Motor Corp.
- Mercedes Benz Group AG
- Nissan Motor Co. Ltd.
- Tata Motors Ltd.
- Tesla Inc.
- Toyota Motor Corp.
- Volkswagen AG

