|
|
市場調査レポート
商品コード
1908905
世界の金属加工油市場2026-2030年Global Metalworking Fluids Market 2026-2030 |
||||||
|
|||||||
カスタマイズ可能
|
|||||||

| 世界の金属加工油市場2026-2030年 |
|
出版日: 2026年01月14日
発行: TechNavio
ページ情報: 英文 304 Pages
納期: 即納可能
|

概要
世界の金属加工油市場は、2025年から2030年にかけて22億3,430万米ドルの成長が見込まれ、予測期間中のCAGRは3.2%と予測されています。
本報告書では、世界の金属加工油市場に関する包括的な分析、市場規模と予測、動向、成長要因、課題に加え、約25社のベンダー分析を提供しております。
本レポートは、現在の市場状況、最新の動向と促進要因、市場環境全般に関する最新の分析を提供します。市場は、新興経済国における工業化の進展、金属加工油剤の配合技術革新、持続可能で環境に優しい金属加工油剤の採用への移行によって牽引されています。
本調査は、業界の主要関係者からの情報を含む、一次情報と二次情報の客観的な組み合わせを用いて実施されました。本レポートには、主要企業の分析に加え、包括的な市場規模データ、地域別分析を伴うセグメント、ベンダー情勢が含まれています。レポートには過去データと予測データが掲載されています。
| 市場範囲 | |
|---|---|
| 基準年 | 2026年 |
| 終了年 | 2030年 |
| 予測期間 | 2026-2030 |
| 成長モメンタム | 加速 |
| 前年比2026年 | 3.2% |
| CAGR | 3.2% |
| 増分額 | 22億3,430万米ドル |
本調査では、バイオベースの金属加工油剤の台頭が、今後数年間における世界の金属加工油剤市場の成長を牽引する主要な要因の一つであると特定しております。また、合併・買収活動の増加や、金属加工プロセスの監視・最適化のためのインダストリー4.0技術の採用拡大が、市場における相当な需要につながると見込まれます。
目次
第1章 エグゼクティブサマリー
- 市場概要
第2章 Technavio分析
- 価格・ライフサイクル・顧客購入バスケット・採用率・購入基準の分析
- インプットの重要性と差別化の要因
- 混乱の要因
- 促進要因と課題の影響
第3章 市場情勢
- 市場エコシステム
- 市場の特徴
- バリューチェーン分析
第4章 市場規模
- 市場の定義
- 市場セグメント分析
- 市場規模 2025
- 市場の見通し 2025-2030
第5章 市場規模実績
- 世界の金属加工油市場 2020-2024
- エンドユーザーセグメント分析 2020-2024
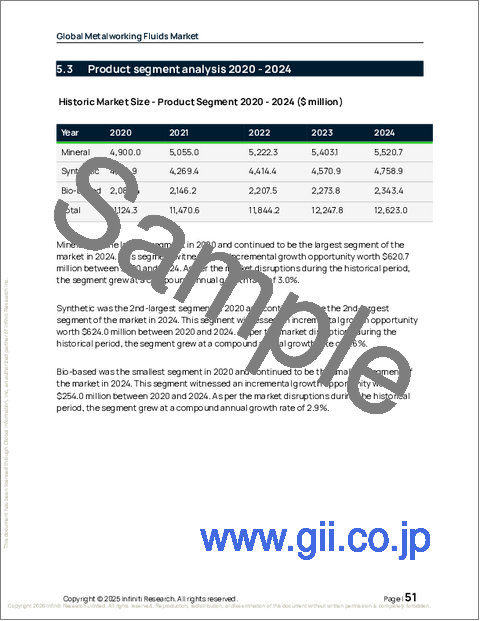
- 製品セグメント分析 2020-2024
- 用途別セグメント分析 2020-2024
- 地域別セグメント分析 2020-2024
- 国別セグメント分析 2020-2024
第6章 定性分析
- AIの影響:世界の金属加工油市場
第7章 ファイブフォース分析
- ファイブフォースの要約
- 買い手の交渉力
- 供給企業の交渉力
- 新規参入業者の脅威
- 代替品の脅威
- 競争の脅威
- 市況
第8章 市場セグメンテーション:エンドユーザー別
- 市場セグメント
- 比較:エンドユーザー別
- 建設:市場規模と予測 2025-2030
- 自動車:市場規模と予測 2025-2030
- 航空宇宙:市場規模と予測 2025-2030
- 電気・電力:市場規模と予測 2025-2030
- その他:市場規模と予測 2025-2030
- 市場機会:エンドユーザー別
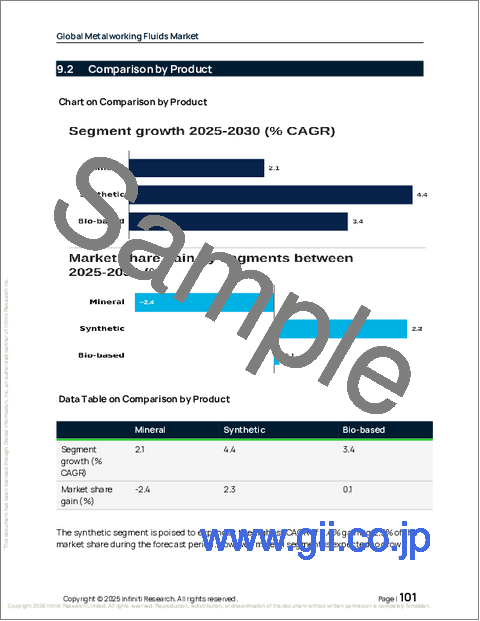
第9章 市場セグメンテーション:製品別
- 市場セグメント
- 比較:製品別
- 鉱物由来:市場規模と予測 2025-2030
- 合成:市場規模と予測 2025-2030
- バイオベース:市場規模と予測 2025-2030
- 市場機会:製品別
第10章 市場セグメンテーション:用途別
- 市場セグメント
- 比較:用途別
- 水溶性切削油:市場規模と予測 2025-2030
- 純粋な切削油:市場規模と予測 2025-2030
- 防錆剤:市場規模と予測 2025-2030
- 市場機会:用途別
第11章 顧客情勢
- 顧客情勢の概要
第12章 地域別情勢
- 地域別セグメンテーション
- 地域別比較
- アジア太平洋:市場規模と予測 2025-2030
- 北米:市場規模と予測 2025-2030
- 欧州:市場規模と予測 2025-2030
- 中東・アフリカ:市場規模と予測 2025-2030
- 南米:市場規模と予測 2025-2030
- 市場機会:地域別
第13章 促進要因、課題、および機会
- 市場促進要因
- 市場の課題
- 促進要因と課題の影響
- 市場機会
第14章 競合情勢
- 概要
- 競合情勢
- 混乱の状況
- 業界のリスク
第15章 競合分析
- 企業プロファイル
- 企業ランキング指標
- 企業の市場ポジショニング
- BP Plc
- Chevron Corp.
- China Petrochemical Corp.
- CONDAT
- ENEOS Corp.
- Exxon Mobil Corp.
- FUCHS SE
- Henkel AG and Co. KGaA
- Idemitsu Kosan Co. Ltd.
- Italmatch Chemicals Spa
- Master Fluid Solutions
- Motul group
- PETROFER
- PJSC LUKOIL
- Quaker Houghton

