|
|
市場調査レポート
商品コード
1762999
精密医療の世界市場 2025-2029Global Precision Medicine Market 2025-2029 |
||||||

|
|||||||
カスタマイズ可能
|
|||||||


| 精密医療の世界市場 2025-2029 |
|
出版日: 2025年06月24日
発行: TechNavio
ページ情報: 英文 222 Pages
納期: 即納可能
|

全表示
- 概要
- 図表
- 目次
精密医療市場は2024-2029年に784億米ドル、予測期間中のCAGRは13%で成長すると予測されます。
当レポートでは、精密医療市場の全体的な分析、市場規模・予測、動向、成長促進要因、課題、約25のベンダーを網羅したベンダー分析などを掲載しています。
現在の市場シナリオ、最新動向と促進要因、市場環境全体に関する最新分析を提供しています。市場は、慢性疾患の蔓延、個別化医療に対する需要の増加、ゲノミクスとプロテオミクスの進歩によって牽引されています。
| 市場範囲 | |
|---|---|
| 基準年 | 2025 |
| 終了年 | 2029 |
| 予測期間 | 2025-2029 |
| 成長モメンタム | 加速 |
| 前年比 | 11.3% |
| CAGR | 13% |
| 増分額 | 784億米ドル |
本調査は、業界の主要参加者からのインプットを含め、一次情報と二次情報を客観的に組み合わせて実施しました。レポートには、主要企業の分析に加え、包括的な市場規模データ、地域別分析によるセグメント、ベンダー情勢が含まれています。レポートには履歴データと予測データがあります。
本調査では、精密医療における人工知能(AI)と機械学習(ML)の利用拡大が、今後数年間の精密医療市場の成長を促進する主要な理由の1つであると特定しています。また、ゲノムとデジタルヘルスの統合、精密医療の最近の動向の高まりは、市場の大きな需要につながるでしょう。
目次
第1章 エグゼクティブサマリー
- 市場概要
第2章 Technavio分析
- 価格・ライフサイクル・顧客購入バスケット・採用率・購入基準の分析
- インプットの重要性と差別化の要因
- 混乱の要因
- 促進要因と課題の影響
第3章 市場情勢
- 市場エコシステム
- 市場の特徴
- バリューチェーン分析
第4章 市場規模
- 市場の定義
- 市場セグメント分析
- 市場規模 2024
- 市場の見通し 2024-2029
第5章 市場規模実績
- 精密医療の世界市場 2019-2023
- 用途別セグメント分析 2019-2023
- 技術セグメント分析 2019-2023
- エンドユーザーセグメント分析 2019-2023
- 地域別セグメント分析 2019-2023
- 国別セグメント分析 2019-2023
第6章 定性分析
- AIの影響:精密医療の世界市場
第7章 ファイブフォース分析
- ファイブフォースの要約
- 買い手の交渉力
- 供給企業の交渉力
- 新規参入業者の脅威
- 代替品の脅威
- 競争の脅威
- 市況
第8章 市場セグメンテーション:用途別
- 市場セグメント
- 比較:用途別
- 腫瘍学:市場規模と予測 2024-2029
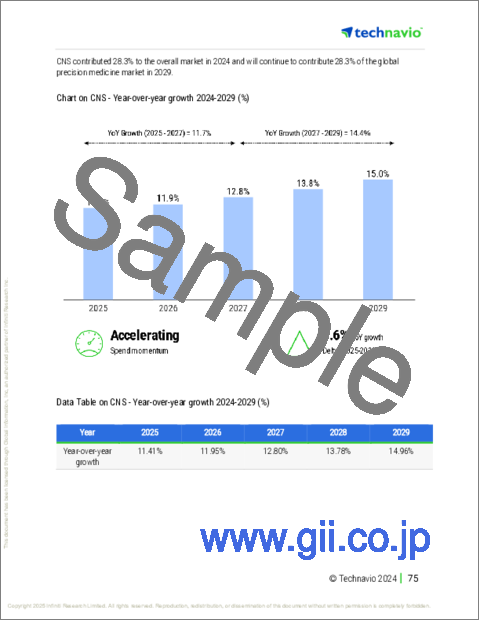
- 中枢神経系:市場規模と予測 2024-2029
- 呼吸器:市場規模と予測 2024-2029
- 免疫学:市場規模と予測 2024-2029
- その他:市場規模と予測 2024-2029
- 市場機会:用途別
第9章 市場セグメンテーション:技術別
- 市場セグメント
- 比較:技術別
- バイオインフォマティクス:市場規模と予測 2024-2029
- 遺伝子配列解析:市場規模と予測 2024-2029
- 創薬:市場規模と予測 2024-2029
- 精密分子診断:市場規模と予測 2024-2029
- ビッグデータ分析:市場規模と予測 2024-2029
- 市場機会:技術別
第10章 市場セグメンテーション:エンドユーザー別
- 市場セグメント
- 比較:エンドユーザー別
- 製薬およびバイオテクノロジー:市場規模と予測 2024-2029
- ヘルスケア提供者:市場規模と予測 2024-2029
- 調査・学術機関:市場規模と予測 2024-2029
- 診断検査室:市場規模と予測 2024-2029
- 市場機会:エンドユーザー別
第11章 顧客情勢
- 顧客情勢の概要
第12章 地域別情勢
- 地域別セグメンテーション
- 地域別比較
- 北米:市場規模と予測 2024-2029
- 欧州:市場規模と予測 2024-2029
- アジア:市場規模と予測 2024-2029
- 世界のその他の地域:市場規模と予測 2024-2029
- 米国:市場規模と予測 2024-2029
- ドイツ:市場規模と予測 2024-2029
- カナダ:市場規模と予測 2024-2029
- 中国:市場規模と予測 2024-2029
- 英国:市場規模と予測 2024-2029
- 日本:市場規模と予測 2024-2029
- フランス:市場規模と予測 2024-2029
- インド:市場規模と予測 2024-2029
- イタリア:市場規模と予測 2024-2029
- ブラジル:市場規模と予測 2024-2029
- 市場機会:地域情勢別
第13章 促進要因・課題・機会・抑制要因
- 市場促進要因
- 市場の課題
- 促進要因と課題の影響
- 市場の機会・抑制要因
第14章 競合情勢
- 概要
- 競合情勢
- 混乱の状況
- 業界のリスク
第15章 競合分析
- 企業プロファイル
- 企業ランキング指数
- 企業の市場ポジショニング
- Amgen Inc.
- AstraZeneca Plc
- Bristol Myers Squibb Co.
- Catalent Inc.
- Eli Lilly and Co.
- F. Hoffmann La Roche Ltd.
- Gilead Sciences Inc.
- Johnson and Johnson Services Inc.
- Lonza Group Ltd.
- Merck and Co. Inc.
- Novartis AG
- Pfizer Inc.
- Sanofi SA
- Takeda Pharmaceutical Co. Ltd.
- Thermo Fisher Scientific Inc.
第16章 付録
Exhibits:
- Exhibits1: Executive Summary - Chart on Market Overview
- Exhibits2: Executive Summary - Data Table on Market Overview
- Exhibits3: Executive Summary - Chart on Global Market Characteristics
- Exhibits4: Executive Summary - Chart on Market By Geographical Landscape
- Exhibits5: Executive Summary - Chart on Market Segmentation by Application
- Exhibits6: Executive Summary - Chart on Market Segmentation by Technology
- Exhibits7: Executive Summary - Chart on Market Segmentation by End-user
- Exhibits8: Executive Summary - Chart on Incremental Growth
- Exhibits9: Executive Summary - Data Table on Incremental Growth
- Exhibits10: Executive Summary - Chart on Company Market Positioning
- Exhibits11: Analysis of price sensitivity, lifecycle, customer purchase basket, adoption rates, and purchase criteria
- Exhibits12: Overview on criticality of inputs and factors of differentiation
- Exhibits13: Overview on factors of disruption
- Exhibits14: Impact of drivers and challenges in 2024 and 2029
- Exhibits15: Parent Market
- Exhibits16: Data Table on - Parent Market
- Exhibits17: Market characteristics analysis
- Exhibits18: Value chain analysis
- Exhibits19: Offerings of companies included in the market definition
- Exhibits20: Market segments
- Exhibits21: Chart on Global - Market size and forecast 2024-2029 ($ billion)
- Exhibits22: Data Table on Global - Market size and forecast 2024-2029 ($ billion)
- Exhibits23: Chart on Global Market: Year-over-year growth 2024-2029 (%)
- Exhibits24: Data Table on Global Market: Year-over-year growth 2024-2029 (%)
- Exhibits25: Historic Market Size - Data Table on Global Precision Medicine Market 2019 - 2023 ($ billion)
- Exhibits26: Historic Market Size - Application Segment 2019 - 2023 ($ billion)
- Exhibits27: Historic Market Size - Technology Segment 2019 - 2023 ($ billion)
- Exhibits28: Historic Market Size - End-user Segment 2019 - 2023 ($ billion)
- Exhibits29: Historic Market Size - Geography Segment 2019 - 2023 ($ billion)
- Exhibits30: Historic Market Size - Country Segment 2019 - 2023 ($ billion)
- Exhibits31: Five forces analysis - Comparison between 2024 and 2029
- Exhibits32: Bargaining power of buyers - Impact of key factors 2024 and 2029
- Exhibits33: Bargaining power of suppliers - Impact of key factors in 2024 and 2029
- Exhibits34: Threat of new entrants - Impact of key factors in 2024 and 2029
- Exhibits35: Threat of substitutes - Impact of key factors in 2024 and 2029
- Exhibits36: Threat of rivalry - Impact of key factors in 2024 and 2029
- Exhibits37: Chart on Market condition - Five forces 2024 and 2029
- Exhibits38: Chart on Application - Market share 2024-2029 (%)
- Exhibits39: Data Table on Application - Market share 2024-2029 (%)
- Exhibits40: Chart on Comparison by Application
- Exhibits41: Data Table on Comparison by Application
- Exhibits42: Chart on Oncology - Market size and forecast 2024-2029 ($ billion)
- Exhibits43: Data Table on Oncology - Market size and forecast 2024-2029 ($ billion)
- Exhibits44: Chart on Oncology - Year-over-year growth 2024-2029 (%)
- Exhibits45: Data Table on Oncology - Year-over-year growth 2024-2029 (%)
- Exhibits46: Chart on CNS - Market size and forecast 2024-2029 ($ billion)
- Exhibits47: Data Table on CNS - Market size and forecast 2024-2029 ($ billion)
- Exhibits48: Chart on CNS - Year-over-year growth 2024-2029 (%)
- Exhibits49: Data Table on CNS - Year-over-year growth 2024-2029 (%)
- Exhibits50: Chart on Respiratory - Market size and forecast 2024-2029 ($ billion)
- Exhibits51: Data Table on Respiratory - Market size and forecast 2024-2029 ($ billion)
- Exhibits52: Chart on Respiratory - Year-over-year growth 2024-2029 (%)
- Exhibits53: Data Table on Respiratory - Year-over-year growth 2024-2029 (%)
- Exhibits54: Chart on Immunology - Market size and forecast 2024-2029 ($ billion)
- Exhibits55: Data Table on Immunology - Market size and forecast 2024-2029 ($ billion)
- Exhibits56: Chart on Immunology - Year-over-year growth 2024-2029 (%)
- Exhibits57: Data Table on Immunology - Year-over-year growth 2024-2029 (%)
- Exhibits58: Chart on Others - Market size and forecast 2024-2029 ($ billion)
- Exhibits59: Data Table on Others - Market size and forecast 2024-2029 ($ billion)
- Exhibits60: Chart on Others - Year-over-year growth 2024-2029 (%)
- Exhibits61: Data Table on Others - Year-over-year growth 2024-2029 (%)
- Exhibits62: Market opportunity by Application ($ billion)
- Exhibits63: Data Table on Market opportunity by Application ($ billion)
- Exhibits64: Chart on Technology - Market share 2024-2029 (%)
- Exhibits65: Data Table on Technology - Market share 2024-2029 (%)
- Exhibits66: Chart on Comparison by Technology
- Exhibits67: Data Table on Comparison by Technology
- Exhibits68: Chart on Bioinformatics - Market size and forecast 2024-2029 ($ billion)
- Exhibits69: Data Table on Bioinformatics - Market size and forecast 2024-2029 ($ billion)
- Exhibits70: Chart on Bioinformatics - Year-over-year growth 2024-2029 (%)
- Exhibits71: Data Table on Bioinformatics - Year-over-year growth 2024-2029 (%)
- Exhibits72: Chart on Gene sequencing - Market size and forecast 2024-2029 ($ billion)
- Exhibits73: Data Table on Gene sequencing - Market size and forecast 2024-2029 ($ billion)
- Exhibits74: Chart on Gene sequencing - Year-over-year growth 2024-2029 (%)
- Exhibits75: Data Table on Gene sequencing - Year-over-year growth 2024-2029 (%)
- Exhibits76: Chart on Drug discovery - Market size and forecast 2024-2029 ($ billion)
- Exhibits77: Data Table on Drug discovery - Market size and forecast 2024-2029 ($ billion)
- Exhibits78: Chart on Drug discovery - Year-over-year growth 2024-2029 (%)
- Exhibits79: Data Table on Drug discovery - Year-over-year growth 2024-2029 (%)
- Exhibits80: Chart on Precision molecular diagnostic - Market size and forecast 2024-2029 ($ billion)
- Exhibits81: Data Table on Precision molecular diagnostic - Market size and forecast 2024-2029 ($ billion)
- Exhibits82: Chart on Precision molecular diagnostic - Year-over-year growth 2024-2029 (%)
- Exhibits83: Data Table on Precision molecular diagnostic - Year-over-year growth 2024-2029 (%)
- Exhibits84: Chart on Big data analytics - Market size and forecast 2024-2029 ($ billion)
- Exhibits85: Data Table on Big data analytics - Market size and forecast 2024-2029 ($ billion)
- Exhibits86: Chart on Big data analytics - Year-over-year growth 2024-2029 (%)
- Exhibits87: Data Table on Big data analytics - Year-over-year growth 2024-2029 (%)
- Exhibits88: Market opportunity by Technology ($ billion)
- Exhibits89: Data Table on Market opportunity by Technology ($ billion)
- Exhibits90: Chart on End-user - Market share 2024-2029 (%)
- Exhibits91: Data Table on End-user - Market share 2024-2029 (%)
- Exhibits92: Chart on Comparison by End-user
- Exhibits93: Data Table on Comparison by End-user
- Exhibits94: Chart on Pharmaceutical and biotechnology - Market size and forecast 2024-2029 ($ billion)
- Exhibits95: Data Table on Pharmaceutical and biotechnology - Market size and forecast 2024-2029 ($ billion)
- Exhibits96: Chart on Pharmaceutical and biotechnology - Year-over-year growth 2024-2029 (%)
- Exhibits97: Data Table on Pharmaceutical and biotechnology - Year-over-year growth 2024-2029 (%)
- Exhibits98: Chart on Healthcare providers - Market size and forecast 2024-2029 ($ billion)
- Exhibits99: Data Table on Healthcare providers - Market size and forecast 2024-2029 ($ billion)
- Exhibits100: Chart on Healthcare providers - Year-over-year growth 2024-2029 (%)
- Exhibits101: Data Table on Healthcare providers - Year-over-year growth 2024-2029 (%)
- Exhibits102: Chart on Research and academic institutions - Market size and forecast 2024-2029 ($ billion)
- Exhibits103: Data Table on Research and academic institutions - Market size and forecast 2024-2029 ($ billion)
- Exhibits104: Chart on Research and academic institutions - Year-over-year growth 2024-2029 (%)
- Exhibits105: Data Table on Research and academic institutions - Year-over-year growth 2024-2029 (%)
- Exhibits106: Chart on Diagnostic laboratories - Market size and forecast 2024-2029 ($ billion)
- Exhibits107: Data Table on Diagnostic laboratories - Market size and forecast 2024-2029 ($ billion)
- Exhibits108: Chart on Diagnostic laboratories - Year-over-year growth 2024-2029 (%)
- Exhibits109: Data Table on Diagnostic laboratories - Year-over-year growth 2024-2029 (%)
- Exhibits110: Market opportunity by End-user ($ billion)
- Exhibits111: Data Table on Market opportunity by End-user ($ billion)
- Exhibits112: Analysis of price sensitivity, lifecycle, customer purchase basket, adoption rates, and purchase criteria
- Exhibits113: Chart on Market share By Geographical Landscape 2024-2029 (%)
- Exhibits114: Data Table on Market share By Geographical Landscape 2024-2029 (%)
- Exhibits115: Chart on Geographic comparison
- Exhibits116: Data Table on Geographic comparison
- Exhibits117: Chart on North America - Market size and forecast 2024-2029 ($ billion)
- Exhibits118: Data Table on North America - Market size and forecast 2024-2029 ($ billion)
- Exhibits119: Chart on North America - Year-over-year growth 2024-2029 (%)
- Exhibits120: Data Table on North America - Year-over-year growth 2024-2029 (%)
- Exhibits121: Chart on Europe - Market size and forecast 2024-2029 ($ billion)
- Exhibits122: Data Table on Europe - Market size and forecast 2024-2029 ($ billion)
- Exhibits123: Chart on Europe - Year-over-year growth 2024-2029 (%)
- Exhibits124: Data Table on Europe - Year-over-year growth 2024-2029 (%)
- Exhibits125: Chart on Asia - Market size and forecast 2024-2029 ($ billion)
- Exhibits126: Data Table on Asia - Market size and forecast 2024-2029 ($ billion)
- Exhibits127: Chart on Asia - Year-over-year growth 2024-2029 (%)
- Exhibits128: Data Table on Asia - Year-over-year growth 2024-2029 (%)
- Exhibits129: Chart on Rest of World (ROW) - Market size and forecast 2024-2029 ($ billion)
- Exhibits130: Data Table on Rest of World (ROW) - Market size and forecast 2024-2029 ($ billion)
- Exhibits131: Chart on Rest of World (ROW) - Year-over-year growth 2024-2029 (%)
- Exhibits132: Data Table on Rest of World (ROW) - Year-over-year growth 2024-2029 (%)
- Exhibits133: Chart on US - Market size and forecast 2024-2029 ($ billion)
- Exhibits134: Data Table on US - Market size and forecast 2024-2029 ($ billion)
- Exhibits135: Chart on US - Year-over-year growth 2024-2029 (%)
- Exhibits136: Data Table on US - Year-over-year growth 2024-2029 (%)
- Exhibits137: Chart on Germany - Market size and forecast 2024-2029 ($ billion)
- Exhibits138: Data Table on Germany - Market size and forecast 2024-2029 ($ billion)
- Exhibits139: Chart on Germany - Year-over-year growth 2024-2029 (%)
- Exhibits140: Data Table on Germany - Year-over-year growth 2024-2029 (%)
- Exhibits141: Chart on Canada - Market size and forecast 2024-2029 ($ billion)
- Exhibits142: Data Table on Canada - Market size and forecast 2024-2029 ($ billion)
- Exhibits143: Chart on Canada - Year-over-year growth 2024-2029 (%)
- Exhibits144: Data Table on Canada - Year-over-year growth 2024-2029 (%)
- Exhibits145: Chart on China - Market size and forecast 2024-2029 ($ billion)
- Exhibits146: Data Table on China - Market size and forecast 2024-2029 ($ billion)
- Exhibits147: Chart on China - Year-over-year growth 2024-2029 (%)
- Exhibits148: Data Table on China - Year-over-year growth 2024-2029 (%)
- Exhibits149: Chart on UK - Market size and forecast 2024-2029 ($ billion)
- Exhibits150: Data Table on UK - Market size and forecast 2024-2029 ($ billion)
- Exhibits151: Chart on UK - Year-over-year growth 2024-2029 (%)
- Exhibits152: Data Table on UK - Year-over-year growth 2024-2029 (%)
- Exhibits153: Chart on Japan - Market size and forecast 2024-2029 ($ billion)
- Exhibits154: Data Table on Japan - Market size and forecast 2024-2029 ($ billion)
- Exhibits155: Chart on Japan - Year-over-year growth 2024-2029 (%)
- Exhibits156: Data Table on Japan - Year-over-year growth 2024-2029 (%)
- Exhibits157: Chart on France - Market size and forecast 2024-2029 ($ billion)
- Exhibits158: Data Table on France - Market size and forecast 2024-2029 ($ billion)
- Exhibits159: Chart on France - Year-over-year growth 2024-2029 (%)
- Exhibits160: Data Table on France - Year-over-year growth 2024-2029 (%)
- Exhibits161: Chart on India - Market size and forecast 2024-2029 ($ billion)
- Exhibits162: Data Table on India - Market size and forecast 2024-2029 ($ billion)
- Exhibits163: Chart on India - Year-over-year growth 2024-2029 (%)
- Exhibits164: Data Table on India - Year-over-year growth 2024-2029 (%)
- Exhibits165: Chart on Italy - Market size and forecast 2024-2029 ($ billion)
- Exhibits166: Data Table on Italy - Market size and forecast 2024-2029 ($ billion)
- Exhibits167: Chart on Italy - Year-over-year growth 2024-2029 (%)
- Exhibits168: Data Table on Italy - Year-over-year growth 2024-2029 (%)
- Exhibits169: Chart on Brazil - Market size and forecast 2024-2029 ($ billion)
- Exhibits170: Data Table on Brazil - Market size and forecast 2024-2029 ($ billion)
- Exhibits171: Chart on Brazil - Year-over-year growth 2024-2029 (%)
- Exhibits172: Data Table on Brazil - Year-over-year growth 2024-2029 (%)
- Exhibits173: Market opportunity By Geographical Landscape ($ billion)
- Exhibits174: Data Tables on Market opportunity By Geographical Landscape ($ billion)
- Exhibits175: Impact of drivers and challenges in 2024 and 2029
- Exhibits176: Overview on criticality of inputs and factors of differentiation
- Exhibits177: Overview on factors of disruption
- Exhibits178: Impact of key risks on business
- Exhibits179: Companies covered
- Exhibits180: Company ranking index
- Exhibits181: Matrix on companies position and classification
- Exhibits182: Amgen Inc. - Overview
- Exhibits183: Amgen Inc. - Product / Service
- Exhibits184: Amgen Inc. - Key news
- Exhibits185: Amgen Inc. - Key offerings
- Exhibits186: SWOT
- Exhibits187: AstraZeneca Plc - Overview
- Exhibits188: AstraZeneca Plc - Product / Service
- Exhibits189: AstraZeneca Plc - Key news
- Exhibits190: AstraZeneca Plc - Key offerings
- Exhibits191: SWOT
- Exhibits192: Bristol Myers Squibb Co. - Overview
- Exhibits193: Bristol Myers Squibb Co. - Product / Service
- Exhibits194: Bristol Myers Squibb Co. - Key news
- Exhibits195: Bristol Myers Squibb Co. - Key offerings
- Exhibits196: SWOT
- Exhibits197: Catalent Inc. - Overview
- Exhibits198: Catalent Inc. - Business segments
- Exhibits199: Catalent Inc. - Key offerings
- Exhibits200: Catalent Inc. - Segment focus
- Exhibits201: SWOT
- Exhibits202: Eli Lilly and Co. - Overview
- Exhibits203: Eli Lilly and Co. - Product / Service
- Exhibits204: Eli Lilly and Co. - Key offerings
- Exhibits205: SWOT
- Exhibits206: F. Hoffmann La Roche Ltd. - Overview
- Exhibits207: F. Hoffmann La Roche Ltd. - Business segments
- Exhibits208: F. Hoffmann La Roche Ltd. - Key news
- Exhibits209: F. Hoffmann La Roche Ltd. - Key offerings
- Exhibits210: F. Hoffmann La Roche Ltd. - Segment focus
- Exhibits211: SWOT
- Exhibits212: Gilead Sciences Inc. - Overview
- Exhibits213: Gilead Sciences Inc. - Product / Service
- Exhibits214: Gilead Sciences Inc. - Key news
- Exhibits215: Gilead Sciences Inc. - Key offerings
- Exhibits216: SWOT
- Exhibits217: Johnson and Johnson Services Inc. - Overview
- Exhibits218: Johnson and Johnson Services Inc. - Business segments
- Exhibits219: Johnson and Johnson Services Inc. - Key news
- Exhibits220: Johnson and Johnson Services Inc. - Key offerings
- Exhibits221: Johnson and Johnson Services Inc. - Segment focus
- Exhibits222: SWOT
- Exhibits223: Lonza Group Ltd. - Overview
- Exhibits224: Lonza Group Ltd. - Business segments
- Exhibits225: Lonza Group Ltd. - Key news
- Exhibits226: Lonza Group Ltd. - Key offerings
- Exhibits227: Lonza Group Ltd. - Segment focus
- Exhibits228: SWOT
- Exhibits229: Merck and Co. Inc. - Overview
- Exhibits230: Merck and Co. Inc. - Business segments
- Exhibits231: Merck and Co. Inc. - Key news
- Exhibits232: Merck and Co. Inc. - Key offerings
- Exhibits233: Merck and Co. Inc. - Segment focus
- Exhibits234: SWOT
- Exhibits235: Novartis AG - Overview
- Exhibits236: Novartis AG - Business segments
- Exhibits237: Novartis AG - Key news
- Exhibits238: Novartis AG - Key offerings
- Exhibits239: Novartis AG - Segment focus
- Exhibits240: SWOT
- Exhibits241: Pfizer Inc. - Overview
- Exhibits242: Pfizer Inc. - Product / Service
- Exhibits243: Pfizer Inc. - Key news
- Exhibits244: Pfizer Inc. - Key offerings
- Exhibits245: SWOT
- Exhibits246: Sanofi SA - Overview
- Exhibits247: Sanofi SA - Business segments
- Exhibits248: Sanofi SA - Key news
- Exhibits249: Sanofi SA - Key offerings
- Exhibits250: Sanofi SA - Segment focus
- Exhibits251: SWOT
- Exhibits252: Takeda Pharmaceutical Co. Ltd. - Overview
- Exhibits253: Takeda Pharmaceutical Co. Ltd. - Product / Service
- Exhibits254: Takeda Pharmaceutical Co. Ltd. - Key news
- Exhibits255: Takeda Pharmaceutical Co. Ltd. - Key offerings
- Exhibits256: SWOT
- Exhibits257: Thermo Fisher Scientific Inc. - Overview
- Exhibits258: Thermo Fisher Scientific Inc. - Business segments
- Exhibits259: Thermo Fisher Scientific Inc. - Key news
- Exhibits260: Thermo Fisher Scientific Inc. - Key offerings
- Exhibits261: Thermo Fisher Scientific Inc. - Segment focus
- Exhibits262: SWOT
- Exhibits263: Inclusions checklist
- Exhibits264: Exclusions checklist
- Exhibits265: Currency conversion rates for US$
- Exhibits266: Research methodology
- Exhibits267: Information sources
- Exhibits268: Data validation
- Exhibits269: Validation techniques employed for market sizing
- Exhibits270: Data synthesis
- Exhibits271: 360 degree market analysis
- Exhibits272: List of abbreviations
The precision medicine market is forecasted to grow by USD 78.4 bn during 2024-2029, accelerating at a CAGR of 13% during the forecast period. The report on the precision medicine market provides a holistic analysis, market size and forecast, trends, growth drivers, and challenges, as well as vendor analysis covering around 25 vendors.
The report offers an up-to-date analysis regarding the current market scenario, the latest trends and drivers, and the overall market environment. The market is driven by growing prevalence of chronic diseases, increasing demand for personalized medicine, and advancements in genomics and proteomics.
| Market Scope | |
|---|---|
| Base Year | 2025 |
| End Year | 2029 |
| Series Year | 2025-2029 |
| Growth Momentum | Accelerate |
| YOY 2025 | 11.3% |
| CAGR | 13% |
| Incremental Value | $78.4 bn |
The study was conducted using an objective combination of primary and secondary information including inputs from key participants in the industry. The report contains a comprehensive market size data, segment with regional analysis and vendor landscape in addition to an analysis of the key companies. Reports have historic and forecast data.
Technavio's precision medicine market is segmented as below:
By Application
- Oncology
- CNS
- Respiratory
- Immunology
- Others
By Technology
- Bioinformatics
- Gene sequencing
- Drug discovery
- Precision molecular diagnostic
- Big data analytics
By End-user
- Pharmaceutical and biotechnology
- Healthcare providers
- Research and academic institutions
- Diagnostic laboratories
By Geographical Landscape
- North America
- Europe
- Asia
- Rest of World (ROW)
This study identifies the growing use of artificial intelligence (AI) and machine learning (ML) in precision medicine as one of the prime reasons driving the precision medicine market growth during the next few years. Also, integration of genomics and digital health and rising recent developments in precision medicine will lead to sizable demand in the market.
The report on the precision medicine market covers the following areas:
- Precision Medicine Market sizing
- Precision Medicine Market forecast
- Precision Medicine Market industry analysis
The robust vendor analysis is designed to help clients improve their market position, and in line with this, this report provides a detailed analysis of several leading precision medicine market vendors that include AbbVie Inc., Amgen Inc., AstraZeneca Plc, Biocrates Life Sciences AG, Bristol Myers Squibb Co., Catalent Inc., Eli Lilly and Co., F. Hoffmann La Roche Ltd., Gilead Sciences Inc., IQVIA Holdings Inc., Johnson and Johnson Services Inc., Lonza Group Ltd., Merck and Co. Inc., Novartis AG, Parexel International Corp., Pfizer Inc., QIAGEN N.V., Sanofi SA, Takeda Pharmaceutical Co. Ltd., and Thermo Fisher Scientific Inc.. Also, the precision medicine market analysis report includes information on upcoming trends and challenges that will influence market growth. This is to help companies strategize and leverage all forthcoming growth opportunities.
The publisher presents a detailed picture of the market by the way of study, synthesis, and summation of data from multiple sources by an analysis of key parameters such as profit, pricing, competition, and promotions. It presents various market facets by identifying the key industry influencers. The data presented is comprehensive, reliable, and a result of extensive primary and secondary research. The market research reports provide a complete competitive landscape and an in-depth vendor selection methodology and analysis using qualitative and quantitative research to forecast accurate market growth.
Table of Contents
1 Executive Summary
- 1.1 Market overview
- Executive Summary - Chart on Market Overview
- Executive Summary - Data Table on Market Overview
- Executive Summary - Chart on Global Market Characteristics
- Executive Summary - Chart on Market By Geographical Landscape
- Executive Summary - Chart on Market Segmentation by Application
- Executive Summary - Chart on Market Segmentation by Technology
- Executive Summary - Chart on Market Segmentation by End-user
- Executive Summary - Chart on Incremental Growth
- Executive Summary - Data Table on Incremental Growth
- Executive Summary - Chart on Company Market Positioning
2 Technavio Analysis
- 2.1 Analysis of price sensitivity, lifecycle, customer purchase basket, adoption rates, and purchase criteria
- Analysis of price sensitivity, lifecycle, customer purchase basket, adoption rates, and purchase criteria
- 2.2 Criticality of inputs and Factors of differentiation
- Overview on criticality of inputs and factors of differentiation
- 2.3 Factors of disruption
- Overview on factors of disruption
- 2.4 Impact of drivers and challenges
- Impact of drivers and challenges in 2024 and 2029
3 Market Landscape
- 3.1 Market ecosystem
- Parent Market
- Data Table on - Parent Market
- 3.2 Market characteristics
- Market characteristics analysis
- 3.3 Value chain analysis
- Value chain analysis
4 Market Sizing
- 4.1 Market definition
- Offerings of companies included in the market definition
- 4.2 Market segment analysis
- Market segments
- 4.3 Market size 2024
- 4.4 Market outlook: Forecast for 2024-2029
- Chart on Global - Market size and forecast 2024-2029 ($ billion)
- Data Table on Global - Market size and forecast 2024-2029 ($ billion)
- Chart on Global Market: Year-over-year growth 2024-2029 (%)
- Data Table on Global Market: Year-over-year growth 2024-2029 (%)
5 Historic Market Size
- 5.1 Global Precision Medicine Market 2019 - 2023
- Historic Market Size - Data Table on Global Precision Medicine Market 2019 - 2023 ($ billion)
- 5.2 Application segment analysis 2019 - 2023
- Historic Market Size - Application Segment 2019 - 2023 ($ billion)
- 5.3 Technology segment analysis 2019 - 2023
- Historic Market Size - Technology Segment 2019 - 2023 ($ billion)
- 5.4 End-user segment analysis 2019 - 2023
- Historic Market Size - End-user Segment 2019 - 2023 ($ billion)
- 5.5 Geography segment analysis 2019 - 2023
- Historic Market Size - Geography Segment 2019 - 2023 ($ billion)
- 5.6 Country segment analysis 2019 - 2023
- Historic Market Size - Country Segment 2019 - 2023 ($ billion)
6 Qualitative Analysis
- 6.1 The impact of AI in the global precision medicine market
7 Five Forces Analysis
- 7.1 Five forces summary
- Five forces analysis - Comparison between 2024 and 2029
- 7.2 Bargaining power of buyers
- Bargaining power of buyers - Impact of key factors 2024 and 2029
- 7.3 Bargaining power of suppliers
- Bargaining power of suppliers - Impact of key factors in 2024 and 2029
- 7.4 Threat of new entrants
- Threat of new entrants - Impact of key factors in 2024 and 2029
- 7.5 Threat of substitutes
- Threat of substitutes - Impact of key factors in 2024 and 2029
- 7.6 Threat of rivalry
- Threat of rivalry - Impact of key factors in 2024 and 2029
- 7.7 Market condition
- Chart on Market condition - Five forces 2024 and 2029
8 Market Segmentation by Application
- 8.1 Market segments
- Chart on Application - Market share 2024-2029 (%)
- Data Table on Application - Market share 2024-2029 (%)
- 8.2 Comparison by Application
- Chart on Comparison by Application
- Data Table on Comparison by Application
- 8.3 Oncology - Market size and forecast 2024-2029
- Chart on Oncology - Market size and forecast 2024-2029 ($ billion)
- Data Table on Oncology - Market size and forecast 2024-2029 ($ billion)
- Chart on Oncology - Year-over-year growth 2024-2029 (%)
- Data Table on Oncology - Year-over-year growth 2024-2029 (%)
- 8.4 CNS - Market size and forecast 2024-2029
- Chart on CNS - Market size and forecast 2024-2029 ($ billion)
- Data Table on CNS - Market size and forecast 2024-2029 ($ billion)
- Chart on CNS - Year-over-year growth 2024-2029 (%)
- Data Table on CNS - Year-over-year growth 2024-2029 (%)
- 8.5 Respiratory - Market size and forecast 2024-2029
- Chart on Respiratory - Market size and forecast 2024-2029 ($ billion)
- Data Table on Respiratory - Market size and forecast 2024-2029 ($ billion)
- Chart on Respiratory - Year-over-year growth 2024-2029 (%)
- Data Table on Respiratory - Year-over-year growth 2024-2029 (%)
- 8.6 Immunology - Market size and forecast 2024-2029
- Chart on Immunology - Market size and forecast 2024-2029 ($ billion)
- Data Table on Immunology - Market size and forecast 2024-2029 ($ billion)
- Chart on Immunology - Year-over-year growth 2024-2029 (%)
- Data Table on Immunology - Year-over-year growth 2024-2029 (%)
- 8.7 Others - Market size and forecast 2024-2029
- Chart on Others - Market size and forecast 2024-2029 ($ billion)
- Data Table on Others - Market size and forecast 2024-2029 ($ billion)
- Chart on Others - Year-over-year growth 2024-2029 (%)
- Data Table on Others - Year-over-year growth 2024-2029 (%)
- 8.8 Market opportunity by Application
- Market opportunity by Application ($ billion)
- Data Table on Market opportunity by Application ($ billion)
9 Market Segmentation by Technology
- 9.1 Market segments
- Chart on Technology - Market share 2024-2029 (%)
- Data Table on Technology - Market share 2024-2029 (%)
- 9.2 Comparison by Technology
- Chart on Comparison by Technology
- Data Table on Comparison by Technology
- 9.3 Bioinformatics - Market size and forecast 2024-2029
- Chart on Bioinformatics - Market size and forecast 2024-2029 ($ billion)
- Data Table on Bioinformatics - Market size and forecast 2024-2029 ($ billion)
- Chart on Bioinformatics - Year-over-year growth 2024-2029 (%)
- Data Table on Bioinformatics - Year-over-year growth 2024-2029 (%)
- 9.4 Gene sequencing - Market size and forecast 2024-2029
- Chart on Gene sequencing - Market size and forecast 2024-2029 ($ billion)
- Data Table on Gene sequencing - Market size and forecast 2024-2029 ($ billion)
- Chart on Gene sequencing - Year-over-year growth 2024-2029 (%)
- Data Table on Gene sequencing - Year-over-year growth 2024-2029 (%)
- 9.5 Drug discovery - Market size and forecast 2024-2029
- Chart on Drug discovery - Market size and forecast 2024-2029 ($ billion)
- Data Table on Drug discovery - Market size and forecast 2024-2029 ($ billion)
- Chart on Drug discovery - Year-over-year growth 2024-2029 (%)
- Data Table on Drug discovery - Year-over-year growth 2024-2029 (%)
- 9.6 Precision molecular diagnostic - Market size and forecast 2024-2029
- Chart on Precision molecular diagnostic - Market size and forecast 2024-2029 ($ billion)
- Data Table on Precision molecular diagnostic - Market size and forecast 2024-2029 ($ billion)
- Chart on Precision molecular diagnostic - Year-over-year growth 2024-2029 (%)
- Data Table on Precision molecular diagnostic - Year-over-year growth 2024-2029 (%)
- 9.7 Big data analytics - Market size and forecast 2024-2029
- Chart on Big data analytics - Market size and forecast 2024-2029 ($ billion)
- Data Table on Big data analytics - Market size and forecast 2024-2029 ($ billion)
- Chart on Big data analytics - Year-over-year growth 2024-2029 (%)
- Data Table on Big data analytics - Year-over-year growth 2024-2029 (%)
- 9.8 Market opportunity by Technology
- Market opportunity by Technology ($ billion)
- Data Table on Market opportunity by Technology ($ billion)
10 Market Segmentation by End-user
- 10.1 Market segments
- Chart on End-user - Market share 2024-2029 (%)
- Data Table on End-user - Market share 2024-2029 (%)
- 10.2 Comparison by End-user
- Chart on Comparison by End-user
- Data Table on Comparison by End-user
- 10.3 Pharmaceutical and biotechnology - Market size and forecast 2024-2029
- Chart on Pharmaceutical and biotechnology - Market size and forecast 2024-2029 ($ billion)
- Data Table on Pharmaceutical and biotechnology - Market size and forecast 2024-2029 ($ billion)
- Chart on Pharmaceutical and biotechnology - Year-over-year growth 2024-2029 (%)
- Data Table on Pharmaceutical and biotechnology - Year-over-year growth 2024-2029 (%)
- 10.4 Healthcare providers - Market size and forecast 2024-2029
- Chart on Healthcare providers - Market size and forecast 2024-2029 ($ billion)
- Data Table on Healthcare providers - Market size and forecast 2024-2029 ($ billion)
- Chart on Healthcare providers - Year-over-year growth 2024-2029 (%)
- Data Table on Healthcare providers - Year-over-year growth 2024-2029 (%)
- 10.5 Research and academic institutions - Market size and forecast 2024-2029
- Chart on Research and academic institutions - Market size and forecast 2024-2029 ($ billion)
- Data Table on Research and academic institutions - Market size and forecast 2024-2029 ($ billion)
- Chart on Research and academic institutions - Year-over-year growth 2024-2029 (%)
- Data Table on Research and academic institutions - Year-over-year growth 2024-2029 (%)
- 10.6 Diagnostic laboratories - Market size and forecast 2024-2029
- Chart on Diagnostic laboratories - Market size and forecast 2024-2029 ($ billion)
- Data Table on Diagnostic laboratories - Market size and forecast 2024-2029 ($ billion)
- Chart on Diagnostic laboratories - Year-over-year growth 2024-2029 (%)
- Data Table on Diagnostic laboratories - Year-over-year growth 2024-2029 (%)
- 10.7 Market opportunity by End-user
- Market opportunity by End-user ($ billion)
- Data Table on Market opportunity by End-user ($ billion)
11 Customer Landscape
- 11.1 Customer landscape overview
- Analysis of price sensitivity, lifecycle, customer purchase basket, adoption rates, and purchase criteria
12 Geographic Landscape
- 12.1 Geographic segmentation
- Chart on Market share By Geographical Landscape 2024-2029 (%)
- Data Table on Market share By Geographical Landscape 2024-2029 (%)
- 12.2 Geographic comparison
- Chart on Geographic comparison
- Data Table on Geographic comparison
- 12.3 North America - Market size and forecast 2024-2029
- Chart on North America - Market size and forecast 2024-2029 ($ billion)
- Data Table on North America - Market size and forecast 2024-2029 ($ billion)
- Chart on North America - Year-over-year growth 2024-2029 (%)
- Data Table on North America - Year-over-year growth 2024-2029 (%)
- 12.4 Europe - Market size and forecast 2024-2029
- Chart on Europe - Market size and forecast 2024-2029 ($ billion)
- Data Table on Europe - Market size and forecast 2024-2029 ($ billion)
- Chart on Europe - Year-over-year growth 2024-2029 (%)
- Data Table on Europe - Year-over-year growth 2024-2029 (%)
- 12.5 Asia - Market size and forecast 2024-2029
- Chart on Asia - Market size and forecast 2024-2029 ($ billion)
- Data Table on Asia - Market size and forecast 2024-2029 ($ billion)
- Chart on Asia - Year-over-year growth 2024-2029 (%)
- Data Table on Asia - Year-over-year growth 2024-2029 (%)
- 12.6 Rest of World (ROW) - Market size and forecast 2024-2029
- Chart on Rest of World (ROW) - Market size and forecast 2024-2029 ($ billion)
- Data Table on Rest of World (ROW) - Market size and forecast 2024-2029 ($ billion)
- Chart on Rest of World (ROW) - Year-over-year growth 2024-2029 (%)
- Data Table on Rest of World (ROW) - Year-over-year growth 2024-2029 (%)
- 12.7 US - Market size and forecast 2024-2029
- Chart on US - Market size and forecast 2024-2029 ($ billion)
- Data Table on US - Market size and forecast 2024-2029 ($ billion)
- Chart on US - Year-over-year growth 2024-2029 (%)
- Data Table on US - Year-over-year growth 2024-2029 (%)
- 12.8 Germany - Market size and forecast 2024-2029
- Chart on Germany - Market size and forecast 2024-2029 ($ billion)
- Data Table on Germany - Market size and forecast 2024-2029 ($ billion)
- Chart on Germany - Year-over-year growth 2024-2029 (%)
- Data Table on Germany - Year-over-year growth 2024-2029 (%)
- 12.9 Canada - Market size and forecast 2024-2029
- Chart on Canada - Market size and forecast 2024-2029 ($ billion)
- Data Table on Canada - Market size and forecast 2024-2029 ($ billion)
- Chart on Canada - Year-over-year growth 2024-2029 (%)
- Data Table on Canada - Year-over-year growth 2024-2029 (%)
- 12.10 China - Market size and forecast 2024-2029
- Chart on China - Market size and forecast 2024-2029 ($ billion)
- Data Table on China - Market size and forecast 2024-2029 ($ billion)
- Chart on China - Year-over-year growth 2024-2029 (%)
- Data Table on China - Year-over-year growth 2024-2029 (%)
- 12.11 UK - Market size and forecast 2024-2029
- Chart on UK - Market size and forecast 2024-2029 ($ billion)
- Data Table on UK - Market size and forecast 2024-2029 ($ billion)
- Chart on UK - Year-over-year growth 2024-2029 (%)
- Data Table on UK - Year-over-year growth 2024-2029 (%)
- 12.12 Japan - Market size and forecast 2024-2029
- Chart on Japan - Market size and forecast 2024-2029 ($ billion)
- Data Table on Japan - Market size and forecast 2024-2029 ($ billion)
- Chart on Japan - Year-over-year growth 2024-2029 (%)
- Data Table on Japan - Year-over-year growth 2024-2029 (%)
- 12.13 France - Market size and forecast 2024-2029
- Chart on France - Market size and forecast 2024-2029 ($ billion)
- Data Table on France - Market size and forecast 2024-2029 ($ billion)
- Chart on France - Year-over-year growth 2024-2029 (%)
- Data Table on France - Year-over-year growth 2024-2029 (%)
- 12.14 India - Market size and forecast 2024-2029
- Chart on India - Market size and forecast 2024-2029 ($ billion)
- Data Table on India - Market size and forecast 2024-2029 ($ billion)
- Chart on India - Year-over-year growth 2024-2029 (%)
- Data Table on India - Year-over-year growth 2024-2029 (%)
- 12.15 Italy - Market size and forecast 2024-2029
- Chart on Italy - Market size and forecast 2024-2029 ($ billion)
- Data Table on Italy - Market size and forecast 2024-2029 ($ billion)
- Chart on Italy - Year-over-year growth 2024-2029 (%)
- Data Table on Italy - Year-over-year growth 2024-2029 (%)
- 12.16 Brazil - Market size and forecast 2024-2029
- Chart on Brazil - Market size and forecast 2024-2029 ($ billion)
- Data Table on Brazil - Market size and forecast 2024-2029 ($ billion)
- Chart on Brazil - Year-over-year growth 2024-2029 (%)
- Data Table on Brazil - Year-over-year growth 2024-2029 (%)
- 12.17 Market opportunity By Geographical Landscape
- Market opportunity By Geographical Landscape ($ billion)
- Data Tables on Market opportunity By Geographical Landscape ($ billion)
13 Drivers, Challenges, and Opportunity/Restraints
- 13.1 Market drivers
- 13.2 Market challenges
- 13.3 Impact of drivers and challenges
- Impact of drivers and challenges in 2024 and 2029
- 13.4 Market opportunities/restraints
14 Competitive Landscape
- 14.1 Overview
- 14.2 Competitive Landscape
- Overview on criticality of inputs and factors of differentiation
- 14.3 Landscape disruption
- Overview on factors of disruption
- 14.4 Industry risks
- Impact of key risks on business
15 Competitive Analysis
- 15.1 Companies profiled
- Companies covered
- 15.2 Company ranking index
- Company ranking index
- 15.3 Market positioning of companies
- Matrix on companies position and classification
- 15.4 Amgen Inc.
- Amgen Inc. - Overview
- Amgen Inc. - Product / Service
- Amgen Inc. - Key news
- Amgen Inc. - Key offerings
- SWOT
- 15.5 AstraZeneca Plc
- AstraZeneca Plc - Overview
- AstraZeneca Plc - Product / Service
- AstraZeneca Plc - Key news
- AstraZeneca Plc - Key offerings
- SWOT
- 15.6 Bristol Myers Squibb Co.
- Bristol Myers Squibb Co. - Overview
- Bristol Myers Squibb Co. - Product / Service
- Bristol Myers Squibb Co. - Key news
- Bristol Myers Squibb Co. - Key offerings
- SWOT
- 15.7 Catalent Inc.
- Catalent Inc. - Overview
- Catalent Inc. - Business segments
- Catalent Inc. - Key offerings
- Catalent Inc. - Segment focus
- SWOT
- 15.8 Eli Lilly and Co.
- Eli Lilly and Co. - Overview
- Eli Lilly and Co. - Product / Service
- Eli Lilly and Co. - Key offerings
- SWOT
- 15.9 F. Hoffmann La Roche Ltd.
- F. Hoffmann La Roche Ltd. - Overview
- F. Hoffmann La Roche Ltd. - Business segments
- F. Hoffmann La Roche Ltd. - Key news
- F. Hoffmann La Roche Ltd. - Key offerings
- F. Hoffmann La Roche Ltd. - Segment focus
- SWOT
- 15.10 Gilead Sciences Inc.
- Gilead Sciences Inc. - Overview
- Gilead Sciences Inc. - Product / Service
- Gilead Sciences Inc. - Key news
- Gilead Sciences Inc. - Key offerings
- SWOT
- 15.11 Johnson and Johnson Services Inc.
- Johnson and Johnson Services Inc. - Overview
- Johnson and Johnson Services Inc. - Business segments
- Johnson and Johnson Services Inc. - Key news
- Johnson and Johnson Services Inc. - Key offerings
- Johnson and Johnson Services Inc. - Segment focus
- SWOT
- 15.12 Lonza Group Ltd.
- Lonza Group Ltd. - Overview
- Lonza Group Ltd. - Business segments
- Lonza Group Ltd. - Key news
- Lonza Group Ltd. - Key offerings
- Lonza Group Ltd. - Segment focus
- SWOT
- 15.13 Merck and Co. Inc.
- Merck and Co. Inc. - Overview
- Merck and Co. Inc. - Business segments
- Merck and Co. Inc. - Key news
- Merck and Co. Inc. - Key offerings
- Merck and Co. Inc. - Segment focus
- SWOT
- 15.14 Novartis AG
- Novartis AG - Overview
- Novartis AG - Business segments
- Novartis AG - Key news
- Novartis AG - Key offerings
- Novartis AG - Segment focus
- SWOT
- 15.15 Pfizer Inc.
- Pfizer Inc. - Overview
- Pfizer Inc. - Product / Service
- Pfizer Inc. - Key news
- Pfizer Inc. - Key offerings
- SWOT
- 15.16 Sanofi SA
- Sanofi SA - Overview
- Sanofi SA - Business segments
- Sanofi SA - Key news
- Sanofi SA - Key offerings
- Sanofi SA - Segment focus
- SWOT
- 15.17 Takeda Pharmaceutical Co. Ltd.
- Takeda Pharmaceutical Co. Ltd. - Overview
- Takeda Pharmaceutical Co. Ltd. - Product / Service
- Takeda Pharmaceutical Co. Ltd. - Key news
- Takeda Pharmaceutical Co. Ltd. - Key offerings
- SWOT
- 15.18 Thermo Fisher Scientific Inc.
- Thermo Fisher Scientific Inc. - Overview
- Thermo Fisher Scientific Inc. - Business segments
- Thermo Fisher Scientific Inc. - Key news
- Thermo Fisher Scientific Inc. - Key offerings
- Thermo Fisher Scientific Inc. - Segment focus
- SWOT
16 Appendix
- 16.1 Scope of the report
- 16.2 Inclusions and exclusions checklist
- Inclusions checklist
- Exclusions checklist
- 16.3 Currency conversion rates for US$
- Currency conversion rates for US$
- 16.4 Research methodology
- Research methodology
- 16.5 Data procurement
- Information sources
- 16.6 Data validation
- Data validation
- 16.7 Validation techniques employed for market sizing
- Validation techniques employed for market sizing
- 16.8 Data synthesis
- Data synthesis
- 16.9 360 degree market analysis
- 360 degree market analysis
- 16.10 List of abbreviations
- List of abbreviations

