|
|
市場調査レポート
商品コード
1583079
洋上風力発電の世界市場、2024~2028年Global Offshore Wind Power Market 2024-2028 |
||||||
|
|||||||
カスタマイズ可能
|
|||||||


| 洋上風力発電の世界市場、2024~2028年 |
|
出版日: 2024年08月15日
発行: TechNavio
ページ情報: 英文 174 Pages
納期: 即納可能
|

全表示
- 概要
- 図表
- 目次
洋上風力発電市場、2024~2028年
洋上風力発電市場は2023~2028年に339億6,000万米ドル、予測期間中のCAGRは17.17%で成長すると予測されます。当レポートでは、洋上風力発電市場の全体的な分析、市場規模・予測、動向、成長促進要因、課題、約25のベンダーを網羅したベンダー分析などを掲載しています。
現在の市場シナリオ、最新動向と促進要因、市場環境全体に関する最新分析を提供しています。市場は、世界のエネルギー需要の増加、政府支援の高まり、風力発電のLCOE低下によって牽引されています。
| 市場範囲 | |
|---|---|
| 基準年 | 2024年 |
| 終了年 | 2028年 |
| 予測期間 | 2024~2028年 |
| 成長モメンタム | 加速 |
| 前年比[2024年] | 14.88% |
| CAGR | 17.17% |
| 増分額 | 339億6,000万米ドル |
本調査では、クリーンエネルギー技術の人気の高まりが、今後数年間の洋上風力発電市場の成長を促進する主要な理由の1つであると特定しています。また、風力発電市場の技術開拓と浮体式風力タービンの人気の高まりは、市場の大きな需要につながります。
目次
第1章 エグゼクティブサマリー
- 市場概要
第2章 市場情勢
- 市場エコシステム
- 市場の特徴
- バリューチェーン分析
第3章 市場規模の評価
- 市場の定義
- 市場セグメント分析
- 市場規模 2023年
- 市場の展望 2023~2028年
第4章 市場規模実績
- 洋上風力発電の世界市場 2018~2022年
- タイプ別セグメント分析 2018~2022年
- 製品タイプ別セグメント分析 2018~2022年
- 地域別セグメント分析 2018~2022年
- 国別セグメント分析 2018~2022年
第5章 ファイブフォース分析
- ファイブフォースの要約
- 買い手の交渉力
- 供給企業の交渉力
- 新規参入業者の脅威
- 代替品の脅威
- 競争の脅威
- 市況
第6章 タイプ別市場セグメンテーション
- 市場セグメンテーション
- 比較:タイプ別
- モノパイル:市場規模と予測 2023~2028年
- ジャケット:市場規模と予測 2023~2028年
- その他:市場規模と予測 2023~2028年
- タイプ別の市場機会
第7章 製品タイプ別市場セグメンテーション
- 市場セグメンテーション
- 比較:製品タイプ別
- 固定構造物:市場規模と予測 2023~2028年
- 浮体構造物:市場規模と予測 2023~2028年
- 製品タイプ別の市場機会
第8章 顧客情勢
- 顧客情勢概要
第9章 地域別情勢
- 地域別セグメンテーション
- 比較:地域別
- 欧州:市場規模と予測 2023~2028年
- アジア太平洋:市場規模と予測 2023~2028年
- 北米:市場規模と予測 2023~2028年
- 南米:市場規模と予測 2023~2028年
- 中東・アフリカ:市場規模と予測 2023~2028年
- 英国:市場規模と予測 2023~2028年
- ドイツ:市場規模と予測 2023~2028年
- ベルギー:市場規模と予測 2023~2028年
- 米国:市場規模と予測 2023~2028年
- 日本:市場規模と予測 2023~2028年
- 地域情勢別の市場機会
第10章 促進要因・課題・機会・抑制要因
- 市場促進要因
- 市場課題
- 促進要因と課題の影響
- 市場機会・抑制要因
第11章 競合情勢
- 概要
- 競合情勢
- 混乱の状況
- 業界のリスク
第12章 競合分析
- 企業プロファイル
- 企業の市場ポジショニング
- CAPE Holland BV
- China Steel Corp.
- Dongfang Electric Corp.
- Doosan Corp.
- Erndtebcker Eisenwerk GmbH and Co KG
- General Electric Co.
- Hyosung Heavy Industries Corp.
- Hyundai Heavy Industries Co. Ltd.
- JDR Cable Systems Ltd.
- Nexans SA
- Nordex SE
- Senvion Wind Technology Pvt. Ltd.
- Siemens Gamesa Renewable Energy SA
- Sinovel Wind Group Co. Ltd.
- Vestas Wind Systems AS
第13章 付録
Exhibits:
- Exhibits1: Executive Summary - Chart on Market Overview
- Exhibits2: Executive Summary - Data Table on Market Overview
- Exhibits3: Executive Summary - Chart on Global Market Characteristics
- Exhibits4: Executive Summary - Chart on Market By Geographical Landscape
- Exhibits5: Executive Summary - Chart on Market Segmentation by Type
- Exhibits6: Executive Summary - Chart on Market Segmentation by Product Type
- Exhibits7: Executive Summary - Chart on Incremental Growth
- Exhibits8: Executive Summary - Data Table on Incremental Growth
- Exhibits9: Executive Summary - Chart on Company Market Positioning
- Exhibits10: Parent Market
- Exhibits11: Data Table on - Parent Market
- Exhibits12: Market characteristics analysis
- Exhibits13: Value Chain Analysis
- Exhibits14: Offerings of companies included in the market definition
- Exhibits15: Market segments
- Exhibits16: Chart on Global - Market size and forecast 2023-2028 ($ million)
- Exhibits17: Data Table on Global - Market size and forecast 2023-2028 ($ million)
- Exhibits18: Chart on Global Market: Year-over-year growth 2023-2028 (%)
- Exhibits19: Data Table on Global Market: Year-over-year growth 2023-2028 (%)
- Exhibits20: Historic Market Size - Data Table on Global Offshore Wind Power Market 2018 - 2022 ($ million)
- Exhibits21: Historic Market Size - Type Segment 2018 - 2022 ($ million)
- Exhibits22: Historic Market Size - Product Type Segment 2018 - 2022 ($ million)
- Exhibits23: Historic Market Size - Geography Segment 2018 - 2022 ($ million)
- Exhibits24: Historic Market Size - Country Segment 2018 - 2022 ($ million)
- Exhibits25: Five forces analysis - Comparison between 2023 and 2028
- Exhibits26: Bargaining power of buyers - Impact of key factors 2023 and 2028
- Exhibits27: Bargaining power of suppliers - Impact of key factors in 2023 and 2028
- Exhibits28: Threat of new entrants - Impact of key factors in 2023 and 2028
- Exhibits29: Threat of substitutes - Impact of key factors in 2023 and 2028
- Exhibits30: Threat of rivalry - Impact of key factors in 2023 and 2028
- Exhibits31: Chart on Market condition - Five forces 2023 and 2028
- Exhibits32: Chart on Type - Market share 2023-2028 (%)
- Exhibits33: Data Table on Type - Market share 2023-2028 (%)
- Exhibits34: Chart on Comparison by Type
- Exhibits35: Data Table on Comparison by Type
- Exhibits36: Chart on Monopile - Market size and forecast 2023-2028 ($ million)
- Exhibits37: Data Table on Monopile - Market size and forecast 2023-2028 ($ million)
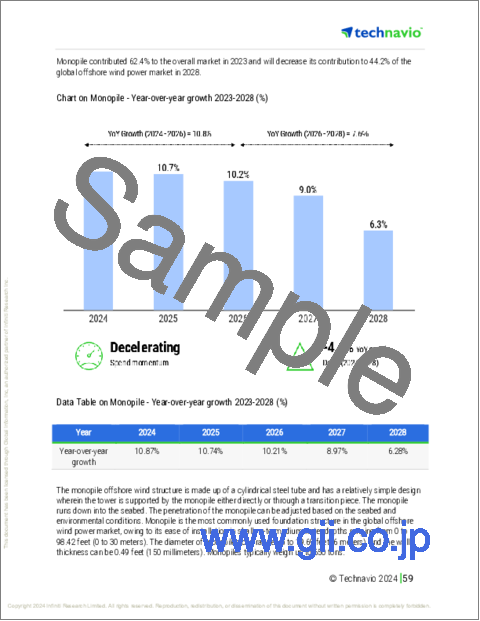
- Exhibits38: Chart on Monopile - Year-over-year growth 2023-2028 (%)
- Exhibits39: Data Table on Monopile - Year-over-year growth 2023-2028 (%)
- Exhibits40: Chart on Jacket - Market size and forecast 2023-2028 ($ million)
- Exhibits41: Data Table on Jacket - Market size and forecast 2023-2028 ($ million)
- Exhibits42: Chart on Jacket - Year-over-year growth 2023-2028 (%)
- Exhibits43: Data Table on Jacket - Year-over-year growth 2023-2028 (%)
- Exhibits44: Chart on Others - Market size and forecast 2023-2028 ($ million)
- Exhibits45: Data Table on Others - Market size and forecast 2023-2028 ($ million)
- Exhibits46: Chart on Others - Year-over-year growth 2023-2028 (%)
- Exhibits47: Data Table on Others - Year-over-year growth 2023-2028 (%)
- Exhibits48: Market opportunity by Type ($ million)
- Exhibits49: Data Table on Market opportunity by Type ($ million)
- Exhibits50: Chart on Product Type - Market share 2023-2028 (%)
- Exhibits51: Data Table on Product Type - Market share 2023-2028 (%)
- Exhibits52: Chart on Comparison by Product Type
- Exhibits53: Data Table on Comparison by Product Type
- Exhibits54: Chart on Fixed structure - Market size and forecast 2023-2028 ($ million)
- Exhibits55: Data Table on Fixed structure - Market size and forecast 2023-2028 ($ million)
- Exhibits56: Chart on Fixed structure - Year-over-year growth 2023-2028 (%)
- Exhibits57: Data Table on Fixed structure - Year-over-year growth 2023-2028 (%)
- Exhibits58: Chart on Floating structure - Market size and forecast 2023-2028 ($ million)
- Exhibits59: Data Table on Floating structure - Market size and forecast 2023-2028 ($ million)
- Exhibits60: Chart on Floating structure - Year-over-year growth 2023-2028 (%)
- Exhibits61: Data Table on Floating structure - Year-over-year growth 2023-2028 (%)
- Exhibits62: Market opportunity by Product Type ($ million)
- Exhibits63: Data Table on Market opportunity by Product Type ($ million)
- Exhibits64: Analysis of price sensitivity, lifecycle, customer purchase basket, adoption rates, and purchase criteria
- Exhibits65: Chart on Market share By Geographical Landscape 2023-2028 (%)
- Exhibits66: Data Table on Market share By Geographical Landscape 2023-2028 (%)
- Exhibits67: Chart on Geographic comparison
- Exhibits68: Data Table on Geographic comparison
- Exhibits69: Chart on Europe - Market size and forecast 2023-2028 ($ million)
- Exhibits70: Data Table on Europe - Market size and forecast 2023-2028 ($ million)
- Exhibits71: Chart on Europe - Year-over-year growth 2023-2028 (%)
- Exhibits72: Data Table on Europe - Year-over-year growth 2023-2028 (%)
- Exhibits73: Chart on APAC - Market size and forecast 2023-2028 ($ million)
- Exhibits74: Data Table on APAC - Market size and forecast 2023-2028 ($ million)
- Exhibits75: Chart on APAC - Year-over-year growth 2023-2028 (%)
- Exhibits76: Data Table on APAC - Year-over-year growth 2023-2028 (%)
- Exhibits77: Chart on North America - Market size and forecast 2023-2028 ($ million)
- Exhibits78: Data Table on North America - Market size and forecast 2023-2028 ($ million)
- Exhibits79: Chart on North America - Year-over-year growth 2023-2028 (%)
- Exhibits80: Data Table on North America - Year-over-year growth 2023-2028 (%)
- Exhibits81: Chart on South America - Market size and forecast 2023-2028 ($ million)
- Exhibits82: Data Table on South America - Market size and forecast 2023-2028 ($ million)
- Exhibits83: Chart on South America - Year-over-year growth 2023-2028 (%)
- Exhibits84: Data Table on South America - Year-over-year growth 2023-2028 (%)
- Exhibits85: Chart on Middle East and Africa - Market size and forecast 2023-2028 ($ million)
- Exhibits86: Data Table on Middle East and Africa - Market size and forecast 2023-2028 ($ million)
- Exhibits87: Chart on Middle East and Africa - Year-over-year growth 2023-2028 (%)
- Exhibits88: Data Table on Middle East and Africa - Year-over-year growth 2023-2028 (%)
- Exhibits89: Chart on UK - Market size and forecast 2023-2028 ($ million)
- Exhibits90: Data Table on UK - Market size and forecast 2023-2028 ($ million)
- Exhibits91: Chart on UK - Year-over-year growth 2023-2028 (%)
- Exhibits92: Data Table on UK - Year-over-year growth 2023-2028 (%)
- Exhibits93: Chart on Germany - Market size and forecast 2023-2028 ($ million)
- Exhibits94: Data Table on Germany - Market size and forecast 2023-2028 ($ million)
- Exhibits95: Chart on Germany - Year-over-year growth 2023-2028 (%)
- Exhibits96: Data Table on Germany - Year-over-year growth 2023-2028 (%)
- Exhibits97: Chart on Belgium - Market size and forecast 2023-2028 ($ million)
- Exhibits98: Data Table on Belgium - Market size and forecast 2023-2028 ($ million)
- Exhibits99: Chart on Belgium - Year-over-year growth 2023-2028 (%)
- Exhibits100: Data Table on Belgium - Year-over-year growth 2023-2028 (%)
- Exhibits101: Chart on US - Market size and forecast 2023-2028 ($ million)
- Exhibits102: Data Table on US - Market size and forecast 2023-2028 ($ million)
- Exhibits103: Chart on US - Year-over-year growth 2023-2028 (%)
- Exhibits104: Data Table on US - Year-over-year growth 2023-2028 (%)
- Exhibits105: Chart on Japan - Market size and forecast 2023-2028 ($ million)
- Exhibits106: Data Table on Japan - Market size and forecast 2023-2028 ($ million)
- Exhibits107: Chart on Japan - Year-over-year growth 2023-2028 (%)
- Exhibits108: Data Table on Japan - Year-over-year growth 2023-2028 (%)
- Exhibits109: Market opportunity By Geographical Landscape ($ million)
- Exhibits110: Data Tables on Market opportunity By Geographical Landscape ($ million)
- Exhibits111: Impact of drivers and challenges in 2023 and 2028
- Exhibits112: Overview on criticality of inputs and factors of differentiation
- Exhibits113: Overview on factors of disruption
- Exhibits114: Impact of key risks on business
- Exhibits115: Companies covered
- Exhibits116: Matrix on companies position and classification
- Exhibits117: CAPE Holland BV - Overview
- Exhibits118: CAPE Holland BV - Product / Service
- Exhibits119: CAPE Holland BV - Key offerings
- Exhibits120: China Steel Corp. - Overview
- Exhibits121: China Steel Corp. - Product / Service
- Exhibits122: China Steel Corp. - Key offerings
- Exhibits123: Dongfang Electric Corp. - Overview
- Exhibits124: Dongfang Electric Corp. - Product / Service
- Exhibits125: Dongfang Electric Corp. - Key offerings
- Exhibits126: Doosan Corp. - Overview
- Exhibits127: Doosan Corp. - Business segments
- Exhibits128: Doosan Corp. - Key news
- Exhibits129: Doosan Corp. - Key offerings
- Exhibits130: Doosan Corp. - Segment focus
- Exhibits131: Erndtebcker Eisenwerk GmbH and Co KG - Overview
- Exhibits132: Erndtebcker Eisenwerk GmbH and Co KG - Product / Service
- Exhibits133: Erndtebcker Eisenwerk GmbH and Co KG - Key offerings
- Exhibits134: General Electric Co. - Overview
- Exhibits135: General Electric Co. - Business segments
- Exhibits136: General Electric Co. - Key news
- Exhibits137: General Electric Co. - Key offerings
- Exhibits138: General Electric Co. - Segment focus
- Exhibits139: Hyosung Heavy Industries Corp. - Overview
- Exhibits140: Hyosung Heavy Industries Corp. - Product / Service
- Exhibits141: Hyosung Heavy Industries Corp. - Key offerings
- Exhibits142: Hyundai Heavy Industries Co. Ltd. - Overview
- Exhibits143: Hyundai Heavy Industries Co. Ltd. - Product / Service
- Exhibits144: Hyundai Heavy Industries Co. Ltd. - Key offerings
- Exhibits145: JDR Cable Systems Ltd. - Overview
- Exhibits146: JDR Cable Systems Ltd. - Product / Service
- Exhibits147: JDR Cable Systems Ltd. - Key offerings
- Exhibits148: Nexans SA - Overview
- Exhibits149: Nexans SA - Business segments
- Exhibits150: Nexans SA - Key news
- Exhibits151: Nexans SA - Key offerings
- Exhibits152: Nexans SA - Segment focus
- Exhibits153: Nordex SE - Overview
- Exhibits154: Nordex SE - Business segments
- Exhibits155: Nordex SE - Key offerings
- Exhibits156: Nordex SE - Segment focus
- Exhibits157: Senvion Wind Technology Pvt. Ltd. - Overview
- Exhibits158: Senvion Wind Technology Pvt. Ltd. - Product / Service
- Exhibits159: Senvion Wind Technology Pvt. Ltd. - Key offerings
- Exhibits160: Siemens Gamesa Renewable Energy SA - Overview
- Exhibits161: Siemens Gamesa Renewable Energy SA - Product / Service
- Exhibits162: Siemens Gamesa Renewable Energy SA - Key offerings
- Exhibits163: Sinovel Wind Group Co. Ltd. - Overview
- Exhibits164: Sinovel Wind Group Co. Ltd. - Product / Service
- Exhibits165: Sinovel Wind Group Co. Ltd. - Key offerings
- Exhibits166: Vestas Wind Systems AS - Overview
- Exhibits167: Vestas Wind Systems AS - Business segments
- Exhibits168: Vestas Wind Systems AS - Key offerings
- Exhibits169: Vestas Wind Systems AS - Segment focus
- Exhibits170: Inclusions checklist
- Exhibits171: Exclusions checklist
- Exhibits172: Currency conversion rates for US$
- Exhibits173: Research methodology
- Exhibits174: Information sources
- Exhibits175: Data validation
- Exhibits176: Validation techniques employed for market sizing
- Exhibits177: Data synthesis
- Exhibits178: 360 degree market analysis
- Exhibits179: List of abbreviations
Offshore Wind Power Market 2024-2028
The offshore wind power market is forecasted to grow by USD 33960 mn during 2023-2028, accelerating at a CAGR of 17.17% during the forecast period. The report on the offshore wind power market provides a holistic analysis, market size and forecast, trends, growth drivers, and challenges, as well as vendor analysis covering around 25 vendors.
The report offers an up-to-date analysis regarding the current market scenario, the latest trends and drivers, and the overall market environment. The market is driven by rise in global energy demand, rising government support, and declining lcoe of wind power generation.
| Market Scope | |
|---|---|
| Base Year | 2024 |
| End Year | 2028 |
| Series Year | 2024-2028 |
| Growth Momentum | Accelerate |
| YOY 2024 | 14.88% |
| CAGR | 17.17% |
| Incremental Value | $33960 mn |
Technavio's offshore wind power market is segmented as below:
By Type
- Monopile
- Jacket
- Others
By Product Type
- Fixed structure
- Floating structure
By Geographical Landscape
- Europe
- APAC
- North America
- South America
- Middle East and Africa
This study identifies the rising popularity of clean energy technologies as one of the prime reasons driving the offshore wind power market growth during the next few years. Also, technological developments in wind power market and rising popularity of floating wind turbines will lead to sizable demand in the market.
The report on the offshore wind power market covers the following areas:
- Offshore wind power market sizing
- Offshore wind power market forecast
- Offshore wind power market industry analysis
The robust vendor analysis is designed to help clients improve their market position, and in line with this, this report provides a detailed analysis of several leading offshore wind power market vendors that include CAPE Holland BV, China Steel Corp., Dongfang Electric Corp. Ltd., Doosan Corp., Erndtebcker Eisenwerk GmbH and Co KG, General Electric Co., Hyosung Heavy Industries Corp., Hyundai Heavy Industries Co. Ltd., JDR Cable Systems Ltd., Lamprell Plc, Nexans SA, NKT AS, Nordex SE, Prysmian Spa, Senvion Wind Technology Pvt. Ltd., Siemens Gamesa Renewable Energy SA, Sinovel Wind Group Co. Ltd., Verdict Media Ltd., Vestas Wind Systems AS, and Xinjiang Goldwind Science and Technology Co. Ltd.. Also, the offshore wind power market analysis report includes information on upcoming trends and challenges that will influence market growth. This is to help companies strategize and leverage all forthcoming growth opportunities.
The study was conducted using an objective combination of primary and secondary information including inputs from key participants in the industry. The report contains a comprehensive market and vendor landscape in addition to an analysis of the key vendors.
The publisher presents a detailed picture of the market by the way of study, synthesis, and summation of data from multiple sources by an analysis of key parameters such as profit, pricing, competition, and promotions. It presents various market facets by identifying the key industry influencers. The data presented is comprehensive, reliable, and a result of extensive primary and secondary research. The market research reports provide a complete competitive landscape and an in-depth vendor selection methodology and analysis using qualitative and quantitative research to forecast accurate market growth.
Table of Contents
1 Executive Summary
- 1.1 Market overview
- Executive Summary - Chart on Market Overview
- Executive Summary - Data Table on Market Overview
- Executive Summary - Chart on Global Market Characteristics
- Executive Summary - Chart on Market By Geographical Landscape
- Executive Summary - Chart on Market Segmentation by Type
- Executive Summary - Chart on Market Segmentation by Product Type
- Executive Summary - Chart on Incremental Growth
- Executive Summary - Data Table on Incremental Growth
- Executive Summary - Chart on Company Market Positioning
2 Market Landscape
- 2.1 Market ecosystem
- Parent Market
- Data Table on - Parent Market
- 2.2 Market characteristics
- Market characteristics analysis
- 2.3 Value chain analysis
- Value Chain Analysis
3 Market Sizing
- 3.1 Market definition
- Offerings of companies included in the market definition
- 3.2 Market segment analysis
- Market segments
- 3.3 Market size 2023
- 3.4 Market outlook: Forecast for 2023-2028
- Chart on Global - Market size and forecast 2023-2028 ($ million)
- Data Table on Global - Market size and forecast 2023-2028 ($ million)
- Chart on Global Market: Year-over-year growth 2023-2028 (%)
- Data Table on Global Market: Year-over-year growth 2023-2028 (%)
4 Historic Market Size
- 4.1 Global Offshore Wind Power Market 2018 - 2022
- Historic Market Size - Data Table on Global Offshore Wind Power Market 2018 - 2022 ($ million)
- 4.2 Type segment analysis 2018 - 2022
- Historic Market Size - Type Segment 2018 - 2022 ($ million)
- 4.3 Product Type segment analysis 2018 - 2022
- Historic Market Size - Product Type Segment 2018 - 2022 ($ million)
- 4.4 Geography segment analysis 2018 - 2022
- Historic Market Size - Geography Segment 2018 - 2022 ($ million)
- 4.5 Country segment analysis 2018 - 2022
- Historic Market Size - Country Segment 2018 - 2022 ($ million)
5 Five Forces Analysis
- 5.1 Five forces summary
- Five forces analysis - Comparison between 2023 and 2028
- 5.2 Bargaining power of buyers
- Bargaining power of buyers - Impact of key factors 2023 and 2028
- 5.3 Bargaining power of suppliers
- Bargaining power of suppliers - Impact of key factors in 2023 and 2028
- 5.4 Threat of new entrants
- Threat of new entrants - Impact of key factors in 2023 and 2028
- 5.5 Threat of substitutes
- Threat of substitutes - Impact of key factors in 2023 and 2028
- 5.6 Threat of rivalry
- Threat of rivalry - Impact of key factors in 2023 and 2028
- 5.7 Market condition
- Chart on Market condition - Five forces 2023 and 2028
6 Market Segmentation by Type
- 6.1 Market segments
- Chart on Type - Market share 2023-2028 (%)
- Data Table on Type - Market share 2023-2028 (%)
- 6.2 Comparison by Type
- Chart on Comparison by Type
- Data Table on Comparison by Type
- 6.3 Monopile - Market size and forecast 2023-2028
- Chart on Monopile - Market size and forecast 2023-2028 ($ million)
- Data Table on Monopile - Market size and forecast 2023-2028 ($ million)
- Chart on Monopile - Year-over-year growth 2023-2028 (%)
- Data Table on Monopile - Year-over-year growth 2023-2028 (%)
- 6.4 Jacket - Market size and forecast 2023-2028
- Chart on Jacket - Market size and forecast 2023-2028 ($ million)
- Data Table on Jacket - Market size and forecast 2023-2028 ($ million)
- Chart on Jacket - Year-over-year growth 2023-2028 (%)
- Data Table on Jacket - Year-over-year growth 2023-2028 (%)
- 6.5 Others - Market size and forecast 2023-2028
- Chart on Others - Market size and forecast 2023-2028 ($ million)
- Data Table on Others - Market size and forecast 2023-2028 ($ million)
- Chart on Others - Year-over-year growth 2023-2028 (%)
- Data Table on Others - Year-over-year growth 2023-2028 (%)
- 6.6 Market opportunity by Type
- Market opportunity by Type ($ million)
- Data Table on Market opportunity by Type ($ million)
7 Market Segmentation by Product Type
- 7.1 Market segments
- Chart on Product Type - Market share 2023-2028 (%)
- Data Table on Product Type - Market share 2023-2028 (%)
- 7.2 Comparison by Product Type
- Chart on Comparison by Product Type
- Data Table on Comparison by Product Type
- 7.3 Fixed structure - Market size and forecast 2023-2028
- Chart on Fixed structure - Market size and forecast 2023-2028 ($ million)
- Data Table on Fixed structure - Market size and forecast 2023-2028 ($ million)
- Chart on Fixed structure - Year-over-year growth 2023-2028 (%)
- Data Table on Fixed structure - Year-over-year growth 2023-2028 (%)
- 7.4 Floating structure - Market size and forecast 2023-2028
- Chart on Floating structure - Market size and forecast 2023-2028 ($ million)
- Data Table on Floating structure - Market size and forecast 2023-2028 ($ million)
- Chart on Floating structure - Year-over-year growth 2023-2028 (%)
- Data Table on Floating structure - Year-over-year growth 2023-2028 (%)
- 7.5 Market opportunity by Product Type
- Market opportunity by Product Type ($ million)
- Data Table on Market opportunity by Product Type ($ million)
8 Customer Landscape
- 8.1 Customer landscape overview
- Analysis of price sensitivity, lifecycle, customer purchase basket, adoption rates, and purchase criteria
9 Geographic Landscape
- 9.1 Geographic segmentation
- Chart on Market share By Geographical Landscape 2023-2028 (%)
- Data Table on Market share By Geographical Landscape 2023-2028 (%)
- 9.2 Geographic comparison
- Chart on Geographic comparison
- Data Table on Geographic comparison
- 9.3 Europe - Market size and forecast 2023-2028
- Chart on Europe - Market size and forecast 2023-2028 ($ million)
- Data Table on Europe - Market size and forecast 2023-2028 ($ million)
- Chart on Europe - Year-over-year growth 2023-2028 (%)
- Data Table on Europe - Year-over-year growth 2023-2028 (%)
- 9.4 APAC - Market size and forecast 2023-2028
- Chart on APAC - Market size and forecast 2023-2028 ($ million)
- Data Table on APAC - Market size and forecast 2023-2028 ($ million)
- Chart on APAC - Year-over-year growth 2023-2028 (%)
- Data Table on APAC - Year-over-year growth 2023-2028 (%)
- 9.5 North America - Market size and forecast 2023-2028
- Chart on North America - Market size and forecast 2023-2028 ($ million)
- Data Table on North America - Market size and forecast 2023-2028 ($ million)
- Chart on North America - Year-over-year growth 2023-2028 (%)
- Data Table on North America - Year-over-year growth 2023-2028 (%)
- 9.6 South America - Market size and forecast 2023-2028
- Chart on South America - Market size and forecast 2023-2028 ($ million)
- Data Table on South America - Market size and forecast 2023-2028 ($ million)
- Chart on South America - Year-over-year growth 2023-2028 (%)
- Data Table on South America - Year-over-year growth 2023-2028 (%)
- 9.7 Middle East and Africa - Market size and forecast 2023-2028
- Chart on Middle East and Africa - Market size and forecast 2023-2028 ($ million)
- Data Table on Middle East and Africa - Market size and forecast 2023-2028 ($ million)
- Chart on Middle East and Africa - Year-over-year growth 2023-2028 (%)
- Data Table on Middle East and Africa - Year-over-year growth 2023-2028 (%)
- 9.8 UK - Market size and forecast 2023-2028
- Chart on UK - Market size and forecast 2023-2028 ($ million)
- Data Table on UK - Market size and forecast 2023-2028 ($ million)
- Chart on UK - Year-over-year growth 2023-2028 (%)
- Data Table on UK - Year-over-year growth 2023-2028 (%)
- 9.9 Germany - Market size and forecast 2023-2028
- Chart on Germany - Market size and forecast 2023-2028 ($ million)
- Data Table on Germany - Market size and forecast 2023-2028 ($ million)
- Chart on Germany - Year-over-year growth 2023-2028 (%)
- Data Table on Germany - Year-over-year growth 2023-2028 (%)
- 9.10 Belgium - Market size and forecast 2023-2028
- Chart on Belgium - Market size and forecast 2023-2028 ($ million)
- Data Table on Belgium - Market size and forecast 2023-2028 ($ million)
- Chart on Belgium - Year-over-year growth 2023-2028 (%)
- Data Table on Belgium - Year-over-year growth 2023-2028 (%)
- 9.11 US - Market size and forecast 2023-2028
- Chart on US - Market size and forecast 2023-2028 ($ million)
- Data Table on US - Market size and forecast 2023-2028 ($ million)
- Chart on US - Year-over-year growth 2023-2028 (%)
- Data Table on US - Year-over-year growth 2023-2028 (%)
- 9.12 Japan - Market size and forecast 2023-2028
- Chart on Japan - Market size and forecast 2023-2028 ($ million)
- Data Table on Japan - Market size and forecast 2023-2028 ($ million)
- Chart on Japan - Year-over-year growth 2023-2028 (%)
- Data Table on Japan - Year-over-year growth 2023-2028 (%)
- 9.13 Market opportunity By Geographical Landscape
- Market opportunity By Geographical Landscape ($ million)
- Data Tables on Market opportunity By Geographical Landscape ($ million)
10 Drivers, Challenges, and Opportunity/Restraints
- 10.1 Market drivers
- 10.2 Market challenges
- 10.3 Impact of drivers and challenges
- Impact of drivers and challenges in 2023 and 2028
- 10.4 Market opportunities/restraints
11 Competitive Landscape
- 11.1 Overview
- 11.2 Competitive Landscape
- Overview on criticality of inputs and factors of differentiation
- 11.3 Landscape disruption
- Overview on factors of disruption
- 11.4 Industry risks
- Impact of key risks on business
12 Competitive Analysis
- 12.1 Companies profiled
- Companies covered
- 12.2 Market positioning of companies
- Matrix on companies position and classification
- 12.3 CAPE Holland BV
- CAPE Holland BV - Overview
- CAPE Holland BV - Product / Service
- CAPE Holland BV - Key offerings
- 12.4 China Steel Corp.
- China Steel Corp. - Overview
- China Steel Corp. - Product / Service
- China Steel Corp. - Key offerings
- 12.5 Dongfang Electric Corp.
- Dongfang Electric Corp. - Overview
- Dongfang Electric Corp. - Product / Service
- Dongfang Electric Corp. - Key offerings
- 12.6 Doosan Corp.
- Doosan Corp. - Overview
- Doosan Corp. - Business segments
- Doosan Corp. - Key news
- Doosan Corp. - Key offerings
- Doosan Corp. - Segment focus
- 12.7 Erndtebcker Eisenwerk GmbH and Co KG
- Erndtebcker Eisenwerk GmbH and Co KG - Overview
- Erndtebcker Eisenwerk GmbH and Co KG - Product / Service
- Erndtebcker Eisenwerk GmbH and Co KG - Key offerings
- 12.8 General Electric Co.
- General Electric Co. - Overview
- General Electric Co. - Business segments
- General Electric Co. - Key news
- General Electric Co. - Key offerings
- General Electric Co. - Segment focus
- 12.9 Hyosung Heavy Industries Corp.
- Hyosung Heavy Industries Corp. - Overview
- Hyosung Heavy Industries Corp. - Product / Service
- Hyosung Heavy Industries Corp. - Key offerings
- 12.10 Hyundai Heavy Industries Co. Ltd.
- Hyundai Heavy Industries Co. Ltd. - Overview
- Hyundai Heavy Industries Co. Ltd. - Product / Service
- Hyundai Heavy Industries Co. Ltd. - Key offerings
- 12.11 JDR Cable Systems Ltd.
- JDR Cable Systems Ltd. - Overview
- JDR Cable Systems Ltd. - Product / Service
- JDR Cable Systems Ltd. - Key offerings
- 12.12 Nexans SA
- Nexans SA - Overview
- Nexans SA - Business segments
- Nexans SA - Key news
- Nexans SA - Key offerings
- Nexans SA - Segment focus
- 12.13 Nordex SE
- Nordex SE - Overview
- Nordex SE - Business segments
- Nordex SE - Key offerings
- Nordex SE - Segment focus
- 12.14 Senvion Wind Technology Pvt. Ltd.
- Senvion Wind Technology Pvt. Ltd. - Overview
- Senvion Wind Technology Pvt. Ltd. - Product / Service
- Senvion Wind Technology Pvt. Ltd. - Key offerings
- 12.15 Siemens Gamesa Renewable Energy SA
- Siemens Gamesa Renewable Energy SA - Overview
- Siemens Gamesa Renewable Energy SA - Product / Service
- Siemens Gamesa Renewable Energy SA - Key offerings
- 12.16 Sinovel Wind Group Co. Ltd.
- Sinovel Wind Group Co. Ltd. - Overview
- Sinovel Wind Group Co. Ltd. - Product / Service
- Sinovel Wind Group Co. Ltd. - Key offerings
- 12.17 Vestas Wind Systems AS
- Vestas Wind Systems AS - Overview
- Vestas Wind Systems AS - Business segments
- Vestas Wind Systems AS - Key offerings
- Vestas Wind Systems AS - Segment focus
13 Appendix
- 13.1 Scope of the report
- 13.2 Inclusions and exclusions checklist
- Inclusions checklist
- Exclusions checklist
- 13.3 Currency conversion rates for US$
- Currency conversion rates for US$
- 13.4 Research methodology
- Research methodology
- 13.5 Data procurement
- Information sources
- 13.6 Data validation
- Data validation
- 13.7 Validation techniques employed for market sizing
- Validation techniques employed for market sizing
- 13.8 Data synthesis
- Data synthesis
- 13.9 360 degree market analysis
- 360 degree market analysis
- 13.10 List of abbreviations
- List of abbreviations
