|
|
市場調査レポート
商品コード
1915324
世界の軟水器市場2026-2030年Global Water Softener Market 2026-2030 |
||||||
|
|||||||
カスタマイズ可能
|
|||||||


| 世界の軟水器市場2026-2030年 |
|
出版日: 2026年01月19日
発行: TechNavio
ページ情報: 英文 291 Pages
納期: 即納可能
|

概要
世界の軟水器市場は、2025年から2030年の間に15億2,080万米ドル規模で成長し、予測期間中のCAGRは11.1%と予測されております。
本報告書では、世界の軟水器市場に関する包括的な分析、市場規模と予測、動向、成長要因、課題に加え、約25社のベンダー分析を提供しております。
本レポートは、現在の市場状況、最新の動向と促進要因、市場環境全般に関する最新の分析を提供します。市場は、水軟化製品に対する消費者の意識の高まり、水依存型家電製品に関連する省エネ・コスト削減への注目の増加、集中型水道供給の効率性向上によって牽引されています。
本調査は、業界の主要関係者からの情報を含む、一次情報と二次情報の客観的な組み合わせを用いて実施されました。本レポートには、主要企業の分析に加え、包括的な市場規模データ、地域別分析を伴うセグメント、ベンダー情勢が含まれています。レポートには過去データと予測データが掲載されています。
| 市場範囲 | |
|---|---|
| 基準年 | 2026年 |
| 終了年 | 2030年 |
| 予測期間 | 2026-2030 |
| 成長モメンタム | 加速 |
| 前年比2026年 | 9.2% |
| CAGR | 11.1% |
| 増分額 | 15億2,080万米ドル |
本調査では、今後数年間における世界の軟水器市場成長を牽引する主要要因の一つとして、軟水器における近年の技術進歩の出現を特定しております。また、軟水器へのIoTおよびスマート接続性の統合、ならびに無塩軟水器への需要増加が、市場において相当な需要を生み出すものと見込まれます。
目次
第1章 エグゼクティブサマリー
第2章 Technavio分析
- 価格・ライフサイクル・顧客購入バスケット・採用率・購入基準の分析
- インプットの重要性と差別化の要因
- 混乱の要因
- 促進要因と課題の影響
第3章 市場情勢
- 市場エコシステム
- 市場の特徴
- バリューチェーン分析
第4章 市場規模
- 市場の定義
- 市場セグメント分析
- 市場規模 2025
- 市場の見通し 2025-2030
第5章 市場規模実績
- 世界の軟水器市場 2020-2024
- エンドユーザーセグメント分析 2020-2024
- 製品セグメント分析 2020-2024
- 流通チャネルセグメント分析 2020-2024
- 地域別セグメント分析 2020-2024
- 国別セグメント分析 2020-2024
第6章 定性分析
- AIが与える影響世界の軟水器市場
第7章 ファイブフォース分析
- ファイブフォースの要約
- 買い手の交渉力
- 供給企業の交渉力
- 新規参入業者の脅威
- 代替品の脅威
- 競争の脅威
- 市況
第8章 市場セグメンテーション:エンドユーザー別
- 比較:エンドユーザー別
- 住宅用
- 商業用
- 市場機会:エンドユーザー別
第9章 市場セグメンテーション:製品別
- 比較:製品別
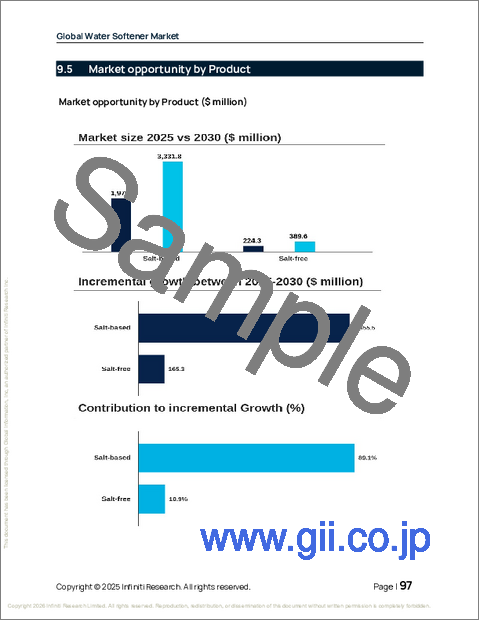
- 塩分含有製品
- 無塩
- 市場機会:製品別
第10章 市場セグメンテーション:流通チャネル別
- 比較:流通チャネル別
- オフライン
- オンライン
- 市場機会:流通チャネル別
第11章 顧客情勢
第12章 地域別情勢
- 地域別セグメンテーション
- 地域別比較
- 北米
- 米国
- カナダ
- メキシコ
- 欧州
- ドイツ
- 英国
- フランス
- イタリア
- スペイン
- オランダ
- アジア太平洋
- 中国
- 日本
- インド
- 韓国
- オーストラリア
- インドネシア
- 南米
- ブラジル
- アルゼンチン
- コロンビア
- 中東・アフリカ
- サウジアラビア
- アラブ首長国連邦
- 南アフリカ
- イスラエル
- トルコ
- 市場機会:地域別
第13章 促進要因・課題・機会
- 市場促進要因
- 市場の課題
- 促進要因と課題の影響
- 市場機会
第14章 競合情勢
- 概要
- 競合情勢
- 混乱の状況
- 業界のリスク
第15章 競合分析
- 企業プロファイル
- 企業ランキング指標
- 企業の市場ポジショニング
- 3M Co.
- A. O. Smith Corp.
- BWT Holding GmbH
- Canature Water Group
- Coway Co. Ltd.
- Culligan International Co.
- Grundfos Holding AS
- Ion Exchange India Ltd.
- Kinetico Inc.
- Marlo Inc.
- Marmon Holdings Inc.
- Pentair Plc
- Puretec Pty Ltd.
- Watts Water Technologies Inc.
- Whirlpool Corp.

