|
|
市場調査レポート
商品コード
1911293
住宅用配管の世界市場、2026年~2030年Global Residential Plumbing Market 2026-2030 |
||||||

|
|||||||
カスタマイズ可能
|
|||||||

| 住宅用配管の世界市場、2026年~2030年 |
|
出版日: 2026年01月14日
発行: TechNavio
ページ情報: 英文 293 Pages
納期: 即納可能
|

概要
世界の住宅用配管市場は、2025年から2030年の間に289億9,360万米ドルの成長が見込まれ、予測期間中のCAGRは5.0%と予測されています。
本報告書では、世界の住宅用配管市場に関する包括的な分析、市場規模と予測、動向、成長要因、課題に加え、約25社のベンダー分析を提供しています。
本レポートは、現在の市場状況、最新の動向と促進要因、市場環境全般に関する最新の分析を提供します。市場は、世界の住宅建築数の増加、節水型配管に対する政府支援の拡大、節水意識の高まりによって牽引されています。
本調査は、業界の主要関係者からの情報を含む、一次情報と二次情報の客観的な組み合わせを用いて実施されました。本レポートには、主要企業の分析に加え、包括的な市場規模データ、地域別分析を伴うセグメント、ベンダー情勢が含まれています。レポートには過去データと予測データが掲載されています。
| 市場範囲 | |
|---|---|
| 基準年 | 2026年 |
| 終了年 | 2030年 |
| 予測期間 | 2026年~2030年 |
| 成長モメンタム | 加速 |
| 前年比2026年 | 4.8% |
| CAGR | 5% |
| 増分額 | 289億9,360万米ドル |
本調査では、環境に優しい配管ソリューションの登場が、今後数年間における世界の住宅用配管市場成長を牽引する主要な要因の一つであると特定しています。また、配管機器とIoTの統合、ならびにプレハブ住宅やモジュール式住宅への需要増加が、市場において相当な需要を生み出すものと見込まれます。
目次
第1章 エグゼクティブサマリー
第2章 Technavio分析
- 価格反応性・ライフサイクル・顧客購入バスケット・採用率・購入基準の分析
- インプットの重要性と差別化の要因
- 混乱の要因
- 促進要因と課題の影響
第3章 市場情勢
- 市場エコシステム
- 市場の特徴
- バリューチェーン分析
第4章 市場規模
- 市場の定義
- 市場セグメント分析
- 市場規模、2025年
- 市場の見通し、2025年~2030年
第5章 市場規模実績
- 世界の住宅用配管市場、2020年~2024年
- 継手セグメント分析、2020年~2024年
- 製品セグメント分析、2020年~2024年
- 設置タイプセグメント分析、2020年~2024年
- 地域別セグメント分析、2020年~2024年
- 国別セグメント分析、2020年~2024年
第6章 定性分析
- 世界の住宅用配管市場へのAIの影響
第7章 ファイブフォース分析
- ファイブフォースの要約
- 買い手の交渉力
- 供給企業の交渉力
- 新規参入業者の脅威
- 代替品の脅威
- 競争の脅威
- 市況
第8章 市場セグメンテーション:継手別
- 比較:継手別
- 改修・アップグレード
- 新規設置
- 市場機会:継手別
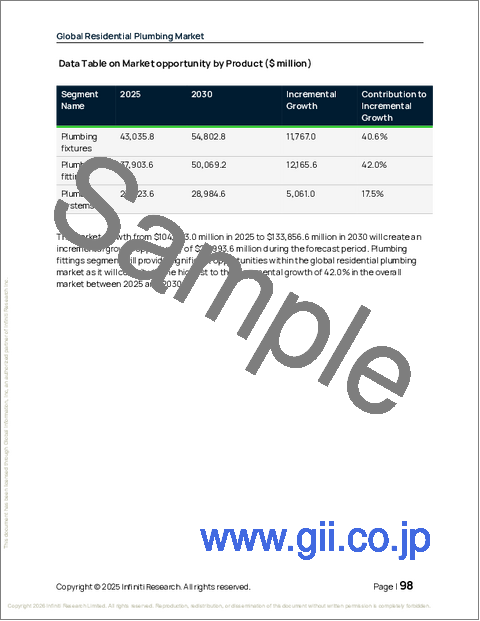
第9章 市場セグメンテーション:製品別
- 比較:製品別
- 水回り設備
- 配管継手
- 配管システム
- 市場機会:製品別
第10章 市場セグメンテーション:設置タイプ別
- 比較:設置タイプ別
- 新築
- 改修
- 修理・保守
- 市場機会:設置タイプ別
第11章 顧客情勢
第12章 地域別情勢
- 地域別セグメンテーション
- 地域別比較
- アジア太平洋地域
- 中国
- インド
- 日本
- 韓国
- オーストラリア
- インドネシア
- 北米
- 米国
- カナダ
- メキシコ
- 欧州
- ドイツ
- イギリス
- フランス
- イタリア
- スペイン
- オランダ
- 南米
- ブラジル
- アルゼンチン
- コロンビア
- 中東・アフリカ
- サウジアラビア
- UAE
- 南アフリカ
- イスラエル
- トルコ
- 市場機会:地域別
第13章 促進要因、課題、機会
- 市場促進要因
- 市場の課題
- 促進要因と課題の影響
- 市場機会
第14章 競合情勢
- 概要
- 競合情勢
- 混乱の状況
- 業界のリスク
第15章 競合分析
- 企業プロファイル
- 企業ランキング指標
- 企業の市場ポジショニング
- Astral Ltd.
- Bradford White Corp.
- COLSTON
- Elkay Manufacturing Co.
- Geberit International AG
- Globe Union Industrial Corp.
- Kohler Co.
- LIXIL Corp.
- Masco Corp.
- Moen Inc.
- Rheem Manufacturing Co.
- RWDI
- The Supreme Industries Ltd.
- Toto Ltd.
- Uponor Corp.

