|
|
市場調査レポート
商品コード
1908395
世界のエラストマーコーティング生地市場2026-2030年Global Elastomer Coated Fabric Market 2026-2030 |
||||||
|
|||||||
カスタマイズ可能
|
|||||||

| 世界のエラストマーコーティング生地市場2026-2030年 |
|
出版日: 2026年01月14日
発行: TechNavio
ページ情報: 英文 308 Pages
納期: 即納可能
|

概要
世界のエラストマーコーティング布市場は、2025年から2030年の間に28億2,710万米ドルの成長が見込まれ、予測期間中のCAGRは4.6%と予測されています。
本報告書では、世界のエラストマーコーティング布市場に関する包括的な分析、市場規模と予測、動向、成長要因、課題に加え、約25社のベンダー分析を提供しております。
本レポートは、現在の市場状況、最新の動向と促進要因、市場環境全般に関する最新の分析を提供します。市場は、航空宇宙および重要インフラ能力への戦略的投資、医療分野における持続可能性と感染管理の融合、産業特化のための企業再編と財務基盤強化によって牽引されています。
本調査は、業界の主要関係者からの情報を含む一次情報と二次情報を客観的に組み合わせて実施されました。本レポートには、主要企業の分析に加え、包括的な市場規模データ、地域別分析を伴うセグメント、ベンダー情勢が含まれています。レポートには過去データと予測データが掲載されています。
| 市場範囲 | |
|---|---|
| 基準年 | 2026年 |
| 終了年 | 2030年 |
| 予測期間 | 2026-2030 |
| 成長モメンタム | 加速 |
| 前年比2026年 | 4.4% |
| CAGR | 4.6% |
| 増分額 | 28億2,710万米ドル |
本調査では、医療用および技術用繊維製品への循環型経済原則の統合が、今後数年間における世界のエラストマーコーティング生地市場の成長を牽引する主要な要因の一つであると特定しております。また、戦略的な企業再編と産業用途における専門化、ならびに重要インフラおよび航空宇宙分野における国内製造能力の拡大が、市場における相当な需要を生み出すものと見込まれます。
目次
第1章 エグゼクティブサマリー
- 市場概要
第2章 Technavio分析
- 価格・ライフサイクル・顧客購入バスケット・採用率・購入基準の分析
- インプットの重要性と差別化の要因
- 混乱の要因
- 促進要因と課題の影響
第3章 市場情勢
- 市場エコシステム
- 市場の特徴
- バリューチェーン分析
第4章 市場規模
- 市場の定義
- 市場セグメント分析
- 市場規模 2025
- 市場の見通し 2025-2030
第5章 市場規模実績
- 世界のエラストマーコーティング生地市場 2020-2024
- 用途別セグメント分析 2020-2024
- 製品セグメント分析 2020-2024
- 流通チャネルセグメント分析 2020-2024
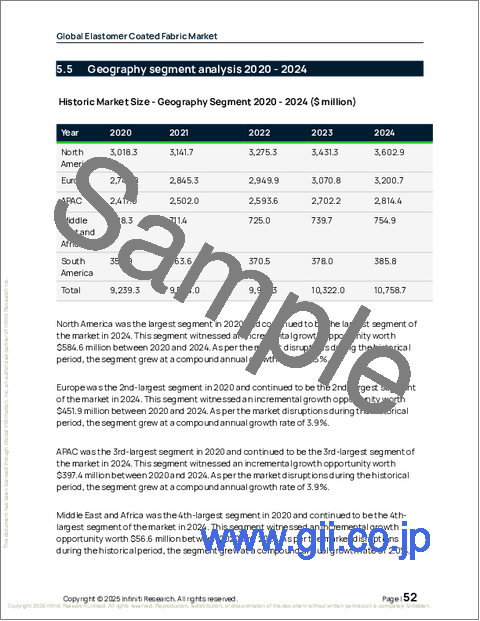
- 地域別セグメント分析 2020-2024
- 国別セグメント分析 2020-2024
第6章 定性分析
- AIが及ぼす影響世界のエラストマーコーティング生地市場
第7章 ファイブフォース分析
- ファイブフォースの要約
- 買い手の交渉力
- 供給企業の交渉力
- 新規参入業者の脅威
- 代替品の脅威
- 競争の脅威
- 市況
第8章 市場セグメンテーション:用途別
- 市場セグメント
- 比較:用途別
- 交通機関:市場規模と予測 2025-2030
- 防護服:市場規模と予測 2025-2030
- 産業用:市場規模と予測 2025-2030
- その他:市場規模と予測 2025-2030
- 市場機会:用途別
第9章 市場セグメンテーション:製品別
- 市場セグメント
- 比較:製品別
- シリコーン:市場規模と予測 2025-2030
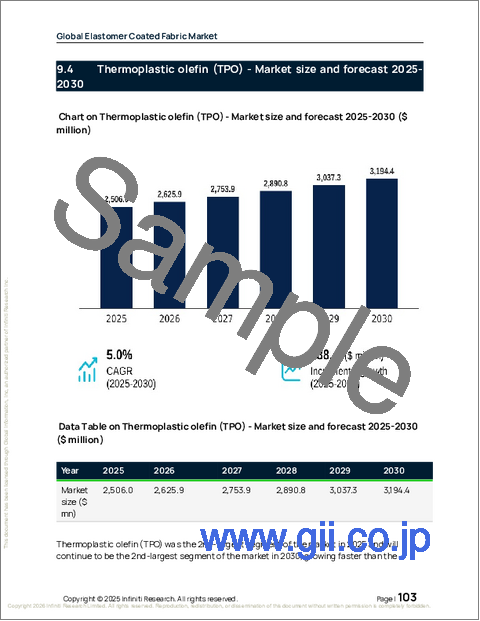
- 熱可塑性オレフィン(TPO):市場規模と予測 2025-2030
- ゴム:市場規模と予測 2025-2030
- 熱可塑性ポリウレタン(TPU):市場規模と予測 2025-2030
- その他:市場規模と予測 2025-2030
- 市場機会:製品別
第10章 市場セグメンテーション:流通チャネル別
- 市場セグメント
- 比較:流通チャネル別
- 直接販売:市場規模と予測 2025-2030
- 小売販売:市場規模と予測 2025-2030
- 卸売流通:市場規模と予測 2025-2030
- オンライン販売:市場規模と予測 2025-2030
- 専門店:市場規模と予測 2025-2030
- 市場機会:流通チャネル別
第11章 顧客情勢
- 顧客情勢の概要
第12章 地域別情勢
- 地域別セグメンテーション
- 地域別比較
- 北米:市場規模と予測 2025-2030
- 欧州:市場規模と予測 2025-2030
- アジア太平洋:市場規模と予測 2025-2030
- 中東・アフリカ:市場規模と予測 2025-2030
- 南米:市場規模と予測 2025-2030
- 市場機会:地域別
第13章 促進要因、課題、および機会
- 市場促進要因
- 市場の課題
- 促進要因と課題の影響
- 市場機会
第14章 競合情勢
- 概要
- 競合情勢
- 混乱の状況
- 業界のリスク
第15章 競合分析
- 企業プロファイル
- 企業ランキング指標
- 企業の市場ポジショニング
- Auburn Manufacturing Inc.
- Chemprene Inc.
- Compagnie de Saint Gobain SA
- Continental AG
- Fabri Cote
- Kiran Rubber Industries Pvt Ltd
- Mehler Texnologies Gmbh
- Mid Mountain Materials Inc.
- Morbern Inc.
- OMNOVA Solutions Inc.
- Seaman Corp.
- Serge Ferrari SAS
- Sioen Industries NV
- Spradling International GmbH
- Trelleborg AB

