|
|
市場調査レポート
商品コード
1908401
航空機用塗料の世界市場、2026年~2030年Global Aircraft Paint Market 2026-2030 |
||||||
|
|||||||
カスタマイズ可能
|
|||||||

| 航空機用塗料の世界市場、2026年~2030年 |
|
出版日: 2026年01月14日
発行: TechNavio
ページ情報: 英文 295 Pages
納期: 即納可能
|

概要
世界の航空機用塗料市場は、2025年から2030年にかけて2億1,150万米ドルの成長が見込まれ、予測期間中のCAGRは4.7%と予測されています。
本報告書では、世界の航空機用塗料市場に関する包括的な分析、市場規模と予測、動向、成長要因、課題に加え、約25社のベンダー分析を提供しています。
本レポートは、現在の市場状況、最新の市場動向と促進要因、市場環境全般に関する最新の分析を提供します。市場は、世界の航空機フリートの持続的な拡大と堅調なMRO活動、現代航空機設計における複合材料の採用増加、継続的な技術進歩、そして高性能で機能的なコーティングに対するエンドユーザーの需要によって牽引されています。
本調査は、業界の主要関係者からの情報を含む、一次情報と二次情報の客観的な組み合わせを用いて実施されました。本レポートには、主要企業の分析に加え、包括的な市場規模データ、地域別分析を伴うセグメント、ベンダー情勢が含まれています。レポートには過去データと予測データが掲載されています。
| 市場範囲 | |
|---|---|
| 基準年 | 2026年 |
| 終了年 | 2030年 |
| 予測期間 | 2026年~2030年 |
| 成長モメンタム | 加速 |
| 前年比2026年 | 4.5% |
| CAGR | 4.7% |
| 増分額 | 2億1,150万米ドル |
本調査では、今後数年間における世界の航空機用塗料市場の成長を牽引する主な要因の一つとして、エコ効率性と持続可能性を重視したコーティングシステムへの移行が顕著である点を指摘しています。また、航空機の性能向上を目的とした多機能コーティングの普及、ならびに塗布効率の向上と航空機のダウンタイム削減への注力の強化が、市場における相当な需要創出につながると見込まれます。
目次
第1章 エグゼクティブサマリー
- 市場概要
第2章 Technavio分析
- 価格反応性・ライフサイクル・顧客購入バスケット・採用率・購入基準の分析
- インプットの重要性と差別化の要因
- 混乱の要因
- 促進要因と課題の影響
第3章 市場情勢
- 市場エコシステム
- 市場の特徴
- バリューチェーン分析
第4章 市場規模
- 市場の定義
- 市場セグメント分析
- 市場規模、2025年
- 市場の見通し、2025年~2030年
第5章 市場規模実績
- 世界の航空機用塗料市場、2020年~2024年
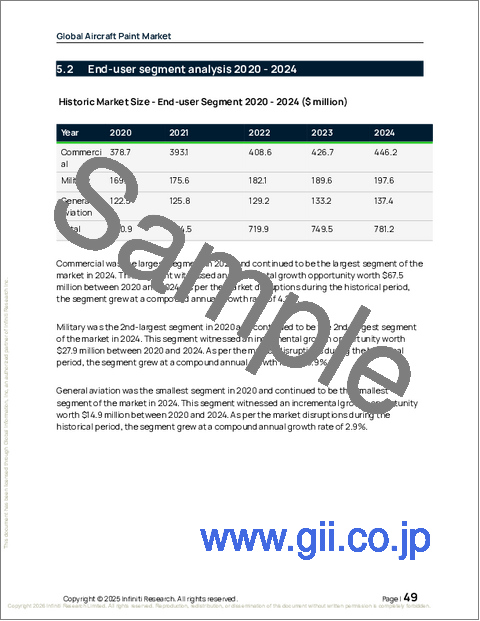
- エンドユーザーセグメント分析、2020年~2024年
- タイプセグメント分析、2020年~2024年
- 用途別セグメント分析、2020年~2024年
- 地域別セグメント分析、2020年~2024年
- 国別セグメント分析、2020年~2024年
第6章 定性分析
- 世界の航空機用塗料市場へのAIの影響
第7章 ファイブフォース分析
- ファイブフォースの要約
- 買い手の交渉力
- 供給企業の交渉力
- 新規参入業者の脅威
- 代替品の脅威
- 競争の脅威
- 市況
第8章 市場セグメンテーション:エンドユーザー別
- 市場セグメント
- 比較:エンドユーザー別
- 商業:市場規模と予測、2025年~2030年
- 軍事:市場規模と予測、2025年~2030年
- 一般航空:市場規模と予測、2025年~2030年
- 市場機会:エンドユーザー別
第9章 市場セグメンテーション:タイプ別
- 市場セグメント
- 比較:タイプ別
- 液体塗料:市場規模と予測、2025年~2030年
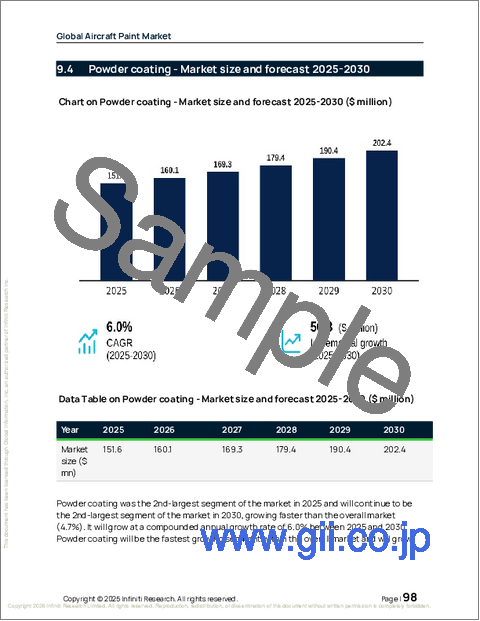
- 粉体塗料:市場規模と予測、2025年~2030年
- 特殊塗料:市場規模と予測、2025年~2030年
- 市場機会:タイプ別
第10章 市場セグメンテーション:用途別
- 市場セグメント
- 比較:用途別
- 外装用塗料:市場規模と予測、2025年~2030年
- 内装用塗料:市場規模と予測、2025年~2030年
- 市場機会:用途別
第11章 顧客情勢
- 顧客情勢の概要
第12章 地域別情勢
- 地域別セグメンテーション
- 地域別比較
- アジア太平洋地域:市場規模と予測、2025年~2030年
- 欧州:市場規模と予測、2025年~2030年
- 北米:市場規模と予測、2025年~2030年
- 中東・アフリカ:市場規模と予測、2025年~2030年
- 南米:市場規模と予測、2025年~2030年
- 市場機会:地域別
第13章 促進要因、課題、機会
- 市場促進要因
- 市場の課題
- 促進要因と課題の影響
- 市場機会
第14章 競合情勢
- 概要
- 競合情勢
- 混乱の状況
- 業界のリスク
第15章 競合分析
- 企業プロファイル
- 企業ランキング指数
- 企業の市場ポジショニング
- 3M Co.
- Akzo Nobel NV
- APS Materials Inc.
- Axalta Coating Systems Ltd.
- BASF SE
- Chromalloy Gas Turbine LLC
- DuPont de Nemours Inc.
- Henkel AG and Co. KGaA
- Hentzen Coatings Inc.
- Ionbond
- Linde Plc
- Mankiewicz Gebr. and Co.
- OC Oerlikon Corp.
- PPG Industries Inc.
- The Sherwin Williams Co.

