|
|
市場調査レポート
商品コード
1580823
業務用食器洗い機の世界市場 (2024~2028年)Global Commercial Dishwasher Market 2024-2028 |
||||||

|
|||||||
カスタマイズ可能
|
|||||||


| 業務用食器洗い機の世界市場 (2024~2028年) |
|
出版日: 2024年10月17日
発行: TechNavio
ページ情報: 英文 175 Pages
納期: 即納可能
|

全表示
- 概要
- 図表
- 目次
業務用食器洗い機市場 (2024~2028年)
業務用食器洗い機市場は2023年から2028年に4億5,100万米ドル分拡大し、予測期間中に3.1%のCAGRで成長すると予測されます。当レポートでは、業務用食器洗い機市場の全体的な分析、市場規模・予測、動向、成長促進要因、課題、約25社のベンダーを網羅したベンダー分析などを掲載しています。
当レポートでは、現在の市場シナリオ、最新動向と促進要因、市場環境全体に関する最新分析を提供しています。市場は、技術・性能・機能・デザイン・搭載能力などの製品革新、エンドユーザーによる市場拡大、エネルギー効率の高いモデルに対する需要の高まりによって牽引されています。
| 市場範囲 | |
|---|---|
| 基準年 | 2024年 |
| 終了年 | 2028年 |
| 予測期間 | 2024~2028年 |
| 成長モメンタム | 加速 |
| 前年比 (2024年) | 3% |
| CAGR | 3.1% |
| 増分額 | 4億5,100万米ドル |
当レポートでは、今後数年間の業務用食器洗い機市場の成長を促進する主な要因の1つとして、ディスプレイを改善した機器に対する需要の増加を挙げています。また、エネルギー回収能力が向上した機器の利用可能性が高まり、より優れた水濾過システムを備えた機器の利用可能性が高まっていることも、市場の大きな需要につながります。
目次
第1章 エグゼクティブサマリー
- 市場概要
第2章 市場情勢
- 市場エコシステム
- 市場の特徴
- バリューチェーン分析
第3章 市場規模の評価
- 市場の定義
- 市場セグメント分析
- 市場規模 (2023年)
- 市場の見通し (2023~2028年)
第4章 市場規模実績
- 業務用食器洗い機の世界市場 (2018~2022年)
- 製品別分析 (2018~2022年)
- エンドユーザー別分析 (2018~2022年)
- 地域別分析 (2018~2022年)
- 国別分析 (2018~2022年)
第5章 ファイブフォース分析
- ファイブフォースの要約
- 買い手の交渉力
- 供給企業の交渉力
- 新規参入業者の脅威
- 代替品の脅威
- 競争の脅威
- 市況
第6章 市場セグメンテーション:製品別
- 市場セグメンテーション
- 比較:製品別
- 業務用・ドア型:市場規模と予測 (2023~2028年)
- 業務用・カウンター下型:市場規模と予測 (2023~2028年)
- 業務用・コンベア式:市場規模と予測 (2023~2028年)
- 商業飛行タイプ:市場規模と予測 (2023~2028年)
- 製品別の市場機会
第7章 市場セグメンテーション:エンドユーザー別
- 市場セグメンテーション
- 比較:エンドユーザー別
- 飲食店:市場規模と予測 (2023~2028年)
- ホテル:市場規模と予測 (2023~2028年)
- その他:市場規模と予測 (2023~2028年)
- エンドユーザー別の市場機会
第8章 顧客情勢
- 顧客情勢の概要
第9章 地域別情勢
- 地域別セグメンテーション
- 地域別比較
- 北米:市場規模と予測 (2023~2028年)
- 欧州:市場規模と予測 (2023~2028年)
- アジア太平洋:市場規模と予測 (2023~2028年)
- 南米:市場規模と予測 (2023~2028年)
- 中東・アフリカ:市場規模と予測 (2023~2028年)
- 米国:市場規模と予測 (2023~2028年)
- 中国:市場規模と予測 (2023~2028年)
- ドイツ:市場規模と予測 (2023~2028年)
- カナダ:市場規模と予測 (2023~2028年)
- フランス:市場規模と予測 (2023~2028年)
- 地域情勢別市場機会
第10章 促進要因・課題・機会・抑制要因
- 市場促進要因
- 市場の課題
- 促進要因と課題の影響
- 市場の機会・抑制要因
第11章 競合情勢
- 概要
- 競合情勢
- 混乱の状況
- 業界のリスク
第12章 競合分析
- 企業プロファイル
- 企業の市場ポジショニング
- Ali Group S.r.l.
- Blakeslee Inc.
- Electrolux Professional AB
- Fagor Industrial S. Coop
- IFB Appliances
- Insinger Machine Co.
- ITW Food Equipment Group
- Jackson WWS Inc.
- JLA Ltd.
- MEIKO Maschinenbau GmbH and Co. KG
- Miele and Cie. KG
- MVP Group Corp.
- Robert Bosch GmbH
- TEIKOS Srl
- Whirlpool Corp.
第13章 付録
Exhibits:
- Exhibits1: Executive Summary - Chart on Market Overview
- Exhibits2: Executive Summary - Data Table on Market Overview
- Exhibits3: Executive Summary - Chart on Global Market Characteristics
- Exhibits4: Executive Summary - Chart on Market By Geographical Landscape
- Exhibits5: Executive Summary - Chart on Market Segmentation by Product
- Exhibits6: Executive Summary - Chart on Market Segmentation by End-user
- Exhibits7: Executive Summary - Chart on Incremental Growth
- Exhibits8: Executive Summary - Data Table on Incremental Growth
- Exhibits9: Executive Summary - Chart on Company Market Positioning
- Exhibits10: Parent Market
- Exhibits11: Data Table on - Parent Market
- Exhibits12: Market characteristics analysis
- Exhibits13: Value Chain Analysis
- Exhibits14: Offerings of companies included in the market definition
- Exhibits15: Market segments
- Exhibits16: Chart on Global - Market size and forecast 2023-2028 ($ million)
- Exhibits17: Data Table on Global - Market size and forecast 2023-2028 ($ million)
- Exhibits18: Chart on Global Market: Year-over-year growth 2023-2028 (%)
- Exhibits19: Data Table on Global Market: Year-over-year growth 2023-2028 (%)
- Exhibits20: Historic Market Size - Data Table on Global Commercial Dishwasher Market 2018 - 2022 ($ million)
- Exhibits21: Historic Market Size - Product Segment 2018 - 2022 ($ million)
- Exhibits22: Historic Market Size - End-user Segment 2018 - 2022 ($ million)
- Exhibits23: Historic Market Size - Geography Segment 2018 - 2022 ($ million)
- Exhibits24: Historic Market Size - Country Segment 2018 - 2022 ($ million)
- Exhibits25: Five forces analysis - Comparison between 2023 and 2028
- Exhibits26: Bargaining power of buyers - Impact of key factors 2023 and 2028
- Exhibits27: Bargaining power of suppliers - Impact of key factors in 2023 and 2028
- Exhibits28: Threat of new entrants - Impact of key factors in 2023 and 2028
- Exhibits29: Threat of substitutes - Impact of key factors in 2023 and 2028
- Exhibits30: Threat of rivalry - Impact of key factors in 2023 and 2028
- Exhibits31: Chart on Market condition - Five forces 2023 and 2028
- Exhibits32: Chart on Product - Market share 2023-2028 (%)
- Exhibits33: Data Table on Product - Market share 2023-2028 (%)
- Exhibits34: Chart on Comparison by Product
- Exhibits35: Data Table on Comparison by Product
- Exhibits36: Chart on Commercial door type - Market size and forecast 2023-2028 ($ million)
- Exhibits37: Data Table on Commercial door type - Market size and forecast 2023-2028 ($ million)
- Exhibits38: Chart on Commercial door type - Year-over-year growth 2023-2028 (%)
- Exhibits39: Data Table on Commercial door type - Year-over-year growth 2023-2028 (%)
- Exhibits40: Chart on Commercial under counter - Market size and forecast 2023-2028 ($ million)
- Exhibits41: Data Table on Commercial under counter - Market size and forecast 2023-2028 ($ million)
- Exhibits42: Chart on Commercial under counter - Year-over-year growth 2023-2028 (%)
- Exhibits43: Data Table on Commercial under counter - Year-over-year growth 2023-2028 (%)
- Exhibits44: Chart on Commercial conveyor - Market size and forecast 2023-2028 ($ million)
- Exhibits45: Data Table on Commercial conveyor - Market size and forecast 2023-2028 ($ million)
- Exhibits46: Chart on Commercial conveyor - Year-over-year growth 2023-2028 (%)
- Exhibits47: Data Table on Commercial conveyor - Year-over-year growth 2023-2028 (%)
- Exhibits48: Chart on Commercial flight type - Market size and forecast 2023-2028 ($ million)
- Exhibits49: Data Table on Commercial flight type - Market size and forecast 2023-2028 ($ million)
- Exhibits50: Chart on Commercial flight type - Year-over-year growth 2023-2028 (%)
- Exhibits51: Data Table on Commercial flight type - Year-over-year growth 2023-2028 (%)
- Exhibits52: Market opportunity by Product ($ million)
- Exhibits53: Data Table on Market opportunity by Product ($ million)
- Exhibits54: Chart on End-user - Market share 2023-2028 (%)
- Exhibits55: Data Table on End-user - Market share 2023-2028 (%)
- Exhibits56: Chart on Comparison by End-user
- Exhibits57: Data Table on Comparison by End-user
- Exhibits58: Chart on Eateries and restaurants - Market size and forecast 2023-2028 ($ million)
- Exhibits59: Data Table on Eateries and restaurants - Market size and forecast 2023-2028 ($ million)
- Exhibits60: Chart on Eateries and restaurants - Year-over-year growth 2023-2028 (%)
- Exhibits61: Data Table on Eateries and restaurants - Year-over-year growth 2023-2028 (%)
- Exhibits62: Chart on Hotel - Market size and forecast 2023-2028 ($ million)
- Exhibits63: Data Table on Hotel - Market size and forecast 2023-2028 ($ million)
- Exhibits64: Chart on Hotel - Year-over-year growth 2023-2028 (%)
- Exhibits65: Data Table on Hotel - Year-over-year growth 2023-2028 (%)
- Exhibits66: Chart on Others - Market size and forecast 2023-2028 ($ million)
- Exhibits67: Data Table on Others - Market size and forecast 2023-2028 ($ million)
- Exhibits68: Chart on Others - Year-over-year growth 2023-2028 (%)
- Exhibits69: Data Table on Others - Year-over-year growth 2023-2028 (%)
- Exhibits70: Market opportunity by End-user ($ million)
- Exhibits71: Data Table on Market opportunity by End-user ($ million)
- Exhibits72: Analysis of price sensitivity, lifecycle, customer purchase basket, adoption rates, and purchase criteria
- Exhibits73: Chart on Market share By Geographical Landscape 2023-2028 (%)
- Exhibits74: Data Table on Market share By Geographical Landscape 2023-2028 (%)
- Exhibits75: Chart on Geographic comparison
- Exhibits76: Data Table on Geographic comparison
- Exhibits77: Chart on North America - Market size and forecast 2023-2028 ($ million)
- Exhibits78: Data Table on North America - Market size and forecast 2023-2028 ($ million)
- Exhibits79: Chart on North America - Year-over-year growth 2023-2028 (%)
- Exhibits80: Data Table on North America - Year-over-year growth 2023-2028 (%)
- Exhibits81: Chart on Europe - Market size and forecast 2023-2028 ($ million)
- Exhibits82: Data Table on Europe - Market size and forecast 2023-2028 ($ million)
- Exhibits83: Chart on Europe - Year-over-year growth 2023-2028 (%)
- Exhibits84: Data Table on Europe - Year-over-year growth 2023-2028 (%)
- Exhibits85: Chart on APAC - Market size and forecast 2023-2028 ($ million)
- Exhibits86: Data Table on APAC - Market size and forecast 2023-2028 ($ million)
- Exhibits87: Chart on APAC - Year-over-year growth 2023-2028 (%)
- Exhibits88: Data Table on APAC - Year-over-year growth 2023-2028 (%)
- Exhibits89: Chart on South America - Market size and forecast 2023-2028 ($ million)
- Exhibits90: Data Table on South America - Market size and forecast 2023-2028 ($ million)
- Exhibits91: Chart on South America - Year-over-year growth 2023-2028 (%)
- Exhibits92: Data Table on South America - Year-over-year growth 2023-2028 (%)
- Exhibits93: Chart on Middle East and Africa - Market size and forecast 2023-2028 ($ million)
- Exhibits94: Data Table on Middle East and Africa - Market size and forecast 2023-2028 ($ million)
- Exhibits95: Chart on Middle East and Africa - Year-over-year growth 2023-2028 (%)
- Exhibits96: Data Table on Middle East and Africa - Year-over-year growth 2023-2028 (%)
- Exhibits97: Chart on US - Market size and forecast 2023-2028 ($ million)
- Exhibits98: Data Table on US - Market size and forecast 2023-2028 ($ million)
- Exhibits99: Chart on US - Year-over-year growth 2023-2028 (%)
- Exhibits100: Data Table on US - Year-over-year growth 2023-2028 (%)
- Exhibits101: Chart on China - Market size and forecast 2023-2028 ($ million)
- Exhibits102: Data Table on China - Market size and forecast 2023-2028 ($ million)
- Exhibits103: Chart on China - Year-over-year growth 2023-2028 (%)
- Exhibits104: Data Table on China - Year-over-year growth 2023-2028 (%)
- Exhibits105: Chart on Germany - Market size and forecast 2023-2028 ($ million)
- Exhibits106: Data Table on Germany - Market size and forecast 2023-2028 ($ million)
- Exhibits107: Chart on Germany - Year-over-year growth 2023-2028 (%)
- Exhibits108: Data Table on Germany - Year-over-year growth 2023-2028 (%)
- Exhibits109: Chart on Canada - Market size and forecast 2023-2028 ($ million)
- Exhibits110: Data Table on Canada - Market size and forecast 2023-2028 ($ million)
- Exhibits111: Chart on Canada - Year-over-year growth 2023-2028 (%)
- Exhibits112: Data Table on Canada - Year-over-year growth 2023-2028 (%)
- Exhibits113: Chart on France - Market size and forecast 2023-2028 ($ million)
- Exhibits114: Data Table on France - Market size and forecast 2023-2028 ($ million)
- Exhibits115: Chart on France - Year-over-year growth 2023-2028 (%)
- Exhibits116: Data Table on France - Year-over-year growth 2023-2028 (%)
- Exhibits117: Market opportunity By Geographical Landscape ($ million)
- Exhibits118: Data Tables on Market opportunity By Geographical Landscape ($ million)
- Exhibits119: Impact of drivers and challenges in 2023 and 2028
- Exhibits120: Overview on criticality of inputs and factors of differentiation
- Exhibits121: Overview on factors of disruption
- Exhibits122: Impact of key risks on business
- Exhibits123: Companies covered
- Exhibits124: Matrix on companies position and classification
- Exhibits125: Ali Group S.r.l. - Overview
- Exhibits126: Ali Group S.r.l. - Product / Service
- Exhibits127: Ali Group S.r.l. - Key offerings
- Exhibits128: Blakeslee Inc. - Overview
- Exhibits129: Blakeslee Inc. - Product / Service
- Exhibits130: Blakeslee Inc. - Key offerings
- Exhibits131: Electrolux Professional AB - Overview
- Exhibits132: Electrolux Professional AB - Business segments
- Exhibits133: Electrolux Professional AB - Key news
- Exhibits134: Electrolux Professional AB - Key offerings
- Exhibits135: Electrolux Professional AB - Segment focus
- Exhibits136: Fagor Industrial S. Coop - Overview
- Exhibits137: Fagor Industrial S. Coop - Product / Service
- Exhibits138: Fagor Industrial S. Coop - Key offerings
- Exhibits139: IFB Appliances - Overview
- Exhibits140: IFB Appliances - Product / Service
- Exhibits141: IFB Appliances - Key offerings
- Exhibits142: Insinger Machine Co. - Overview
- Exhibits143: Insinger Machine Co. - Product / Service
- Exhibits144: Insinger Machine Co. - Key offerings
- Exhibits145: ITW Food Equipment Group - Overview
- Exhibits146: ITW Food Equipment Group - Product / Service
- Exhibits147: ITW Food Equipment Group - Key offerings
- Exhibits148: Jackson WWS Inc. - Overview
- Exhibits149: Jackson WWS Inc. - Product / Service
- Exhibits150: Jackson WWS Inc. - Key offerings
- Exhibits151: JLA Ltd. - Overview
- Exhibits152: JLA Ltd. - Product / Service
- Exhibits153: JLA Ltd. - Key offerings
- Exhibits154: MEIKO Maschinenbau GmbH and Co. KG - Overview
- Exhibits155: MEIKO Maschinenbau GmbH and Co. KG - Product / Service
- Exhibits156: MEIKO Maschinenbau GmbH and Co. KG - Key offerings
- Exhibits157: Miele and Cie. KG - Overview
- Exhibits158: Miele and Cie. KG - Product / Service
- Exhibits159: Miele and Cie. KG - Key offerings
- Exhibits160: MVP Group Corp. - Overview
- Exhibits161: MVP Group Corp. - Product / Service
- Exhibits162: MVP Group Corp. - Key offerings
- Exhibits163: Robert Bosch GmbH - Overview
- Exhibits164: Robert Bosch GmbH - Product / Service
- Exhibits165: Robert Bosch GmbH - Key news
- Exhibits166: Robert Bosch GmbH - Key offerings
- Exhibits167: TEIKOS Srl - Overview
- Exhibits168: TEIKOS Srl - Product / Service
- Exhibits169: TEIKOS Srl - Key offerings
- Exhibits170: Whirlpool Corp. - Overview
- Exhibits171: Whirlpool Corp. - Business segments
- Exhibits172: Whirlpool Corp. - Key news
- Exhibits173: Whirlpool Corp. - Key offerings
- Exhibits174: Whirlpool Corp. - Segment focus
- Exhibits175: Inclusions checklist
- Exhibits176: Exclusions checklist
- Exhibits177: Currency conversion rates for US$
- Exhibits178: Research methodology
- Exhibits179: Information sources
- Exhibits180: Data validation
- Exhibits181: Validation techniques employed for market sizing
- Exhibits182: Data synthesis
- Exhibits183: 360 degree market analysis
- Exhibits184: List of abbreviations
Commercial Dishwasher Market 2024-2028
The commercial dishwasher market is forecasted to grow by USD 451 mn during 2023-2028, accelerating at a CAGR of 3.1% during the forecast period. The report on the commercial dishwasher market provides a holistic analysis, market size and forecast, trends, growth drivers, and challenges, as well as vendor analysis covering around 25 vendors.
The report offers an up-to-date analysis regarding the current market scenario, the latest trends and drivers, and the overall market environment. The market is driven by product innovation in terms of technology, performance, features, design, and capacity of loading, market expansion by end-users, and growing demand for energy-efficient models.
| Market Scope | |
|---|---|
| Base Year | 2024 |
| End Year | 2028 |
| Series Year | 2024-2028 |
| Growth Momentum | Accelerate |
| YOY 2024 | 3% |
| CAGR | 3.1% |
| Incremental Value | $451 mn |
Technavio's commercial dishwasher market is segmented as below:
By Product
- Commercial door type
- Commercial under counter
- Commercial conveyor
- Commercial flight type
By End-user
- Eateries and restaurants
- Hotel
- Others
By Geographical Landscape
- North America
- Europe
- APAC
- South America
- Middle East and Africa
This study identifies the increasing demand for equipment with improved displays as one of the prime reasons driving the commercial dishwasher market growth during the next few years. Also, growing availability of equipment with better ability to recover energy and increasing availability of equipment with better water filter systems will lead to sizable demand in the market.
The report on the commercial dishwasher market covers the following areas:
- Commercial Dishwasher Market sizing
- Commercial Dishwasher Market forecast
- Commercial Dishwasher Market industry analysis
The robust vendor analysis is designed to help clients improve their market position, and in line with this, this report provides a detailed analysis of several leading commercial dishwasher market vendors that include Ali Group S.r.l., Blakeslee Inc., Electrolux Professional AB, Fagor Industrial S. Coop, IFB Appliances, Insinger Machine Co., ITW Food Equipment Group, Jackson WWS Inc., JLA Ltd., Knight LLC, MEIKO Maschinenbau GmbH and Co. KG, Miele and Cie. KG, MVP Group Corp., Robert Bosch GmbH, Showa Co. Ltd., TEIKOS Srl, Washtech Ltd., Whirlpool Corp., and Winterhalter Gastronom GmbH. Also, the commercial dishwasher market analysis report includes information on upcoming trends and challenges that will influence market growth. This is to help companies strategize and leverage all forthcoming growth opportunities.
The study was conducted using an objective combination of primary and secondary information including inputs from key participants in the industry. The report contains a comprehensive market and vendor landscape in addition to an analysis of the key vendors.
The publisher presents a detailed picture of the market by the way of study, synthesis, and summation of data from multiple sources by an analysis of key parameters such as profit, pricing, competition, and promotions. It presents various market facets by identifying the key industry influencers. The data presented is comprehensive, reliable, and a result of extensive primary and secondary research. The market research reports provide a complete competitive landscape and an in-depth vendor selection methodology and analysis using qualitative and quantitative research to forecast accurate market growth.
Table of Contents
1 Executive Summary
- 1.1 Market overview
- Executive Summary - Chart on Market Overview
- Executive Summary - Data Table on Market Overview
- Executive Summary - Chart on Global Market Characteristics
- Executive Summary - Chart on Market By Geographical Landscape
- Executive Summary - Chart on Market Segmentation by Product
- Executive Summary - Chart on Market Segmentation by End-user
- Executive Summary - Chart on Incremental Growth
- Executive Summary - Data Table on Incremental Growth
- Executive Summary - Chart on Company Market Positioning
2 Market Landscape
- 2.1 Market ecosystem
- Parent Market
- Data Table on - Parent Market
- 2.2 Market characteristics
- Market characteristics analysis
- 2.3 Value chain analysis
- Value Chain Analysis
3 Market Sizing
- 3.1 Market definition
- Offerings of companies included in the market definition
- 3.2 Market segment analysis
- Market segments
- 3.3 Market size 2023
- 3.4 Market outlook: Forecast for 2023-2028
- Chart on Global - Market size and forecast 2023-2028 ($ million)
- Data Table on Global - Market size and forecast 2023-2028 ($ million)
- Chart on Global Market: Year-over-year growth 2023-2028 (%)
- Data Table on Global Market: Year-over-year growth 2023-2028 (%)
4 Historic Market Size
- 4.1 Global Commercial Dishwasher Market 2018 - 2022
- Historic Market Size - Data Table on Global Commercial Dishwasher Market 2018 - 2022 ($ million)
- 4.2 Product segment analysis 2018 - 2022
- Historic Market Size - Product Segment 2018 - 2022 ($ million)
- 4.3 End-user segment analysis 2018 - 2022
- Historic Market Size - End-user Segment 2018 - 2022 ($ million)
- 4.4 Geography segment analysis 2018 - 2022
- Historic Market Size - Geography Segment 2018 - 2022 ($ million)
- 4.5 Country segment analysis 2018 - 2022
- Historic Market Size - Country Segment 2018 - 2022 ($ million)
5 Five Forces Analysis
- 5.1 Five forces summary
- Five forces analysis - Comparison between 2023 and 2028
- 5.2 Bargaining power of buyers
- Bargaining power of buyers - Impact of key factors 2023 and 2028
- 5.3 Bargaining power of suppliers
- Bargaining power of suppliers - Impact of key factors in 2023 and 2028
- 5.4 Threat of new entrants
- Threat of new entrants - Impact of key factors in 2023 and 2028
- 5.5 Threat of substitutes
- Threat of substitutes - Impact of key factors in 2023 and 2028
- 5.6 Threat of rivalry
- Threat of rivalry - Impact of key factors in 2023 and 2028
- 5.7 Market condition
- Chart on Market condition - Five forces 2023 and 2028
6 Market Segmentation by Product
- 6.1 Market segments
- Chart on Product - Market share 2023-2028 (%)
- Data Table on Product - Market share 2023-2028 (%)
- 6.2 Comparison by Product
- Chart on Comparison by Product
- Data Table on Comparison by Product
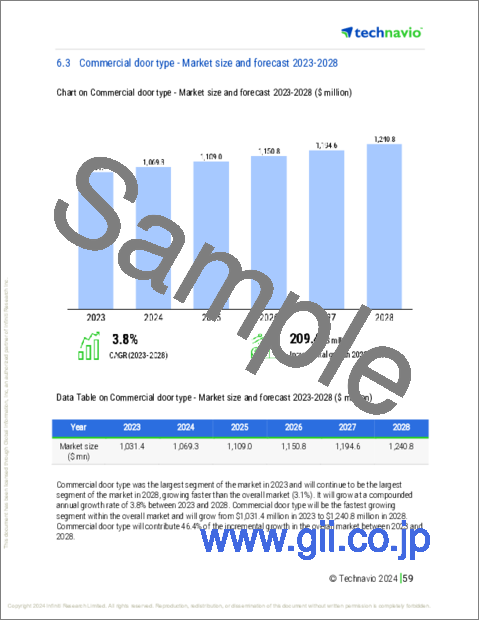
- 6.3 Commercial door type - Market size and forecast 2023-2028
- Chart on Commercial door type - Market size and forecast 2023-2028 ($ million)
- Data Table on Commercial door type - Market size and forecast 2023-2028 ($ million)
- Chart on Commercial door type - Year-over-year growth 2023-2028 (%)
- Data Table on Commercial door type - Year-over-year growth 2023-2028 (%)
- 6.4 Commercial under counter - Market size and forecast 2023-2028
- Chart on Commercial under counter - Market size and forecast 2023-2028 ($ million)
- Data Table on Commercial under counter - Market size and forecast 2023-2028 ($ million)
- Chart on Commercial under counter - Year-over-year growth 2023-2028 (%)
- Data Table on Commercial under counter - Year-over-year growth 2023-2028 (%)
- 6.5 Commercial conveyor - Market size and forecast 2023-2028
- Chart on Commercial conveyor - Market size and forecast 2023-2028 ($ million)
- Data Table on Commercial conveyor - Market size and forecast 2023-2028 ($ million)
- Chart on Commercial conveyor - Year-over-year growth 2023-2028 (%)
- Data Table on Commercial conveyor - Year-over-year growth 2023-2028 (%)
- 6.6 Commercial flight type - Market size and forecast 2023-2028
- Chart on Commercial flight type - Market size and forecast 2023-2028 ($ million)
- Data Table on Commercial flight type - Market size and forecast 2023-2028 ($ million)
- Chart on Commercial flight type - Year-over-year growth 2023-2028 (%)
- Data Table on Commercial flight type - Year-over-year growth 2023-2028 (%)
- 6.7 Market opportunity by Product
- Market opportunity by Product ($ million)
- Data Table on Market opportunity by Product ($ million)
7 Market Segmentation by End-user
- 7.1 Market segments
- Chart on End-user - Market share 2023-2028 (%)
- Data Table on End-user - Market share 2023-2028 (%)
- 7.2 Comparison by End-user
- Chart on Comparison by End-user
- Data Table on Comparison by End-user
- 7.3 Eateries and restaurants - Market size and forecast 2023-2028
- Chart on Eateries and restaurants - Market size and forecast 2023-2028 ($ million)
- Data Table on Eateries and restaurants - Market size and forecast 2023-2028 ($ million)
- Chart on Eateries and restaurants - Year-over-year growth 2023-2028 (%)
- Data Table on Eateries and restaurants - Year-over-year growth 2023-2028 (%)
- 7.4 Hotel - Market size and forecast 2023-2028
- Chart on Hotel - Market size and forecast 2023-2028 ($ million)
- Data Table on Hotel - Market size and forecast 2023-2028 ($ million)
- Chart on Hotel - Year-over-year growth 2023-2028 (%)
- Data Table on Hotel - Year-over-year growth 2023-2028 (%)
- 7.5 Others - Market size and forecast 2023-2028
- Chart on Others - Market size and forecast 2023-2028 ($ million)
- Data Table on Others - Market size and forecast 2023-2028 ($ million)
- Chart on Others - Year-over-year growth 2023-2028 (%)
- Data Table on Others - Year-over-year growth 2023-2028 (%)
- 7.6 Market opportunity by End-user
- Market opportunity by End-user ($ million)
- Data Table on Market opportunity by End-user ($ million)
8 Customer Landscape
- 8.1 Customer landscape overview
- Analysis of price sensitivity, lifecycle, customer purchase basket, adoption rates, and purchase criteria
9 Geographic Landscape
- 9.1 Geographic segmentation
- Chart on Market share By Geographical Landscape 2023-2028 (%)
- Data Table on Market share By Geographical Landscape 2023-2028 (%)
- 9.2 Geographic comparison
- Chart on Geographic comparison
- Data Table on Geographic comparison
- 9.3 North America - Market size and forecast 2023-2028
- Chart on North America - Market size and forecast 2023-2028 ($ million)
- Data Table on North America - Market size and forecast 2023-2028 ($ million)
- Chart on North America - Year-over-year growth 2023-2028 (%)
- Data Table on North America - Year-over-year growth 2023-2028 (%)
- 9.4 Europe - Market size and forecast 2023-2028
- Chart on Europe - Market size and forecast 2023-2028 ($ million)
- Data Table on Europe - Market size and forecast 2023-2028 ($ million)
- Chart on Europe - Year-over-year growth 2023-2028 (%)
- Data Table on Europe - Year-over-year growth 2023-2028 (%)
- 9.5 APAC - Market size and forecast 2023-2028
- Chart on APAC - Market size and forecast 2023-2028 ($ million)
- Data Table on APAC - Market size and forecast 2023-2028 ($ million)
- Chart on APAC - Year-over-year growth 2023-2028 (%)
- Data Table on APAC - Year-over-year growth 2023-2028 (%)
- 9.6 South America - Market size and forecast 2023-2028
- Chart on South America - Market size and forecast 2023-2028 ($ million)
- Data Table on South America - Market size and forecast 2023-2028 ($ million)
- Chart on South America - Year-over-year growth 2023-2028 (%)
- Data Table on South America - Year-over-year growth 2023-2028 (%)
- 9.7 Middle East and Africa - Market size and forecast 2023-2028
- Chart on Middle East and Africa - Market size and forecast 2023-2028 ($ million)
- Data Table on Middle East and Africa - Market size and forecast 2023-2028 ($ million)
- Chart on Middle East and Africa - Year-over-year growth 2023-2028 (%)
- Data Table on Middle East and Africa - Year-over-year growth 2023-2028 (%)
- 9.8 US - Market size and forecast 2023-2028
- Chart on US - Market size and forecast 2023-2028 ($ million)
- Data Table on US - Market size and forecast 2023-2028 ($ million)
- Chart on US - Year-over-year growth 2023-2028 (%)
- Data Table on US - Year-over-year growth 2023-2028 (%)
- 9.9 China - Market size and forecast 2023-2028
- Chart on China - Market size and forecast 2023-2028 ($ million)
- Data Table on China - Market size and forecast 2023-2028 ($ million)
- Chart on China - Year-over-year growth 2023-2028 (%)
- Data Table on China - Year-over-year growth 2023-2028 (%)
- 9.10 Germany - Market size and forecast 2023-2028
- Chart on Germany - Market size and forecast 2023-2028 ($ million)
- Data Table on Germany - Market size and forecast 2023-2028 ($ million)
- Chart on Germany - Year-over-year growth 2023-2028 (%)
- Data Table on Germany - Year-over-year growth 2023-2028 (%)
- 9.11 Canada - Market size and forecast 2023-2028
- Chart on Canada - Market size and forecast 2023-2028 ($ million)
- Data Table on Canada - Market size and forecast 2023-2028 ($ million)
- Chart on Canada - Year-over-year growth 2023-2028 (%)
- Data Table on Canada - Year-over-year growth 2023-2028 (%)
- 9.12 France - Market size and forecast 2023-2028
- Chart on France - Market size and forecast 2023-2028 ($ million)
- Data Table on France - Market size and forecast 2023-2028 ($ million)
- Chart on France - Year-over-year growth 2023-2028 (%)
- Data Table on France - Year-over-year growth 2023-2028 (%)
- 9.13 Market opportunity By Geographical Landscape
- Market opportunity By Geographical Landscape ($ million)
- Data Tables on Market opportunity By Geographical Landscape ($ million)
10 Drivers, Challenges, and Opportunity/Restraints
- 10.1 Market drivers
- 10.2 Market challenges
- 10.3 Impact of drivers and challenges
- Impact of drivers and challenges in 2023 and 2028
- 10.4 Market opportunities/restraints
11 Competitive Landscape
- 11.1 Overview
- 11.2 Competitive Landscape
- Overview on criticality of inputs and factors of differentiation
- 11.3 Landscape disruption
- Overview on factors of disruption
- 11.4 Industry risks
- Impact of key risks on business
12 Competitive Analysis
- 12.1 Companies profiled
- Companies covered
- 12.2 Market positioning of companies
- Matrix on companies position and classification
- 12.3 Ali Group S.r.l.
- Ali Group S.r.l. - Overview
- Ali Group S.r.l. - Product / Service
- Ali Group S.r.l. - Key offerings
- 12.4 Blakeslee Inc.
- Blakeslee Inc. - Overview
- Blakeslee Inc. - Product / Service
- Blakeslee Inc. - Key offerings
- 12.5 Electrolux Professional AB
- Electrolux Professional AB - Overview
- Electrolux Professional AB - Business segments
- Electrolux Professional AB - Key news
- Electrolux Professional AB - Key offerings
- Electrolux Professional AB - Segment focus
- 12.6 Fagor Industrial S. Coop
- Fagor Industrial S. Coop - Overview
- Fagor Industrial S. Coop - Product / Service
- Fagor Industrial S. Coop - Key offerings
- 12.7 IFB Appliances
- IFB Appliances - Overview
- IFB Appliances - Product / Service
- IFB Appliances - Key offerings
- 12.8 Insinger Machine Co.
- Insinger Machine Co. - Overview
- Insinger Machine Co. - Product / Service
- Insinger Machine Co. - Key offerings
- 12.9 ITW Food Equipment Group
- ITW Food Equipment Group - Overview
- ITW Food Equipment Group - Product / Service
- ITW Food Equipment Group - Key offerings
- 12.10 Jackson WWS Inc.
- Jackson WWS Inc. - Overview
- Jackson WWS Inc. - Product / Service
- Jackson WWS Inc. - Key offerings
- 12.11 JLA Ltd.
- JLA Ltd. - Overview
- JLA Ltd. - Product / Service
- JLA Ltd. - Key offerings
- 12.12 MEIKO Maschinenbau GmbH and Co. KG
- MEIKO Maschinenbau GmbH and Co. KG - Overview
- MEIKO Maschinenbau GmbH and Co. KG - Product / Service
- MEIKO Maschinenbau GmbH and Co. KG - Key offerings
- 12.13 Miele and Cie. KG
- Miele and Cie. KG - Overview
- Miele and Cie. KG - Product / Service
- Miele and Cie. KG - Key offerings
- 12.14 MVP Group Corp.
- MVP Group Corp. - Overview
- MVP Group Corp. - Product / Service
- MVP Group Corp. - Key offerings
- 12.15 Robert Bosch GmbH
- Robert Bosch GmbH - Overview
- Robert Bosch GmbH - Product / Service
- Robert Bosch GmbH - Key news
- Robert Bosch GmbH - Key offerings
- 12.16 TEIKOS Srl
- TEIKOS Srl - Overview
- TEIKOS Srl - Product / Service
- TEIKOS Srl - Key offerings
- 12.17 Whirlpool Corp.
- Whirlpool Corp. - Overview
- Whirlpool Corp. - Business segments
- Whirlpool Corp. - Key news
- Whirlpool Corp. - Key offerings
- Whirlpool Corp. - Segment focus
13 Appendix
- 13.1 Scope of the report
- 13.2 Inclusions and exclusions checklist
- Inclusions checklist
- Exclusions checklist
- 13.3 Currency conversion rates for US$
- Currency conversion rates for US$
- 13.4 Research methodology
- Research methodology
- 13.5 Data procurement
- Information sources
- 13.6 Data validation
- Data validation
- 13.7 Validation techniques employed for market sizing
- Validation techniques employed for market sizing
- 13.8 Data synthesis
- Data synthesis
- 13.9 360 degree market analysis
- 360 degree market analysis
- 13.10 List of abbreviations
- List of abbreviations
