市場調査レポート
商品コード
1559277

ビタミンK2の世界市場、2024年~2028年

Global Vitamin K2 Market 2024-2028


出版日
発行
TechNavio
ページ情報
英文 196 Pages
納期
即納可能 即納可能とは
カスタマイズ可能
価格
価格表記: USDを日本円(税抜)に換算
本日の銀行送金レート: 1USD=144.06円
ビタミンK2の世界市場、2024年~2028年
出版日: 2024年08月27日
発行: TechNavio
ページ情報: 英文 196 Pages
納期: 即納可能 即納可能とは
GIIご利用のメリット
  • 全表示
  • 概要
  • 図表
  • 目次
概要

ビタミンK2市場2024-2028

ビタミンK2市場は2023-2028年に1億8,040万米ドル、予測期間中のCAGRは14.31%で成長すると予測されます。当レポートでは、ビタミンK2市場の全体的な分析、市場規模・予測、動向、成長促進要因、課題、約25のベンダーを網羅したベンダー分析などを掲載しています。

現在の市場シナリオ、最新動向と促進要因、市場環境全体に関する最新分析を提供しています。市場は、ビタミンサプリメント需要の増加、骨粗鬆症の有病率の増加、新興市場における需要の高まりによって牽引されています。

市場範囲
基準年 2024
終了年 2028
予測期間 2024-2028
成長モメンタム 加速
前年比2024年 12.61%
CAGR 14.31%
増分額 1億8,040万米ドル

本調査では、今後数年間のビタミンK2市場成長を牽引する主な要因の一つとして、化粧品産業における用途の増加を挙げています。また、ビタミンK2が子供の骨や脳の開拓に役立つという認識が高まり、100%ベジタリアンのビタミンK2サプリメントの需要が増加していることも、市場の大きな需要につながるであろう。

目次

第1章 エグゼクティブサマリー

  • 市場概要

第2章 Technavio分析

  • 価格・ライフサイクル・顧客購入バスケット・採用率・購入基準の分析
  • インプットの重要性と差別化の要因
  • 混乱の要因
  • 促進要因と課題の影響

第3章 市場情勢

  • 市場エコシステム
  • 市場の特徴
  • バリューチェーン分析

第4章 市場規模の評価

  • 市場の定義
  • 市場セグメント分析
  • 市場規模 2023
  • 市場の見通し 2023-2028

第5章 市場規模実績

  • ビタミンK2の世界市場 2018-2022
  • 由来別セグメント分析 2018-2022
  • 流通チャネル別セグメント分析 2018-2022
  • 地域別セグメント分析 2018-2022
  • 国別セグメント分析 2018-2022

第6章 定性分析

  • AIの影響ビタミンK2の世界市場

第7章 ファイブフォース分析

  • ファイブフォースの要約
  • 買い手の交渉力
  • 供給企業の交渉力
  • 新規参入業者の脅威
  • 代替品の脅威
  • 競争の脅威
  • 市況

第8章 市場セグメンテーション:由来別

  • 市場セグメンテーション
  • 比較:由来別
  • 天然:市場規模と予測 2023-2028
  • 合成:市場規模と予測 2023-2028
  • 市場機会:由来別

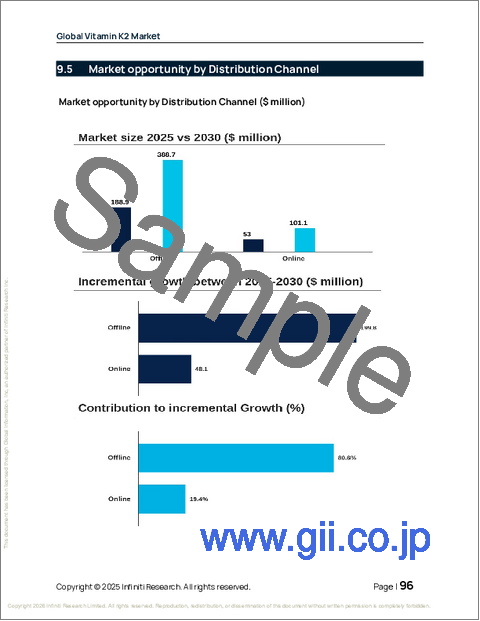
第9章 市場セグメンテーション:流通チャネル別

  • 市場セグメンテーション
  • 比較:流通チャネル別
  • オフライン:市場規模と予測 2023-2028
  • オンライン:市場規模と予測 2023-2028
  • 市場機会:流通チャネル別

第10章 顧客情勢

  • 顧客情勢の概要

第11章 地域別情勢

  • 地域別セグメンテーション
  • 地域別比較
  • 北米:市場規模と予測 2023-2028
  • 欧州:市場規模と予測 2023-2028
  • アジア:市場規模と予測 2023-2028
  • 世界のその他の地域:市場規模と予測 2023-2028
  • 米国:市場規模と予測 2023-2028
  • カナダ:市場規模と予測 2023-2028
  • ドイツ:市場規模と予測 2023-2028
  • 英国:市場規模と予測 2023-2028
  • 中国:市場規模と予測 2023-2028
  • 日本:市場規模と予測 2023-2028
  • オランダ:市場規模と予測 2023-2028
  • 韓国:市場規模と予測 2023-2028
  • フランス:市場規模と予測 2023-2028
  • インド:市場規模と予測 2023-2028
  • 市場機会:地域情勢別

第12章 促進要因・課題・機会・抑制要因

  • 市場促進要因
  • 市場の課題
  • 促進要因と課題の影響
  • 市場の機会・抑制要因

第13章 競合情勢

  • 概要
  • 競合情勢
  • 混乱の状況
  • 業界のリスク

第14章 競合分析

  • 企業プロファイル
  • 企業ランキング指数
  • 企業の市場ポジショニング
  • Anderson Global Group LLC
  • Anthem Biosciences Pvt. Ltd.
  • Balchem Inc.
  • BASF SE
  • Codex Drugs Pvt. Ltd.
  • DuPont de Nemours Inc.
  • Koninklijke DSM NV
  • Lesaffre and Cie
  • Lonza Group Ltd.
  • MENADIONA SL
  • Novozymes AS
  • Purayati
  • Seebio Biotech Shanghai Co. Ltd.
  • Viridis BioPharma Pvt. Ltd.
  • Vox Nutrition Inc.

第15章 付録

図表

Exhibits:

  • Exhibits1: Executive Summary - Chart on Market Overview
  • Exhibits2: Executive Summary - Data Table on Market Overview
  • Exhibits3: Executive Summary - Chart on Global Market Characteristics
  • Exhibits4: Executive Summary - Chart on Market By Geographical Landscape
  • Exhibits5: Executive Summary - Chart on Market Segmentation by Source
  • Exhibits6: Executive Summary - Chart on Market Segmentation by Distribution Channel
  • Exhibits7: Executive Summary - Chart on Incremental Growth
  • Exhibits8: Executive Summary - Data Table on Incremental Growth
  • Exhibits9: Executive Summary - Chart on Company Market Positioning
  • Exhibits10: Analysis of price sensitivity, lifecycle, customer purchase basket, adoption rates, and purchase criteria
  • Exhibits11: Overview on criticality of inputs and factors of differentiation
  • Exhibits12: Overview on factors of disruption
  • Exhibits13: Impact of drivers and challenges in 2023 and 2028
  • Exhibits14: Parent Market
  • Exhibits15: Data Table on - Parent Market
  • Exhibits16: Market characteristics analysis
  • Exhibits17: Value Chain Analysis
  • Exhibits18: Offerings of companies included in the market definition
  • Exhibits19: Market segments
  • Exhibits20: Chart on Global - Market size and forecast 2023-2028 ($ million)
  • Exhibits21: Data Table on Global - Market size and forecast 2023-2028 ($ million)
  • Exhibits22: Chart on Global Market: Year-over-year growth 2023-2028 (%)
  • Exhibits23: Data Table on Global Market: Year-over-year growth 2023-2028 (%)
  • Exhibits24: Historic Market Size - Data Table on Global Vitamin K2 Market 2018 - 2022 ($ million)
  • Exhibits25: Historic Market Size - Source Segment 2018 - 2022 ($ million)
  • Exhibits26: Historic Market Size - Distribution Channel Segment 2018 - 2022 ($ million)
  • Exhibits27: Historic Market Size - Geography Segment 2018 - 2022 ($ million)
  • Exhibits28: Historic Market Size - Country Segment 2018 - 2022 ($ million)
  • Exhibits29: Five forces analysis - Comparison between 2023 and 2028
  • Exhibits30: Bargaining power of buyers - Impact of key factors 2023 and 2028
  • Exhibits31: Bargaining power of suppliers - Impact of key factors in 2023 and 2028
  • Exhibits32: Threat of new entrants - Impact of key factors in 2023 and 2028
  • Exhibits33: Threat of substitutes - Impact of key factors in 2023 and 2028
  • Exhibits34: Threat of rivalry - Impact of key factors in 2023 and 2028
  • Exhibits35: Chart on Market condition - Five forces 2023 and 2028
  • Exhibits36: Chart on Source - Market share 2023-2028 (%)
  • Exhibits37: Data Table on Source - Market share 2023-2028 (%)
  • Exhibits38: Chart on Comparison by Source
  • Exhibits39: Data Table on Comparison by Source
  • Exhibits40: Chart on Natural - Market size and forecast 2023-2028 ($ million)
  • Exhibits41: Data Table on Natural - Market size and forecast 2023-2028 ($ million)
  • Exhibits42: Chart on Natural - Year-over-year growth 2023-2028 (%)
  • Exhibits43: Data Table on Natural - Year-over-year growth 2023-2028 (%)
  • Exhibits44: Chart on Synthetic - Market size and forecast 2023-2028 ($ million)
  • Exhibits45: Data Table on Synthetic - Market size and forecast 2023-2028 ($ million)
  • Exhibits46: Chart on Synthetic - Year-over-year growth 2023-2028 (%)
  • Exhibits47: Data Table on Synthetic - Year-over-year growth 2023-2028 (%)
  • Exhibits48: Market opportunity by Source ($ million)
  • Exhibits49: Data Table on Market opportunity by Source ($ million)
  • Exhibits50: Chart on Distribution Channel - Market share 2023-2028 (%)
  • Exhibits51: Data Table on Distribution Channel - Market share 2023-2028 (%)
  • Exhibits52: Chart on Comparison by Distribution Channel
  • Exhibits53: Data Table on Comparison by Distribution Channel
  • Exhibits54: Chart on Offline - Market size and forecast 2023-2028 ($ million)
  • Exhibits55: Data Table on Offline - Market size and forecast 2023-2028 ($ million)
  • Exhibits56: Chart on Offline - Year-over-year growth 2023-2028 (%)
  • Exhibits57: Data Table on Offline - Year-over-year growth 2023-2028 (%)
  • Exhibits58: Chart on Online - Market size and forecast 2023-2028 ($ million)
  • Exhibits59: Data Table on Online - Market size and forecast 2023-2028 ($ million)
  • Exhibits60: Chart on Online - Year-over-year growth 2023-2028 (%)
  • Exhibits61: Data Table on Online - Year-over-year growth 2023-2028 (%)
  • Exhibits62: Market opportunity by Distribution Channel ($ million)
  • Exhibits63: Data Table on Market opportunity by Distribution Channel ($ million)
  • Exhibits64: Analysis of price sensitivity, lifecycle, customer purchase basket, adoption rates, and purchase criteria
  • Exhibits65: Chart on Market share By Geographical Landscape 2023-2028 (%)
  • Exhibits66: Data Table on Market share By Geographical Landscape 2023-2028 (%)
  • Exhibits67: Chart on Geographic comparison
  • Exhibits68: Data Table on Geographic comparison
  • Exhibits69: Chart on North America - Market size and forecast 2023-2028 ($ million)
  • Exhibits70: Data Table on North America - Market size and forecast 2023-2028 ($ million)
  • Exhibits71: Chart on North America - Year-over-year growth 2023-2028 (%)
  • Exhibits72: Data Table on North America - Year-over-year growth 2023-2028 (%)
  • Exhibits73: Chart on Europe - Market size and forecast 2023-2028 ($ million)
  • Exhibits74: Data Table on Europe - Market size and forecast 2023-2028 ($ million)
  • Exhibits75: Chart on Europe - Year-over-year growth 2023-2028 (%)
  • Exhibits76: Data Table on Europe - Year-over-year growth 2023-2028 (%)
  • Exhibits77: Chart on Asia - Market size and forecast 2023-2028 ($ million)
  • Exhibits78: Data Table on Asia - Market size and forecast 2023-2028 ($ million)
  • Exhibits79: Chart on Asia - Year-over-year growth 2023-2028 (%)
  • Exhibits80: Data Table on Asia - Year-over-year growth 2023-2028 (%)
  • Exhibits81: Chart on Rest of World (ROW) - Market size and forecast 2023-2028 ($ million)
  • Exhibits82: Data Table on Rest of World (ROW) - Market size and forecast 2023-2028 ($ million)
  • Exhibits83: Chart on Rest of World (ROW) - Year-over-year growth 2023-2028 (%)
  • Exhibits84: Data Table on Rest of World (ROW) - Year-over-year growth 2023-2028 (%)
  • Exhibits85: Chart on US - Market size and forecast 2023-2028 ($ million)
  • Exhibits86: Data Table on US - Market size and forecast 2023-2028 ($ million)
  • Exhibits87: Chart on US - Year-over-year growth 2023-2028 (%)
  • Exhibits88: Data Table on US - Year-over-year growth 2023-2028 (%)
  • Exhibits89: Chart on Canada - Market size and forecast 2023-2028 ($ million)
  • Exhibits90: Data Table on Canada - Market size and forecast 2023-2028 ($ million)
  • Exhibits91: Chart on Canada - Year-over-year growth 2023-2028 (%)
  • Exhibits92: Data Table on Canada - Year-over-year growth 2023-2028 (%)
  • Exhibits93: Chart on Germany - Market size and forecast 2023-2028 ($ million)
  • Exhibits94: Data Table on Germany - Market size and forecast 2023-2028 ($ million)
  • Exhibits95: Chart on Germany - Year-over-year growth 2023-2028 (%)
  • Exhibits96: Data Table on Germany - Year-over-year growth 2023-2028 (%)
  • Exhibits97: Chart on UK - Market size and forecast 2023-2028 ($ million)
  • Exhibits98: Data Table on UK - Market size and forecast 2023-2028 ($ million)
  • Exhibits99: Chart on UK - Year-over-year growth 2023-2028 (%)
  • Exhibits100: Data Table on UK - Year-over-year growth 2023-2028 (%)
  • Exhibits101: Chart on China - Market size and forecast 2023-2028 ($ million)
  • Exhibits102: Data Table on China - Market size and forecast 2023-2028 ($ million)
  • Exhibits103: Chart on China - Year-over-year growth 2023-2028 (%)
  • Exhibits104: Data Table on China - Year-over-year growth 2023-2028 (%)
  • Exhibits105: Chart on Japan - Market size and forecast 2023-2028 ($ million)
  • Exhibits106: Data Table on Japan - Market size and forecast 2023-2028 ($ million)
  • Exhibits107: Chart on Japan - Year-over-year growth 2023-2028 (%)
  • Exhibits108: Data Table on Japan - Year-over-year growth 2023-2028 (%)
  • Exhibits109: Chart on The Netherlands - Market size and forecast 2023-2028 ($ million)
  • Exhibits110: Data Table on The Netherlands - Market size and forecast 2023-2028 ($ million)
  • Exhibits111: Chart on The Netherlands - Year-over-year growth 2023-2028 (%)
  • Exhibits112: Data Table on The Netherlands - Year-over-year growth 2023-2028 (%)
  • Exhibits113: Chart on South Korea - Market size and forecast 2023-2028 ($ million)
  • Exhibits114: Data Table on South Korea - Market size and forecast 2023-2028 ($ million)
  • Exhibits115: Chart on South Korea - Year-over-year growth 2023-2028 (%)
  • Exhibits116: Data Table on South Korea - Year-over-year growth 2023-2028 (%)
  • Exhibits117: Chart on France - Market size and forecast 2023-2028 ($ million)
  • Exhibits118: Data Table on France - Market size and forecast 2023-2028 ($ million)
  • Exhibits119: Chart on France - Year-over-year growth 2023-2028 (%)
  • Exhibits120: Data Table on France - Year-over-year growth 2023-2028 (%)
  • Exhibits121: Chart on India - Market size and forecast 2023-2028 ($ million)
  • Exhibits122: Data Table on India - Market size and forecast 2023-2028 ($ million)
  • Exhibits123: Chart on India - Year-over-year growth 2023-2028 (%)
  • Exhibits124: Data Table on India - Year-over-year growth 2023-2028 (%)
  • Exhibits125: Market opportunity By Geographical Landscape ($ million)
  • Exhibits126: Data Tables on Market opportunity By Geographical Landscape ($ million)
  • Exhibits127: Impact of drivers and challenges in 2023 and 2028
  • Exhibits128: Overview on criticality of inputs and factors of differentiation
  • Exhibits129: Overview on factors of disruption
  • Exhibits130: Impact of key risks on business
  • Exhibits131: Companies covered
  • Exhibits132: Company ranking index
  • Exhibits133: Matrix on companies position and classification
  • Exhibits134: Anderson Global Group LLC - Overview
  • Exhibits135: Anderson Global Group LLC - Product / Service
  • Exhibits136: Anderson Global Group LLC - Key offerings
  • Exhibits137: SWOT
  • Exhibits138: Anthem Biosciences Pvt. Ltd. - Overview
  • Exhibits139: Anthem Biosciences Pvt. Ltd. - Product / Service
  • Exhibits140: Anthem Biosciences Pvt. Ltd. - Key offerings
  • Exhibits141: SWOT
  • Exhibits142: Balchem Inc. - Overview
  • Exhibits143: Balchem Inc. - Business segments
  • Exhibits144: Balchem Inc. - Key offerings
  • Exhibits145: Balchem Inc. - Segment focus
  • Exhibits146: SWOT
  • Exhibits147: BASF SE - Overview
  • Exhibits148: BASF SE - Business segments
  • Exhibits149: BASF SE - Key news
  • Exhibits150: BASF SE - Key offerings
  • Exhibits151: BASF SE - Segment focus
  • Exhibits152: SWOT
  • Exhibits153: Codex Drugs Pvt. Ltd. - Overview
  • Exhibits154: Codex Drugs Pvt. Ltd. - Product / Service
  • Exhibits155: Codex Drugs Pvt. Ltd. - Key offerings
  • Exhibits156: SWOT
  • Exhibits157: DuPont de Nemours Inc. - Overview
  • Exhibits158: DuPont de Nemours Inc. - Business segments
  • Exhibits159: DuPont de Nemours Inc. - Key news
  • Exhibits160: DuPont de Nemours Inc. - Key offerings
  • Exhibits161: DuPont de Nemours Inc. - Segment focus
  • Exhibits162: SWOT
  • Exhibits163: Koninklijke DSM NV - Overview
  • Exhibits164: Koninklijke DSM NV - Business segments
  • Exhibits165: Koninklijke DSM NV - Key news
  • Exhibits166: Koninklijke DSM NV - Key offerings
  • Exhibits167: Koninklijke DSM NV - Segment focus
  • Exhibits168: SWOT
  • Exhibits169: Lesaffre and Cie - Overview
  • Exhibits170: Lesaffre and Cie - Product / Service
  • Exhibits171: Lesaffre and Cie - Key offerings
  • Exhibits172: SWOT
  • Exhibits173: Lonza Group Ltd. - Overview
  • Exhibits174: Lonza Group Ltd. - Business segments
  • Exhibits175: Lonza Group Ltd. - Key news
  • Exhibits176: Lonza Group Ltd. - Key offerings
  • Exhibits177: Lonza Group Ltd. - Segment focus
  • Exhibits178: SWOT
  • Exhibits179: MENADIONA SL - Overview
  • Exhibits180: MENADIONA SL - Product / Service
  • Exhibits181: MENADIONA SL - Key offerings
  • Exhibits182: SWOT
  • Exhibits183: Novozymes AS - Overview
  • Exhibits184: Novozymes AS - Product / Service
  • Exhibits185: Novozymes AS - Key offerings
  • Exhibits186: SWOT
  • Exhibits187: Purayati - Overview
  • Exhibits188: Purayati - Product / Service
  • Exhibits189: Purayati - Key offerings
  • Exhibits190: SWOT
  • Exhibits191: Seebio Biotech Shanghai Co. Ltd. - Overview
  • Exhibits192: Seebio Biotech Shanghai Co. Ltd. - Product / Service
  • Exhibits193: Seebio Biotech Shanghai Co. Ltd. - Key offerings
  • Exhibits194: SWOT
  • Exhibits195: Viridis BioPharma Pvt. Ltd. - Overview
  • Exhibits196: Viridis BioPharma Pvt. Ltd. - Product / Service
  • Exhibits197: Viridis BioPharma Pvt. Ltd. - Key offerings
  • Exhibits198: SWOT
  • Exhibits199: Vox Nutrition Inc. - Overview
  • Exhibits200: Vox Nutrition Inc. - Product / Service
  • Exhibits201: Vox Nutrition Inc. - Key offerings
  • Exhibits202: SWOT
  • Exhibits203: Inclusions checklist
  • Exhibits204: Exclusions checklist
  • Exhibits205: Currency conversion rates for US$
  • Exhibits206: Research methodology
  • Exhibits207: Information sources
  • Exhibits208: Data validation
  • Exhibits209: Validation techniques employed for market sizing
  • Exhibits210: Data synthesis
  • Exhibits211: 360 degree market analysis
  • Exhibits212: List of abbreviations
目次
Product Code: IRTNTR71758

Vitamin K2 Market 2024-2028

The vitamin k2 market is forecasted to grow by USD 180.4 mn during 2023-2028, accelerating at a CAGR of 14.31% during the forecast period. The report on the vitamin k2 market provides a holistic analysis, market size and forecast, trends, growth drivers, and challenges, as well as vendor analysis covering around 25 vendors.

The report offers an up-to-date analysis regarding the current market scenario, the latest trends and drivers, and the overall market environment. The market is driven by increasing demand for vitamin supplements, growing prevalence of osteoporosis, and rising demand in emerging markets.

Market Scope
Base Year2024
End Year2028
Series Year2024-2028
Growth MomentumAccelerate
YOY 202412.61%
CAGR14.31%
Incremental Value$180.4 mn

Technavio's vitamin k2 market is segmented as below:

By Source

    • Natural
    • Synthetic

By Distribution Channel

    • Offline
    • Online

By Geographical Landscape

    • North America
    • Europe
    • Asia
    • Rest of World (ROW)

This study identifies the increasing application in cosmetic industries as one of the prime reasons driving the vitamin k2 market growth during the next few years. Also, rising awareness on benefits of vitamin k2 in bone and brain development of children and increasing demand for 100% vegetarian vitamin k2 supplements will lead to sizable demand in the market.

The report on the vitamin k2 market covers the following areas:

    • Vitamin k2 market sizing
    • Vitamin k2 market forecast
    • Vitamin k2 market industry analysis

The vendor analysis is designed to help clients improve their market position, and in line with this, this report provides a detailed analysis of several leading vitamin k2 market vendors that include Allastir Pvt. Ltd., Anderson Group LLC, Anthem Biosciences Pvt. Ltd., Balchem Inc., BASF SE, Codex Drugs Pvt. Ltd., DuPont de Nemours Inc., GeneFerm Biotechnology Co. Ltd, Koninklijke DSM NV, Lesaffre and Cie, Lonza Group Ltd., MENADIONA SL, Nestle SA, Novozymes AS, Nutralife Health Products Inc., Purayati, Seebio Biotech Shanghai Co. Ltd., The Himalayan Organics, Viridis BioPharma Pvt. Ltd., and Vox Nutrition Inc.. Also, the vitamin k2 market analysis report includes information on upcoming trends and challenges that will influence market growth. This is to help companies strategize and leverage all forthcoming growth opportunities.

The study was conducted using an objective combination of primary and secondary information including inputs from key participants in the industry. The report contains a comprehensive market and vendor landscape in addition to an analysis of the key vendors.

The companies presents a detailed picture of the market by the way of study, synthesis, and summation of data from multiple sources by an analysis of key parameters such as profit, pricing, competition, and promotions. It presents various market facets by identifying the key industry influencers. The data presented is comprehensive, reliable, and a result of extensive research - both primary and secondary. The market research reports provide a complete competitive landscape and an in-depth vendor selection methodology and analysis using qualitative and quantitative research to forecast the accurate market growth.

Table of Contents

1 Executive Summary

  • 1.1 Market overview
    • Executive Summary - Chart on Market Overview
    • Executive Summary - Data Table on Market Overview
    • Executive Summary - Chart on Global Market Characteristics
    • Executive Summary - Chart on Market By Geographical Landscape
    • Executive Summary - Chart on Market Segmentation by Source
    • Executive Summary - Chart on Market Segmentation by Distribution Channel
    • Executive Summary - Chart on Incremental Growth
    • Executive Summary - Data Table on Incremental Growth
    • Executive Summary - Chart on Company Market Positioning

2 Technavio Analysis

  • 2.1 Analysis of price sensitivity, lifecycle, customer purchase basket, adoption rates, and purchase criteria
    • Analysis of price sensitivity, lifecycle, customer purchase basket, adoption rates, and purchase criteria
  • 2.2 Criticality of inputs and Factors of differentiation
    • Overview on criticality of inputs and factors of differentiation
  • 2.3 Factors of disruption
    • Overview on factors of disruption
  • 2.4 Impact of drivers and challenges
    • Impact of drivers and challenges in 2023 and 2028

3 Market Landscape

  • 3.1 Market ecosystem
    • Parent Market
    • Data Table on - Parent Market
  • 3.2 Market characteristics
    • Market characteristics analysis
  • 3.3 Value chain analysis
    • Value Chain Analysis

4 Market Sizing

  • 4.1 Market definition
    • Offerings of companies included in the market definition
  • 4.2 Market segment analysis
    • Market segments
  • 4.3 Market size 2023
  • 4.4 Market outlook: Forecast for 2023-2028
    • Chart on Global - Market size and forecast 2023-2028 ($ million)
    • Data Table on Global - Market size and forecast 2023-2028 ($ million)
    • Chart on Global Market: Year-over-year growth 2023-2028 (%)
    • Data Table on Global Market: Year-over-year growth 2023-2028 (%)

5 Historic Market Size

  • 5.1 Global Vitamin K2 Market 2018 - 2022
    • Historic Market Size - Data Table on Global Vitamin K2 Market 2018 - 2022 ($ million)
  • 5.2 Source segment analysis 2018 - 2022
    • Historic Market Size - Source Segment 2018 - 2022 ($ million)
  • 5.3 Distribution Channel segment analysis 2018 - 2022
    • Historic Market Size - Distribution Channel Segment 2018 - 2022 ($ million)
  • 5.4 Geography segment analysis 2018 - 2022
    • Historic Market Size - Geography Segment 2018 - 2022 ($ million)
  • 5.5 Country segment analysis 2018 - 2022
    • Historic Market Size - Country Segment 2018 - 2022 ($ million)

6 Qualitative Analysis

  • 6.1 Impact of AI on the Global Vitamin K2 Market

7 Five Forces Analysis

  • 7.1 Five forces summary
    • Five forces analysis - Comparison between 2023 and 2028
  • 7.2 Bargaining power of buyers
    • Bargaining power of buyers - Impact of key factors 2023 and 2028
  • 7.3 Bargaining power of suppliers
    • Bargaining power of suppliers - Impact of key factors in 2023 and 2028
  • 7.4 Threat of new entrants
    • Threat of new entrants - Impact of key factors in 2023 and 2028
  • 7.5 Threat of substitutes
    • Threat of substitutes - Impact of key factors in 2023 and 2028
  • 7.6 Threat of rivalry
    • Threat of rivalry - Impact of key factors in 2023 and 2028
  • 7.7 Market condition
    • Chart on Market condition - Five forces 2023 and 2028

8 Market Segmentation by Source

  • 8.1 Market segments
    • Chart on Source - Market share 2023-2028 (%)
    • Data Table on Source - Market share 2023-2028 (%)
  • 8.2 Comparison by Source
    • Chart on Comparison by Source
    • Data Table on Comparison by Source
  • 8.3 Natural - Market size and forecast 2023-2028
    • Chart on Natural - Market size and forecast 2023-2028 ($ million)
    • Data Table on Natural - Market size and forecast 2023-2028 ($ million)
    • Chart on Natural - Year-over-year growth 2023-2028 (%)
    • Data Table on Natural - Year-over-year growth 2023-2028 (%)
  • 8.4 Synthetic - Market size and forecast 2023-2028
    • Chart on Synthetic - Market size and forecast 2023-2028 ($ million)
    • Data Table on Synthetic - Market size and forecast 2023-2028 ($ million)
    • Chart on Synthetic - Year-over-year growth 2023-2028 (%)
    • Data Table on Synthetic - Year-over-year growth 2023-2028 (%)
  • 8.5 Market opportunity by Source
    • Market opportunity by Source ($ million)
    • Data Table on Market opportunity by Source ($ million)

9 Market Segmentation by Distribution Channel

  • 9.1 Market segments
    • Chart on Distribution Channel - Market share 2023-2028 (%)
    • Data Table on Distribution Channel - Market share 2023-2028 (%)
  • 9.2 Comparison by Distribution Channel
    • Chart on Comparison by Distribution Channel
    • Data Table on Comparison by Distribution Channel
  • 9.3 Offline - Market size and forecast 2023-2028
    • Chart on Offline - Market size and forecast 2023-2028 ($ million)
    • Data Table on Offline - Market size and forecast 2023-2028 ($ million)
    • Chart on Offline - Year-over-year growth 2023-2028 (%)
    • Data Table on Offline - Year-over-year growth 2023-2028 (%)
  • 9.4 Online - Market size and forecast 2023-2028
    • Chart on Online - Market size and forecast 2023-2028 ($ million)
    • Data Table on Online - Market size and forecast 2023-2028 ($ million)
    • Chart on Online - Year-over-year growth 2023-2028 (%)
    • Data Table on Online - Year-over-year growth 2023-2028 (%)
  • 9.5 Market opportunity by Distribution Channel
    • Market opportunity by Distribution Channel ($ million)
    • Data Table on Market opportunity by Distribution Channel ($ million)

10 Customer Landscape

  • 10.1 Customer landscape overview
    • Analysis of price sensitivity, lifecycle, customer purchase basket, adoption rates, and purchase criteria

11 Geographic Landscape

  • 11.1 Geographic segmentation
    • Chart on Market share By Geographical Landscape 2023-2028 (%)
    • Data Table on Market share By Geographical Landscape 2023-2028 (%)
  • 11.2 Geographic comparison
    • Chart on Geographic comparison
    • Data Table on Geographic comparison
  • 11.3 North America - Market size and forecast 2023-2028
    • Chart on North America - Market size and forecast 2023-2028 ($ million)
    • Data Table on North America - Market size and forecast 2023-2028 ($ million)
    • Chart on North America - Year-over-year growth 2023-2028 (%)
    • Data Table on North America - Year-over-year growth 2023-2028 (%)
  • 11.4 Europe - Market size and forecast 2023-2028
    • Chart on Europe - Market size and forecast 2023-2028 ($ million)
    • Data Table on Europe - Market size and forecast 2023-2028 ($ million)
    • Chart on Europe - Year-over-year growth 2023-2028 (%)
    • Data Table on Europe - Year-over-year growth 2023-2028 (%)
  • 11.5 Asia - Market size and forecast 2023-2028
    • Chart on Asia - Market size and forecast 2023-2028 ($ million)
    • Data Table on Asia - Market size and forecast 2023-2028 ($ million)
    • Chart on Asia - Year-over-year growth 2023-2028 (%)
    • Data Table on Asia - Year-over-year growth 2023-2028 (%)
  • 11.6 Rest of World (ROW) - Market size and forecast 2023-2028
    • Chart on Rest of World (ROW) - Market size and forecast 2023-2028 ($ million)
    • Data Table on Rest of World (ROW) - Market size and forecast 2023-2028 ($ million)
    • Chart on Rest of World (ROW) - Year-over-year growth 2023-2028 (%)
    • Data Table on Rest of World (ROW) - Year-over-year growth 2023-2028 (%)
  • 11.7 US - Market size and forecast 2023-2028
    • Chart on US - Market size and forecast 2023-2028 ($ million)
    • Data Table on US - Market size and forecast 2023-2028 ($ million)
    • Chart on US - Year-over-year growth 2023-2028 (%)
    • Data Table on US - Year-over-year growth 2023-2028 (%)
  • 11.8 Canada - Market size and forecast 2023-2028
    • Chart on Canada - Market size and forecast 2023-2028 ($ million)
    • Data Table on Canada - Market size and forecast 2023-2028 ($ million)
    • Chart on Canada - Year-over-year growth 2023-2028 (%)
    • Data Table on Canada - Year-over-year growth 2023-2028 (%)
  • 11.9 Germany - Market size and forecast 2023-2028
    • Chart on Germany - Market size and forecast 2023-2028 ($ million)
    • Data Table on Germany - Market size and forecast 2023-2028 ($ million)
    • Chart on Germany - Year-over-year growth 2023-2028 (%)
    • Data Table on Germany - Year-over-year growth 2023-2028 (%)
  • 11.10 UK - Market size and forecast 2023-2028
    • Chart on UK - Market size and forecast 2023-2028 ($ million)
    • Data Table on UK - Market size and forecast 2023-2028 ($ million)
    • Chart on UK - Year-over-year growth 2023-2028 (%)
    • Data Table on UK - Year-over-year growth 2023-2028 (%)
  • 11.11 China - Market size and forecast 2023-2028
    • Chart on China - Market size and forecast 2023-2028 ($ million)
    • Data Table on China - Market size and forecast 2023-2028 ($ million)
    • Chart on China - Year-over-year growth 2023-2028 (%)
    • Data Table on China - Year-over-year growth 2023-2028 (%)
  • 11.12 Japan - Market size and forecast 2023-2028
    • Chart on Japan - Market size and forecast 2023-2028 ($ million)
    • Data Table on Japan - Market size and forecast 2023-2028 ($ million)
    • Chart on Japan - Year-over-year growth 2023-2028 (%)
    • Data Table on Japan - Year-over-year growth 2023-2028 (%)
  • 11.13 The Netherlands - Market size and forecast 2023-2028
    • Chart on The Netherlands - Market size and forecast 2023-2028 ($ million)
    • Data Table on The Netherlands - Market size and forecast 2023-2028 ($ million)
    • Chart on The Netherlands - Year-over-year growth 2023-2028 (%)
    • Data Table on The Netherlands - Year-over-year growth 2023-2028 (%)
  • 11.14 South Korea - Market size and forecast 2023-2028
    • Chart on South Korea - Market size and forecast 2023-2028 ($ million)
    • Data Table on South Korea - Market size and forecast 2023-2028 ($ million)
    • Chart on South Korea - Year-over-year growth 2023-2028 (%)
    • Data Table on South Korea - Year-over-year growth 2023-2028 (%)
  • 11.15 France - Market size and forecast 2023-2028
    • Chart on France - Market size and forecast 2023-2028 ($ million)
    • Data Table on France - Market size and forecast 2023-2028 ($ million)
    • Chart on France - Year-over-year growth 2023-2028 (%)
    • Data Table on France - Year-over-year growth 2023-2028 (%)
  • 11.16 India - Market size and forecast 2023-2028
    • Chart on India - Market size and forecast 2023-2028 ($ million)
    • Data Table on India - Market size and forecast 2023-2028 ($ million)
    • Chart on India - Year-over-year growth 2023-2028 (%)
    • Data Table on India - Year-over-year growth 2023-2028 (%)
  • 11.17 Market opportunity By Geographical Landscape
    • Market opportunity By Geographical Landscape ($ million)
    • Data Tables on Market opportunity By Geographical Landscape ($ million)

12 Drivers, Challenges, and Opportunity/Restraints

  • 12.1 Market drivers
  • 12.2 Market challenges
  • 12.3 Impact of drivers and challenges
    • Impact of drivers and challenges in 2023 and 2028
  • 12.4 Market opportunities/restraints

13 Competitive Landscape

  • 13.1 Overview
  • 13.2 Competitive Landscape
    • Overview on criticality of inputs and factors of differentiation
  • 13.3 Landscape disruption
    • Overview on factors of disruption
  • 13.4 Industry risks
    • Impact of key risks on business

14 Competitive Analysis

  • 14.1 Companies profiled
    • Companies covered
  • 14.2 Company ranking index
    • Company ranking index
  • 14.3 Market positioning of companies
    • Matrix on companies position and classification
  • 14.4 Anderson Global Group LLC
    • Anderson Global Group LLC - Overview
    • Anderson Global Group LLC - Product / Service
    • Anderson Global Group LLC - Key offerings
    • SWOT
  • 14.5 Anthem Biosciences Pvt. Ltd.
    • Anthem Biosciences Pvt. Ltd. - Overview
    • Anthem Biosciences Pvt. Ltd. - Product / Service
    • Anthem Biosciences Pvt. Ltd. - Key offerings
    • SWOT
  • 14.6 Balchem Inc.
    • Balchem Inc. - Overview
    • Balchem Inc. - Business segments
    • Balchem Inc. - Key offerings
    • Balchem Inc. - Segment focus
    • SWOT
  • 14.7 BASF SE
    • BASF SE - Overview
    • BASF SE - Business segments
    • BASF SE - Key news
    • BASF SE - Key offerings
    • BASF SE - Segment focus
    • SWOT
  • 14.8 Codex Drugs Pvt. Ltd.
    • Codex Drugs Pvt. Ltd. - Overview
    • Codex Drugs Pvt. Ltd. - Product / Service
    • Codex Drugs Pvt. Ltd. - Key offerings
    • SWOT
  • 14.9 DuPont de Nemours Inc.
    • DuPont de Nemours Inc. - Overview
    • DuPont de Nemours Inc. - Business segments
    • DuPont de Nemours Inc. - Key news
    • DuPont de Nemours Inc. - Key offerings
    • DuPont de Nemours Inc. - Segment focus
    • SWOT
  • 14.10 Koninklijke DSM NV
    • Koninklijke DSM NV - Overview
    • Koninklijke DSM NV - Business segments
    • Koninklijke DSM NV - Key news
    • Koninklijke DSM NV - Key offerings
    • Koninklijke DSM NV - Segment focus
    • SWOT
  • 14.11 Lesaffre and Cie
    • Lesaffre and Cie - Overview
    • Lesaffre and Cie - Product / Service
    • Lesaffre and Cie - Key offerings
    • SWOT
  • 14.12 Lonza Group Ltd.
    • Lonza Group Ltd. - Overview
    • Lonza Group Ltd. - Business segments
    • Lonza Group Ltd. - Key news
    • Lonza Group Ltd. - Key offerings
    • Lonza Group Ltd. - Segment focus
    • SWOT
  • 14.13 MENADIONA SL
    • MENADIONA SL - Overview
    • MENADIONA SL - Product / Service
    • MENADIONA SL - Key offerings
    • SWOT
  • 14.14 Novozymes AS
    • Novozymes AS - Overview
    • Novozymes AS - Product / Service
    • Novozymes AS - Key offerings
    • SWOT
  • 14.15 Purayati
    • Purayati - Overview
    • Purayati - Product / Service
    • Purayati - Key offerings
    • SWOT
  • 14.16 Seebio Biotech Shanghai Co. Ltd.
    • Seebio Biotech Shanghai Co. Ltd. - Overview
    • Seebio Biotech Shanghai Co. Ltd. - Product / Service
    • Seebio Biotech Shanghai Co. Ltd. - Key offerings
    • SWOT
  • 14.17 Viridis BioPharma Pvt. Ltd.
    • Viridis BioPharma Pvt. Ltd. - Overview
    • Viridis BioPharma Pvt. Ltd. - Product / Service
    • Viridis BioPharma Pvt. Ltd. - Key offerings
    • SWOT
  • 14.18 Vox Nutrition Inc.
    • Vox Nutrition Inc. - Overview
    • Vox Nutrition Inc. - Product / Service
    • Vox Nutrition Inc. - Key offerings
    • SWOT

15 Appendix

  • 15.1 Scope of the report
  • 15.2 Inclusions and exclusions checklist
    • Inclusions checklist
    • Exclusions checklist
  • 15.3 Currency conversion rates for US$
    • Currency conversion rates for US$
  • 15.4 Research methodology
    • Research methodology
  • 15.5 Data procurement
    • Information sources
  • 15.6 Data validation
    • Data validation
  • 15.7 Validation techniques employed for market sizing
    • Validation techniques employed for market sizing
  • 15.8 Data synthesis
    • Data synthesis
  • 15.9 360 degree market analysis
    • 360 degree market analysis
  • 15.10 List of abbreviations
    • List of abbreviations