|
|
市場調査レポート
商品コード
1558546
ホエイプロテインの世界市場、2024~2028年Global Whey Protein Market 2024-2028 |
||||||

|
|||||||
カスタマイズ可能
|
|||||||


| ホエイプロテインの世界市場、2024~2028年 |
|
出版日: 2024年08月15日
発行: TechNavio
ページ情報: 英文 167 Pages
納期: 即納可能
|

全表示
- 概要
- 図表
- 目次
ホエイプロテイン市場は2023~2028年に55億2,580万米ドル、予測期間中のCAGRは8.09%で成長すると予測されます。
当レポートでは、ホエイプロテイン市場の全体的な分析、市場規模・予測、動向、成長促進要因、課題、約25のベンダーを網羅したベンダー分析などを掲載しています。
現在の市場シナリオ、最新動向と促進要因、市場環境全体に関する最新分析を提供しています。市場は、製品上市の増加、ホエイの健康効果に対する認知度の向上、ホエイプロテインの幅広い応用によって牽引されています。
| 市場範囲 | |
|---|---|
| 基準年 | 2024年 |
| 終了年 | 2028年 |
| 予測期間 | 2024~2028年 |
| 成長モメンタム | 加速 |
| 前年比[2024年] | 7.32% |
| CAGR | 8.09% |
| 増分額 | 55億2,580万米ドル |
本調査では、今後数年間のホエイプロテイン市場成長を牽引する主要要因の1つとして、臨床栄養におけるホエイプロテイン使用の増加を挙げています。また、ベンダーの戦略的活動や販売におけるeコマースチャネルの利用増加が、市場の大きな需要につながるとしています。
目次
第1章 エグゼクティブサマリー
- 市場概要
第2章 市場情勢
- 市場エコシステム
- 市場の特徴
- バリューチェーン分析
第3章 市場規模の評価
- 市場の定義
- 市場セグメント分析
- 市場規模 2023年
- 市場の展望 2023~2028年
第4章 市場規模実績
- ホエイプロテインの世界市場 2018~2022年
- 製品別セグメント分析 2018~2022年
- 用途別セグメント分析 2018~2022年
- 地域別セグメント分析 2018~2022年
- 国別セグメント分析 2018~2022年
第5章 ファイブフォース分析
- ファイブフォースの要約
- 買い手の交渉力
- 供給企業の交渉力
- 新規参入業者の脅威
- 代替品の脅威
- 競争の脅威
- 市況
第6章 市場セグメンテーション:製品別
- 市場セグメンテーション
- 比較:製品別
- ホエイプロテイン濃縮物:市場規模と予測 2023~2028年
- ホエイプロテイン加水分解物:市場規模と予測 2023~2028年
- ホエイプロテイン分離物:市場規模と予測 2023~2028年
- 市場機会:製品別
第7章 市場セグメンテーション:用途別
- 市場セグメンテーション
- 比較:用途別
- 飲食品:市場規模と予測 2023~2028年
- 栄養補助食品:市場規模と予測 2023~2028年
- パーソナルケア:市場規模と予測 2023~2028年
- 動物飼料とペットフード:市場規模と予測 2023~2028年
- 市場機会:用途別
第8章 顧客情勢
- 顧客情勢概要
第9章 地域別情勢
- 地域別セグメンテーション
- 比較:地域別
- 北米:市場規模と予測 2023~2028年
- 欧州:市場規模と予測 2023~2028年
- アジア太平洋:市場規模と予測 2023~2028年
- 南米:市場規模と予測 2023~2028年
- 中東・アフリカ:市場規模と予測 2023~2028年
- 米国:市場規模と予測 2023~2028年
- ドイツ:市場規模と予測 2023~2028年
- 英国:市場規模と予測 2023~2028年
- 中国:市場規模と予測 2023~2028年
- フランス:市場規模と予測 2023~2028年
- 市場機会:地域情勢別
第10章 促進要因・課題・機会・抑制要因
- 市場促進要因
- 市場課題
- 促進要因と課題の影響
- 市場の機会・抑制要因
第11章 競合情勢
- 概要
- 競合情勢
- 混乱の状況
- 業界のリスク
第12章 競合分析
- 企業プロファイル
- 企業の市場ポジショニング
- Abbott Laboratories
- Arla Foods amba
- Carbery Food Ingredients Ltd.
- Dairy Farmers of America Inc.
- Danone SA
- DMK Deutsches Milchkontor GmbH
- Fonterra Cooperative Group Ltd.
- Glanbia plc
- Hilmar Cheese Co. Inc.
- Kaserei Champignon Hofmeister
- LACTALIS Ingredients
- Leprino Foods Co.
- Milk Specialties Global
- Nestle SA
- Saputo Inc.
第13章 付録
Exhibits:
- Exhibits1: Executive Summary - Chart on Market Overview
- Exhibits2: Executive Summary - Data Table on Market Overview
- Exhibits3: Executive Summary - Chart on Global Market Characteristics
- Exhibits4: Executive Summary - Chart on Market By Geographical Landscape
- Exhibits5: Executive Summary - Chart on Market Segmentation by Product
- Exhibits6: Executive Summary - Chart on Market Segmentation by Application
- Exhibits7: Executive Summary - Chart on Incremental Growth
- Exhibits8: Executive Summary - Data Table on Incremental Growth
- Exhibits9: Executive Summary - Chart on Company Market Positioning
- Exhibits10: Parent Market
- Exhibits11: Data Table on - Parent Market
- Exhibits12: Market characteristics analysis
- Exhibits13: Value Chain Analysis
- Exhibits14: Offerings of companies included in the market definition
- Exhibits15: Market segments
- Exhibits16: Chart on Global - Market size and forecast 2023-2028 ($ million)
- Exhibits17: Data Table on Global - Market size and forecast 2023-2028 ($ million)
- Exhibits18: Chart on Global Market: Year-over-year growth 2023-2028 (%)
- Exhibits19: Data Table on Global Market: Year-over-year growth 2023-2028 (%)
- Exhibits20: Historic Market Size - Data Table on Global Whey Protein Market 2018 - 2022 ($ million)
- Exhibits21: Historic Market Size - Product Segment 2018 - 2022 ($ million)
- Exhibits22: Historic Market Size - Application Segment 2018 - 2022 ($ million)
- Exhibits23: Historic Market Size - Geography Segment 2018 - 2022 ($ million)
- Exhibits24: Historic Market Size - Country Segment 2018 - 2022 ($ million)
- Exhibits25: Five forces analysis - Comparison between 2023 and 2028
- Exhibits26: Bargaining power of buyers - Impact of key factors 2023 and 2028
- Exhibits27: Bargaining power of suppliers - Impact of key factors in 2023 and 2028
- Exhibits28: Threat of new entrants - Impact of key factors in 2023 and 2028
- Exhibits29: Threat of substitutes - Impact of key factors in 2023 and 2028
- Exhibits30: Threat of rivalry - Impact of key factors in 2023 and 2028
- Exhibits31: Chart on Market condition - Five forces 2023 and 2028
- Exhibits32: Chart on Product - Market share 2023-2028 (%)
- Exhibits33: Data Table on Product - Market share 2023-2028 (%)
- Exhibits34: Chart on Comparison by Product
- Exhibits35: Data Table on Comparison by Product
- Exhibits36: Chart on Whey protein concentrates - Market size and forecast 2023-2028 ($ million)
- Exhibits37: Data Table on Whey protein concentrates - Market size and forecast 2023-2028 ($ million)
- Exhibits38: Chart on Whey protein concentrates - Year-over-year growth 2023-2028 (%)
- Exhibits39: Data Table on Whey protein concentrates - Year-over-year growth 2023-2028 (%)
- Exhibits40: Chart on Whey protein hydrolysates - Market size and forecast 2023-2028 ($ million)
- Exhibits41: Data Table on Whey protein hydrolysates - Market size and forecast 2023-2028 ($ million)
- Exhibits42: Chart on Whey protein hydrolysates - Year-over-year growth 2023-2028 (%)
- Exhibits43: Data Table on Whey protein hydrolysates - Year-over-year growth 2023-2028 (%)
- Exhibits44: Chart on Whey protein isolates - Market size and forecast 2023-2028 ($ million)
- Exhibits45: Data Table on Whey protein isolates - Market size and forecast 2023-2028 ($ million)
- Exhibits46: Chart on Whey protein isolates - Year-over-year growth 2023-2028 (%)
- Exhibits47: Data Table on Whey protein isolates - Year-over-year growth 2023-2028 (%)
- Exhibits48: Market opportunity by Product ($ million)
- Exhibits49: Data Table on Market opportunity by Product ($ million)
- Exhibits50: Chart on Application - Market share 2023-2028 (%)
- Exhibits51: Data Table on Application - Market share 2023-2028 (%)
- Exhibits52: Chart on Comparison by Application
- Exhibits53: Data Table on Comparison by Application
- Exhibits54: Chart on Food and beverages - Market size and forecast 2023-2028 ($ million)
- Exhibits55: Data Table on Food and beverages - Market size and forecast 2023-2028 ($ million)
- Exhibits56: Chart on Food and beverages - Year-over-year growth 2023-2028 (%)
- Exhibits57: Data Table on Food and beverages - Year-over-year growth 2023-2028 (%)
- Exhibits58: Chart on Nutritional supplements - Market size and forecast 2023-2028 ($ million)
- Exhibits59: Data Table on Nutritional supplements - Market size and forecast 2023-2028 ($ million)
- Exhibits60: Chart on Nutritional supplements - Year-over-year growth 2023-2028 (%)
- Exhibits61: Data Table on Nutritional supplements - Year-over-year growth 2023-2028 (%)
- Exhibits62: Chart on Personal care - Market size and forecast 2023-2028 ($ million)
- Exhibits63: Data Table on Personal care - Market size and forecast 2023-2028 ($ million)
- Exhibits64: Chart on Personal care - Year-over-year growth 2023-2028 (%)
- Exhibits65: Data Table on Personal care - Year-over-year growth 2023-2028 (%)
- Exhibits66: Chart on Animal feed and pet food - Market size and forecast 2023-2028 ($ million)
- Exhibits67: Data Table on Animal feed and pet food - Market size and forecast 2023-2028 ($ million)
- Exhibits68: Chart on Animal feed and pet food - Year-over-year growth 2023-2028 (%)
- Exhibits69: Data Table on Animal feed and pet food - Year-over-year growth 2023-2028 (%)
- Exhibits70: Market opportunity by Application ($ million)
- Exhibits71: Data Table on Market opportunity by Application ($ million)
- Exhibits72: Analysis of price sensitivity, lifecycle, customer purchase basket, adoption rates, and purchase criteria
- Exhibits73: Chart on Market share By Geographical Landscape 2023-2028 (%)
- Exhibits74: Data Table on Market share By Geographical Landscape 2023-2028 (%)
- Exhibits75: Chart on Geographic comparison
- Exhibits76: Data Table on Geographic comparison
- Exhibits77: Chart on North America - Market size and forecast 2023-2028 ($ million)
- Exhibits78: Data Table on North America - Market size and forecast 2023-2028 ($ million)
- Exhibits79: Chart on North America - Year-over-year growth 2023-2028 (%)
- Exhibits80: Data Table on North America - Year-over-year growth 2023-2028 (%)
- Exhibits81: Chart on Europe - Market size and forecast 2023-2028 ($ million)
- Exhibits82: Data Table on Europe - Market size and forecast 2023-2028 ($ million)
- Exhibits83: Chart on Europe - Year-over-year growth 2023-2028 (%)
- Exhibits84: Data Table on Europe - Year-over-year growth 2023-2028 (%)
- Exhibits85: Chart on APAC - Market size and forecast 2023-2028 ($ million)
- Exhibits86: Data Table on APAC - Market size and forecast 2023-2028 ($ million)
- Exhibits87: Chart on APAC - Year-over-year growth 2023-2028 (%)
- Exhibits88: Data Table on APAC - Year-over-year growth 2023-2028 (%)
- Exhibits89: Chart on South America - Market size and forecast 2023-2028 ($ million)
- Exhibits90: Data Table on South America - Market size and forecast 2023-2028 ($ million)
- Exhibits91: Chart on South America - Year-over-year growth 2023-2028 (%)
- Exhibits92: Data Table on South America - Year-over-year growth 2023-2028 (%)
- Exhibits93: Chart on Middle East and Africa - Market size and forecast 2023-2028 ($ million)
- Exhibits94: Data Table on Middle East and Africa - Market size and forecast 2023-2028 ($ million)
- Exhibits95: Chart on Middle East and Africa - Year-over-year growth 2023-2028 (%)
- Exhibits96: Data Table on Middle East and Africa - Year-over-year growth 2023-2028 (%)
- Exhibits97: Chart on US - Market size and forecast 2023-2028 ($ million)
- Exhibits98: Data Table on US - Market size and forecast 2023-2028 ($ million)
- Exhibits99: Chart on US - Year-over-year growth 2023-2028 (%)
- Exhibits100: Data Table on US - Year-over-year growth 2023-2028 (%)
- Exhibits101: Chart on Germany - Market size and forecast 2023-2028 ($ million)
- Exhibits102: Data Table on Germany - Market size and forecast 2023-2028 ($ million)
- Exhibits103: Chart on Germany - Year-over-year growth 2023-2028 (%)
- Exhibits104: Data Table on Germany - Year-over-year growth 2023-2028 (%)
- Exhibits105: Chart on UK - Market size and forecast 2023-2028 ($ million)
- Exhibits106: Data Table on UK - Market size and forecast 2023-2028 ($ million)
- Exhibits107: Chart on UK - Year-over-year growth 2023-2028 (%)
- Exhibits108: Data Table on UK - Year-over-year growth 2023-2028 (%)
- Exhibits109: Chart on China - Market size and forecast 2023-2028 ($ million)
- Exhibits110: Data Table on China - Market size and forecast 2023-2028 ($ million)
- Exhibits111: Chart on China - Year-over-year growth 2023-2028 (%)
- Exhibits112: Data Table on China - Year-over-year growth 2023-2028 (%)
- Exhibits113: Chart on France - Market size and forecast 2023-2028 ($ million)
- Exhibits114: Data Table on France - Market size and forecast 2023-2028 ($ million)
- Exhibits115: Chart on France - Year-over-year growth 2023-2028 (%)
- Exhibits116: Data Table on France - Year-over-year growth 2023-2028 (%)
- Exhibits117: Market opportunity By Geographical Landscape ($ million)
- Exhibits118: Data Tables on Market opportunity By Geographical Landscape ($ million)
- Exhibits119: Impact of drivers and challenges in 2023 and 2028
- Exhibits120: Overview on criticality of inputs and factors of differentiation
- Exhibits121: Overview on factors of disruption
- Exhibits122: Impact of key risks on business
- Exhibits123: Companies covered
- Exhibits124: Matrix on companies position and classification
- Exhibits125: Abbott Laboratories - Overview
- Exhibits126: Abbott Laboratories - Business segments
- Exhibits127: Abbott Laboratories - Key news
- Exhibits128: Abbott Laboratories - Key offerings
- Exhibits129: Abbott Laboratories - Segment focus
- Exhibits130: Arla Foods amba - Overview
- Exhibits131: Arla Foods amba - Product / Service
- Exhibits132: Arla Foods amba - Key offerings
- Exhibits133: Carbery Food Ingredients Ltd. - Overview
- Exhibits134: Carbery Food Ingredients Ltd. - Product / Service
- Exhibits135: Carbery Food Ingredients Ltd. - Key news
- Exhibits136: Carbery Food Ingredients Ltd. - Key offerings
- Exhibits137: Dairy Farmers of America Inc. - Overview
- Exhibits138: Dairy Farmers of America Inc. - Product / Service
- Exhibits139: Dairy Farmers of America Inc. - Key offerings
- Exhibits140: Danone SA - Overview
- Exhibits141: Danone SA - Business segments
- Exhibits142: Danone SA - Key news
- Exhibits143: Danone SA - Key offerings
- Exhibits144: Danone SA - Segment focus
- Exhibits145: DMK Deutsches Milchkontor GmbH - Overview
- Exhibits146: DMK Deutsches Milchkontor GmbH - Product / Service
- Exhibits147: DMK Deutsches Milchkontor GmbH - Key offerings
- Exhibits148: Fonterra Cooperative Group Ltd. - Overview
- Exhibits149: Fonterra Cooperative Group Ltd. - Business segments
- Exhibits150: Fonterra Cooperative Group Ltd. - Key news
- Exhibits151: Fonterra Cooperative Group Ltd. - Key offerings
- Exhibits152: Fonterra Cooperative Group Ltd. - Segment focus
- Exhibits153: Glanbia plc - Overview
- Exhibits154: Glanbia plc - Business segments
- Exhibits155: Glanbia plc - Key news
- Exhibits156: Glanbia plc - Key offerings
- Exhibits157: Glanbia plc - Segment focus
- Exhibits158: Hilmar Cheese Co. Inc. - Overview
- Exhibits159: Hilmar Cheese Co. Inc. - Product / Service
- Exhibits160: Hilmar Cheese Co. Inc. - Key offerings
- Exhibits161: Kaserei Champignon Hofmeister - Overview
- Exhibits162: Kaserei Champignon Hofmeister - Product / Service
- Exhibits163: Kaserei Champignon Hofmeister - Key offerings
- Exhibits164: LACTALIS Ingredients - Overview
- Exhibits165: LACTALIS Ingredients - Product / Service
- Exhibits166: LACTALIS Ingredients - Key offerings
- Exhibits167: Leprino Foods Co. - Overview
- Exhibits168: Leprino Foods Co. - Product / Service
- Exhibits169: Leprino Foods Co. - Key offerings
- Exhibits170: Milk Specialties Global - Overview
- Exhibits171: Milk Specialties Global - Key offerings
- Exhibits172: Nestle SA - Overview
- Exhibits173: Nestle SA - Business segments
- Exhibits174: Nestle SA - Key news
- Exhibits175: Nestle SA - Key offerings
- Exhibits176: Nestle SA - Segment focus
- Exhibits177: Saputo Inc. - Overview
- Exhibits178: Saputo Inc. - Business segments
- Exhibits179: Saputo Inc. - Key news
- Exhibits180: Saputo Inc. - Key offerings
- Exhibits181: Saputo Inc. - Segment focus
- Exhibits182: Inclusions checklist
- Exhibits183: Exclusions checklist
- Exhibits184: Currency conversion rates for US$
- Exhibits185: Research methodology
- Exhibits186: Information sources
- Exhibits187: Data validation
- Exhibits188: Validation techniques employed for market sizing
- Exhibits189: Data synthesis
- Exhibits190: 360 degree market analysis
- Exhibits191: List of abbreviations
The whey protein market is forecasted to grow by USD 5525.8 mn during 2023-2028, accelerating at a CAGR of 8.09% during the forecast period. The report on the whey protein market provides a holistic analysis, market size and forecast, trends, growth drivers, and challenges, as well as vendor analysis covering around 25 vendors.
The report offers an up-to-date analysis regarding the current market scenario, the latest trends and drivers, and the overall market environment. The market is driven by increasing product launches, rising awareness of health benefits of whey, and wide application of whey protein.
Technavio's whey protein market is segmented as below:
| Market Scope | |
|---|---|
| Base Year | 2024 |
| End Year | 2028 |
| Series Year | 2024-2028 |
| Growth Momentum | Accelerate |
| YOY 2024 | 7.32% |
| CAGR | 8.09% |
| Incremental Value | $5525.8 mn |
By Product
- Whey protein concentrates
- Whey protein hydrolysates
- Whey protein isolates
By Application
- Food and beverages
- Nutritional supplements
- Personal care
- Animal feed and pet food
By Geographical Landscape
- North America
- Europe
- APAC
- South America
- Middle East and Africa
This study identifies the increasing use of whey protein in clinical nutrition as one of the prime reasons driving the whey protein market growth during the next few years. Also, strategic activities of vendors and increasing use of e-commerce channel for sales will lead to sizable demand in the market.
The report on the whey protein market covers the following areas:
- Whey protein market sizing
- Whey protein market forecast
- Whey protein market industry analysis
The robust vendor analysis is designed to help clients improve their market position, and in line with this, this report provides a detailed analysis of several leading whey protein market vendors that include Abbott Laboratories, Agropur Dairy Cooperative, AMCO Proteins, Arla Foods amba, Carbery Food Ingredients Ltd., Dairy Farmers of America Inc., Danone SA, DMK Deutsches Milchkontor GmbH, Fonterra Cooperative Group Ltd., Glanbia plc, Hilmar Cheese Co. Inc., Inner Mongolia Yili Industrial Group Co. Ltd., Kaserei Champignon Hofmeister, LACTALIS Ingredients, Leprino Foods Co., Milk Specialties Global, Nagase and Co. Ltd., Nestle SA, Saputo Inc., and Zoic Pharmaceuticals Pvt. Ltd.. Also, the whey protein market analysis report includes information on upcoming trends and challenges that will influence market growth. This is to help companies strategize and leverage all forthcoming growth opportunities.
The study was conducted using an objective combination of primary and secondary information including inputs from key participants in the industry. The report contains a comprehensive market and vendor landscape in addition to an analysis of the key vendors.
The publisher presents a detailed picture of the market by the way of study, synthesis, and summation of data from multiple sources by an analysis of key parameters such as profit, pricing, competition, and promotions. It presents various market facets by identifying the key industry influencers. The data presented is comprehensive, reliable, and a result of extensive research - both primary and secondary. The market research reports provide a complete competitive landscape and an in-depth vendor selection methodology and analysis using qualitative and quantitative research to forecast the accurate market growth.
Table of Contents
1 Executive Summary
- 1.1 Market overview
- Executive Summary - Chart on Market Overview
- Executive Summary - Data Table on Market Overview
- Executive Summary - Chart on Global Market Characteristics
- Executive Summary - Chart on Market By Geographical Landscape
- Executive Summary - Chart on Market Segmentation by Product
- Executive Summary - Chart on Market Segmentation by Application
- Executive Summary - Chart on Incremental Growth
- Executive Summary - Data Table on Incremental Growth
- Executive Summary - Chart on Company Market Positioning
2 Market Landscape
- 2.1 Market ecosystem
- Parent Market
- Data Table on - Parent Market
- 2.2 Market characteristics
- Market characteristics analysis
- 2.3 Value chain analysis
- Value Chain Analysis
3 Market Sizing
- 3.1 Market definition
- Offerings of companies included in the market definition
- 3.2 Market segment analysis
- Market segments
- 3.3 Market size 2023
- 3.4 Market outlook: Forecast for 2023-2028
- Chart on Global - Market size and forecast 2023-2028 ($ million)
- Data Table on Global - Market size and forecast 2023-2028 ($ million)
- Chart on Global Market: Year-over-year growth 2023-2028 (%)
- Data Table on Global Market: Year-over-year growth 2023-2028 (%)
4 Historic Market Size
- 4.1 Global Whey Protein Market 2018 - 2022
- Historic Market Size - Data Table on Global Whey Protein Market 2018 - 2022 ($ million)
- 4.2 Product segment analysis 2018 - 2022
- Historic Market Size - Product Segment 2018 - 2022 ($ million)
- 4.3 Application segment analysis 2018 - 2022
- Historic Market Size - Application Segment 2018 - 2022 ($ million)
- 4.4 Geography segment analysis 2018 - 2022
- Historic Market Size - Geography Segment 2018 - 2022 ($ million)
- 4.5 Country segment analysis 2018 - 2022
- Historic Market Size - Country Segment 2018 - 2022 ($ million)
5 Five Forces Analysis
- 5.1 Five forces summary
- Five forces analysis - Comparison between 2023 and 2028
- 5.2 Bargaining power of buyers
- Bargaining power of buyers - Impact of key factors 2023 and 2028
- 5.3 Bargaining power of suppliers
- Bargaining power of suppliers - Impact of key factors in 2023 and 2028
- 5.4 Threat of new entrants
- Threat of new entrants - Impact of key factors in 2023 and 2028
- 5.5 Threat of substitutes
- Threat of substitutes - Impact of key factors in 2023 and 2028
- 5.6 Threat of rivalry
- Threat of rivalry - Impact of key factors in 2023 and 2028
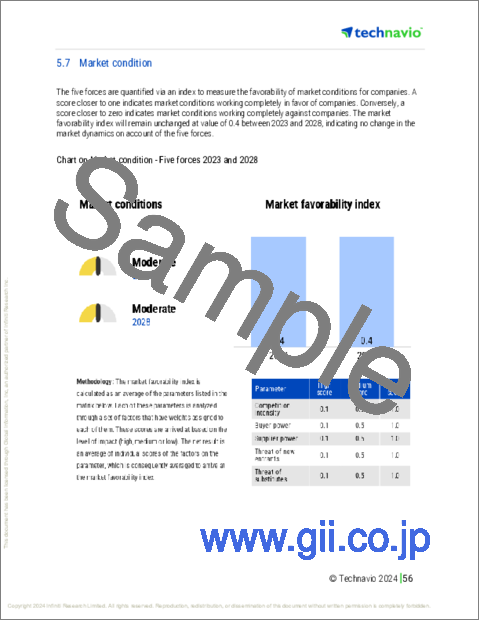
- 5.7 Market condition
- Chart on Market condition - Five forces 2023 and 2028
6 Market Segmentation by Product
- 6.1 Market segments
- Chart on Product - Market share 2023-2028 (%)
- Data Table on Product - Market share 2023-2028 (%)
- 6.2 Comparison by Product
- Chart on Comparison by Product
- Data Table on Comparison by Product
- 6.3 Whey protein concentrates - Market size and forecast 2023-2028
- Chart on Whey protein concentrates - Market size and forecast 2023-2028 ($ million)
- Data Table on Whey protein concentrates - Market size and forecast 2023-2028 ($ million)
- Chart on Whey protein concentrates - Year-over-year growth 2023-2028 (%)
- Data Table on Whey protein concentrates - Year-over-year growth 2023-2028 (%)
- 6.4 Whey protein hydrolysates - Market size and forecast 2023-2028
- Chart on Whey protein hydrolysates - Market size and forecast 2023-2028 ($ million)
- Data Table on Whey protein hydrolysates - Market size and forecast 2023-2028 ($ million)
- Chart on Whey protein hydrolysates - Year-over-year growth 2023-2028 (%)
- Data Table on Whey protein hydrolysates - Year-over-year growth 2023-2028 (%)
- 6.5 Whey protein isolates - Market size and forecast 2023-2028
- Chart on Whey protein isolates - Market size and forecast 2023-2028 ($ million)
- Data Table on Whey protein isolates - Market size and forecast 2023-2028 ($ million)
- Chart on Whey protein isolates - Year-over-year growth 2023-2028 (%)
- Data Table on Whey protein isolates - Year-over-year growth 2023-2028 (%)
- 6.6 Market opportunity by Product
- Market opportunity by Product ($ million)
- Data Table on Market opportunity by Product ($ million)
7 Market Segmentation by Application
- 7.1 Market segments
- Chart on Application - Market share 2023-2028 (%)
- Data Table on Application - Market share 2023-2028 (%)
- 7.2 Comparison by Application
- Chart on Comparison by Application
- Data Table on Comparison by Application
- 7.3 Food and beverages - Market size and forecast 2023-2028
- Chart on Food and beverages - Market size and forecast 2023-2028 ($ million)
- Data Table on Food and beverages - Market size and forecast 2023-2028 ($ million)
- Chart on Food and beverages - Year-over-year growth 2023-2028 (%)
- Data Table on Food and beverages - Year-over-year growth 2023-2028 (%)
- 7.4 Nutritional supplements - Market size and forecast 2023-2028
- Chart on Nutritional supplements - Market size and forecast 2023-2028 ($ million)
- Data Table on Nutritional supplements - Market size and forecast 2023-2028 ($ million)
- Chart on Nutritional supplements - Year-over-year growth 2023-2028 (%)
- Data Table on Nutritional supplements - Year-over-year growth 2023-2028 (%)
- 7.5 Personal care - Market size and forecast 2023-2028
- Chart on Personal care - Market size and forecast 2023-2028 ($ million)
- Data Table on Personal care - Market size and forecast 2023-2028 ($ million)
- Chart on Personal care - Year-over-year growth 2023-2028 (%)
- Data Table on Personal care - Year-over-year growth 2023-2028 (%)
- 7.6 Animal feed and pet food - Market size and forecast 2023-2028
- Chart on Animal feed and pet food - Market size and forecast 2023-2028 ($ million)
- Data Table on Animal feed and pet food - Market size and forecast 2023-2028 ($ million)
- Chart on Animal feed and pet food - Year-over-year growth 2023-2028 (%)
- Data Table on Animal feed and pet food - Year-over-year growth 2023-2028 (%)
- 7.7 Market opportunity by Application
- Market opportunity by Application ($ million)
- Data Table on Market opportunity by Application ($ million)
8 Customer Landscape
- 8.1 Customer landscape overview
- Analysis of price sensitivity, lifecycle, customer purchase basket, adoption rates, and purchase criteria
9 Geographic Landscape
- 9.1 Geographic segmentation
- Chart on Market share By Geographical Landscape 2023-2028 (%)
- Data Table on Market share By Geographical Landscape 2023-2028 (%)
- 9.2 Geographic comparison
- Chart on Geographic comparison
- Data Table on Geographic comparison
- 9.3 North America - Market size and forecast 2023-2028
- Chart on North America - Market size and forecast 2023-2028 ($ million)
- Data Table on North America - Market size and forecast 2023-2028 ($ million)
- Chart on North America - Year-over-year growth 2023-2028 (%)
- Data Table on North America - Year-over-year growth 2023-2028 (%)
- 9.4 Europe - Market size and forecast 2023-2028
- Chart on Europe - Market size and forecast 2023-2028 ($ million)
- Data Table on Europe - Market size and forecast 2023-2028 ($ million)
- Chart on Europe - Year-over-year growth 2023-2028 (%)
- Data Table on Europe - Year-over-year growth 2023-2028 (%)
- 9.5 APAC - Market size and forecast 2023-2028
- Chart on APAC - Market size and forecast 2023-2028 ($ million)
- Data Table on APAC - Market size and forecast 2023-2028 ($ million)
- Chart on APAC - Year-over-year growth 2023-2028 (%)
- Data Table on APAC - Year-over-year growth 2023-2028 (%)
- 9.6 South America - Market size and forecast 2023-2028
- Chart on South America - Market size and forecast 2023-2028 ($ million)
- Data Table on South America - Market size and forecast 2023-2028 ($ million)
- Chart on South America - Year-over-year growth 2023-2028 (%)
- Data Table on South America - Year-over-year growth 2023-2028 (%)
- 9.7 Middle East and Africa - Market size and forecast 2023-2028
- Chart on Middle East and Africa - Market size and forecast 2023-2028 ($ million)
- Data Table on Middle East and Africa - Market size and forecast 2023-2028 ($ million)
- Chart on Middle East and Africa - Year-over-year growth 2023-2028 (%)
- Data Table on Middle East and Africa - Year-over-year growth 2023-2028 (%)
- 9.8 US - Market size and forecast 2023-2028
- Chart on US - Market size and forecast 2023-2028 ($ million)
- Data Table on US - Market size and forecast 2023-2028 ($ million)
- Chart on US - Year-over-year growth 2023-2028 (%)
- Data Table on US - Year-over-year growth 2023-2028 (%)
- 9.9 Germany - Market size and forecast 2023-2028
- Chart on Germany - Market size and forecast 2023-2028 ($ million)
- Data Table on Germany - Market size and forecast 2023-2028 ($ million)
- Chart on Germany - Year-over-year growth 2023-2028 (%)
- Data Table on Germany - Year-over-year growth 2023-2028 (%)
- 9.10 UK - Market size and forecast 2023-2028
- Chart on UK - Market size and forecast 2023-2028 ($ million)
- Data Table on UK - Market size and forecast 2023-2028 ($ million)
- Chart on UK - Year-over-year growth 2023-2028 (%)
- Data Table on UK - Year-over-year growth 2023-2028 (%)
- 9.11 China - Market size and forecast 2023-2028
- Chart on China - Market size and forecast 2023-2028 ($ million)
- Data Table on China - Market size and forecast 2023-2028 ($ million)
- Chart on China - Year-over-year growth 2023-2028 (%)
- Data Table on China - Year-over-year growth 2023-2028 (%)
- 9.12 France - Market size and forecast 2023-2028
- Chart on France - Market size and forecast 2023-2028 ($ million)
- Data Table on France - Market size and forecast 2023-2028 ($ million)
- Chart on France - Year-over-year growth 2023-2028 (%)
- Data Table on France - Year-over-year growth 2023-2028 (%)
- 9.13 Market opportunity By Geographical Landscape
- Market opportunity By Geographical Landscape ($ million)
- Data Tables on Market opportunity By Geographical Landscape ($ million)
10 Drivers, Challenges, and Opportunity/Restraints
- 10.1 Market drivers
- 10.2 Market challenges
- 10.3 Impact of drivers and challenges
- Impact of drivers and challenges in 2023 and 2028
- 10.4 Market opportunities/restraints
11 Competitive Landscape
- 11.1 Overview
- 11.2 Competitive Landscape
- Overview on criticality of inputs and factors of differentiation
- 11.3 Landscape disruption
- Overview on factors of disruption
- 11.4 Industry risks
- Impact of key risks on business
12 Competitive Analysis
- 12.1 Companies profiled
- Companies covered
- 12.2 Market positioning of companies
- Matrix on companies position and classification
- 12.3 Abbott Laboratories
- Abbott Laboratories - Overview
- Abbott Laboratories - Business segments
- Abbott Laboratories - Key news
- Abbott Laboratories - Key offerings
- Abbott Laboratories - Segment focus
- 12.4 Arla Foods amba
- Arla Foods amba - Overview
- Arla Foods amba - Product / Service
- Arla Foods amba - Key offerings
- 12.5 Carbery Food Ingredients Ltd.
- Carbery Food Ingredients Ltd. - Overview
- Carbery Food Ingredients Ltd. - Product / Service
- Carbery Food Ingredients Ltd. - Key news
- Carbery Food Ingredients Ltd. - Key offerings
- 12.6 Dairy Farmers of America Inc.
- Dairy Farmers of America Inc. - Overview
- Dairy Farmers of America Inc. - Product / Service
- Dairy Farmers of America Inc. - Key offerings
- 12.7 Danone SA
- Danone SA - Overview
- Danone SA - Business segments
- Danone SA - Key news
- Danone SA - Key offerings
- Danone SA - Segment focus
- 12.8 DMK Deutsches Milchkontor GmbH
- DMK Deutsches Milchkontor GmbH - Overview
- DMK Deutsches Milchkontor GmbH - Product / Service
- DMK Deutsches Milchkontor GmbH - Key offerings
- 12.9 Fonterra Cooperative Group Ltd.
- Fonterra Cooperative Group Ltd. - Overview
- Fonterra Cooperative Group Ltd. - Business segments
- Fonterra Cooperative Group Ltd. - Key news
- Fonterra Cooperative Group Ltd. - Key offerings
- Fonterra Cooperative Group Ltd. - Segment focus
- 12.10 Glanbia plc
- Glanbia plc - Overview
- Glanbia plc - Business segments
- Glanbia plc - Key news
- Glanbia plc - Key offerings
- Glanbia plc - Segment focus
- 12.11 Hilmar Cheese Co. Inc.
- Hilmar Cheese Co. Inc. - Overview
- Hilmar Cheese Co. Inc. - Product / Service
- Hilmar Cheese Co. Inc. - Key offerings
- 12.12 Kaserei Champignon Hofmeister
- Kaserei Champignon Hofmeister - Overview
- Kaserei Champignon Hofmeister - Product / Service
- Kaserei Champignon Hofmeister - Key offerings
- 12.13 LACTALIS Ingredients
- LACTALIS Ingredients - Overview
- LACTALIS Ingredients - Product / Service
- LACTALIS Ingredients - Key offerings
- 12.14 Leprino Foods Co.
- Leprino Foods Co. - Overview
- Leprino Foods Co. - Product / Service
- Leprino Foods Co. - Key offerings
- 12.15 Milk Specialties Global
- Milk Specialties Global - Overview
- Milk Specialties Global - Key offerings
- 12.16 Nestle SA
- Nestle SA - Overview
- Nestle SA - Business segments
- Nestle SA - Key news
- Nestle SA - Key offerings
- Nestle SA - Segment focus
- 12.17 Saputo Inc.
- Saputo Inc. - Overview
- Saputo Inc. - Business segments
- Saputo Inc. - Key news
- Saputo Inc. - Key offerings
- Saputo Inc. - Segment focus
13 Appendix
- 13.1 Scope of the report
- 13.2 Inclusions and exclusions checklist
- Inclusions checklist
- Exclusions checklist
- 13.3 Currency conversion rates for US$
- Currency conversion rates for US$
- 13.4 Research methodology
- Research methodology
- 13.5 Data procurement
- Information sources
- 13.6 Data validation
- Data validation
- 13.7 Validation techniques employed for market sizing
- Validation techniques employed for market sizing
- 13.8 Data synthesis
- Data synthesis
- 13.9 360 degree market analysis
- 360 degree market analysis
- 13.10 List of abbreviations
- List of abbreviations

