|
|
市場調査レポート
商品コード
1544378
組織工学と再生の世界市場 2024-2028Global Tissue Engineering and Regeneration Market 2024-2028 |
||||||

|
|||||||
カスタマイズ可能
|
|||||||


| 組織工学と再生の世界市場 2024-2028 |
|
出版日: 2024年07月12日
発行: TechNavio
ページ情報: 英文 175 Pages
納期: 即納可能
|

全表示
- 概要
- 図表
- 目次
組織工学と再生市場は2023-2028年に283億米ドル、予測期間中のCAGRは16.86%で成長すると予測されます。
当レポートでは、組織工学と再生市場の全体的な分析、市場規模・予測、動向、成長促進要因、課題、約25のベンダーを網羅したベンダー分析などを掲載しています。
現在の市場シナリオ、最新動向と促進要因、市場環境全体に関する最新分析を提供しています。市場は、慢性疾患の有病率の増加、組織スキャフォールドの採用率の上昇、細胞ベースの組織工学研究に対する公的・民間ヘルスケア機関からの取り組みや支援の増加によって牽引されています。
| 市場範囲 | |
|---|---|
| 基準年 | 2024 |
| 終了年 | 2028 |
| 予測期間 | 2024-2028 |
| 成長モメンタム | 加速 |
| 前年比2024年 | 14.17% |
| CAGR | 16.86% |
| 増分額 | 283億米ドル |
本調査では、今後数年間の組織工学と再生市場の成長を促進する主な要因の1つとして、新たな技術的進歩を挙げています。また、組織工学と再生における臨床試験数の増加や戦略的提携・買収の増加も、市場の大きな需要につながります。
目次
第1章 エグゼクティブサマリー
- 市場概要
第2章 市場情勢
- 市場エコシステム
- 市場の特徴
- バリューチェーン分析
第3章 市場規模の評価
- 市場の定義
- 市場セグメント分析
- 市場規模 2023
- 市場の見通し 2023-2028
第4章 市場規模実績
- 組織工学と再生の世界市場 2018-2022
- 材料別セグメント分析 2018-2022
- 用途別セグメント分析 2018-2022
- 地域別セグメント分析 2018-2022
- 国別セグメント分析 2018-2022
第5章 ファイブフォース分析
- ファイブフォースの要約
- 買い手の交渉力
- 供給企業の交渉力
- 新規参入業者の脅威
- 代替品の脅威
- 競争の脅威
- 市況
第6章 市場セグメンテーション:材料別
- 市場セグメンテーション
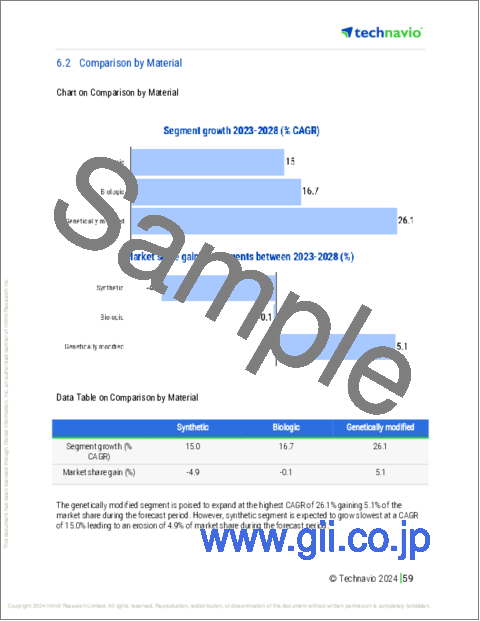
- 比較:材料別
- 合成:市場規模と予測 2023-2028
- 生物学的:市場規模と予測 2023-2028
- 遺伝子組み換え:市場規模と予測 2023-2028
- 市場機会:材料別
第7章 市場セグメンテーション:用途別
- 市場セグメンテーション
- 比較:用途別
- 整形外科の筋骨格と脊椎:市場規模と予測 2023-2028
- 皮膚科:市場規模と予測 2023-2028
- 神経学:市場規模と予測 2023-2028
- その他:市場規模と予測 2023-2028
- 市場機会:用途別
第8章 顧客情勢
- 顧客情勢の概要
第9章 地域別情勢
- 地域別セグメンテーション
- 比較:地域別
- 北米:市場規模と予測 2023-2028
- 欧州:市場規模と予測 2023-2028
- アジア:市場規模と予測 2023-2028
- 世界のその他の地域:市場規模と予測 2023-2028
- 米国:市場規模と予測 2023-2028
- ドイツ:市場規模と予測 2023-2028
- 英国:市場規模と予測 2023-2028
- カナダ:市場規模と予測 2023-2028
- 中国:市場規模と予測 2023-2028
- 市場機会:地域別
第10章 促進要因・課題・機会・抑制要因
- 市場促進要因
- 市場の課題
- 促進要因と課題の影響
- 市場の機会・抑制要因
第11章 競合情勢
- 概要
- 競合情勢
- 混乱の状況
- 業界のリスク
第12章 競合分析
- 企業プロファイル
- 企業の市場ポジショニング
- AbbVie Inc.
- B.Braun SE
- Baxter International Inc.
- Becton Dickinson and Co.
- Cook Group Inc.
- Integra Lifesciences Corp.
- Johnson and Johnson Services Inc.
- Medtronic Plc
- Organogenesis Holdings Inc.
- RTI Surgical Inc.
- Smith and Nephew plc
- Stryker Corp.
- Tissue Regenix Group Plc
- Zimmer Biomet Holdings Inc.
第13章 付録
Exhibits:
- Exhibits1: Executive Summary - Chart on Market Overview
- Exhibits2: Executive Summary - Data Table on Market Overview
- Exhibits3: Executive Summary - Chart on Global Market Characteristics
- Exhibits4: Executive Summary - Chart on Market By Geographical Landscape
- Exhibits5: Executive Summary - Chart on Market Segmentation by Material
- Exhibits6: Executive Summary - Chart on Market Segmentation by Application
- Exhibits7: Executive Summary - Chart on Incremental Growth
- Exhibits8: Executive Summary - Data Table on Incremental Growth
- Exhibits9: Executive Summary - Chart on Company Market Positioning
- Exhibits10: Parent Market
- Exhibits11: Data Table on - Parent Market
- Exhibits12: Market characteristics analysis
- Exhibits13: Value Chain Analysis
- Exhibits14: Offerings of companies included in the market definition
- Exhibits15: Market segments
- Exhibits16: Chart on Global - Market size and forecast 2023-2028 ($ billion)
- Exhibits17: Data Table on Global - Market size and forecast 2023-2028 ($ billion)
- Exhibits18: Chart on Global Market: Year-over-year growth 2023-2028 (%)
- Exhibits19: Data Table on Global Market: Year-over-year growth 2023-2028 (%)
- Exhibits20: Historic Market Size - Data Table on Global Tissue Engineering And Regeneration Market 2018 - 2022 ($ billion)
- Exhibits21: Historic Market Size - Material Segment 2018 - 2022 ($ billion)
- Exhibits22: Historic Market Size - Application Segment 2018 - 2022 ($ billion)
- Exhibits23: Historic Market Size - Geography Segment 2018 - 2022 ($ billion)
- Exhibits24: Historic Market Size - Country Segment 2018 - 2022 ($ billion)
- Exhibits25: Five forces analysis - Comparison between 2023 and 2028
- Exhibits26: Bargaining power of buyers - Impact of key factors 2023 and 2028
- Exhibits27: Bargaining power of suppliers - Impact of key factors in 2023 and 2028
- Exhibits28: Threat of new entrants - Impact of key factors in 2023 and 2028
- Exhibits29: Threat of substitutes - Impact of key factors in 2023 and 2028
- Exhibits30: Threat of rivalry - Impact of key factors in 2023 and 2028
- Exhibits31: Chart on Market condition - Five forces 2023 and 2028
- Exhibits32: Chart on Material - Market share 2023-2028 (%)
- Exhibits33: Data Table on Material - Market share 2023-2028 (%)
- Exhibits34: Chart on Comparison by Material
- Exhibits35: Data Table on Comparison by Material
- Exhibits36: Chart on Synthetic - Market size and forecast 2023-2028 ($ billion)
- Exhibits37: Data Table on Synthetic - Market size and forecast 2023-2028 ($ billion)
- Exhibits38: Chart on Synthetic - Year-over-year growth 2023-2028 (%)
- Exhibits39: Data Table on Synthetic - Year-over-year growth 2023-2028 (%)
- Exhibits40: Chart on Biologic - Market size and forecast 2023-2028 ($ billion)
- Exhibits41: Data Table on Biologic - Market size and forecast 2023-2028 ($ billion)
- Exhibits42: Chart on Biologic - Year-over-year growth 2023-2028 (%)
- Exhibits43: Data Table on Biologic - Year-over-year growth 2023-2028 (%)
- Exhibits44: Chart on Genetically modified - Market size and forecast 2023-2028 ($ billion)
- Exhibits45: Data Table on Genetically modified - Market size and forecast 2023-2028 ($ billion)
- Exhibits46: Chart on Genetically modified - Year-over-year growth 2023-2028 (%)
- Exhibits47: Data Table on Genetically modified - Year-over-year growth 2023-2028 (%)
- Exhibits48: Market opportunity by Material ($ billion)
- Exhibits49: Data Table on Market opportunity by Material ($ billion)
- Exhibits50: Chart on Application - Market share 2023-2028 (%)
- Exhibits51: Data Table on Application - Market share 2023-2028 (%)
- Exhibits52: Chart on Comparison by Application
- Exhibits53: Data Table on Comparison by Application
- Exhibits54: Chart on Orthopedic musculoskeletal and spine - Market size and forecast 2023-2028 ($ billion)
- Exhibits55: Data Table on Orthopedic musculoskeletal and spine - Market size and forecast 2023-2028 ($ billion)
- Exhibits56: Chart on Orthopedic musculoskeletal and spine - Year-over-year growth 2023-2028 (%)
- Exhibits57: Data Table on Orthopedic musculoskeletal and spine - Year-over-year growth 2023-2028 (%)
- Exhibits58: Chart on Dermatology - Market size and forecast 2023-2028 ($ billion)
- Exhibits59: Data Table on Dermatology - Market size and forecast 2023-2028 ($ billion)
- Exhibits60: Chart on Dermatology - Year-over-year growth 2023-2028 (%)
- Exhibits61: Data Table on Dermatology - Year-over-year growth 2023-2028 (%)
- Exhibits62: Chart on Neurology - Market size and forecast 2023-2028 ($ billion)
- Exhibits63: Data Table on Neurology - Market size and forecast 2023-2028 ($ billion)
- Exhibits64: Chart on Neurology - Year-over-year growth 2023-2028 (%)
- Exhibits65: Data Table on Neurology - Year-over-year growth 2023-2028 (%)
- Exhibits66: Chart on Others - Market size and forecast 2023-2028 ($ billion)
- Exhibits67: Data Table on Others - Market size and forecast 2023-2028 ($ billion)
- Exhibits68: Chart on Others - Year-over-year growth 2023-2028 (%)
- Exhibits69: Data Table on Others - Year-over-year growth 2023-2028 (%)
- Exhibits70: Market opportunity by Application ($ billion)
- Exhibits71: Data Table on Market opportunity by Application ($ billion)
- Exhibits72: Analysis of price sensitivity, lifecycle, customer purchase basket, adoption rates, and purchase criteria
- Exhibits73: Chart on Market share By Geographical Landscape 2023-2028 (%)
- Exhibits74: Data Table on Market share By Geographical Landscape 2023-2028 (%)
- Exhibits75: Chart on Geographic comparison
- Exhibits76: Data Table on Geographic comparison
- Exhibits77: Chart on North America - Market size and forecast 2023-2028 ($ billion)
- Exhibits78: Data Table on North America - Market size and forecast 2023-2028 ($ billion)
- Exhibits79: Chart on North America - Year-over-year growth 2023-2028 (%)
- Exhibits80: Data Table on North America - Year-over-year growth 2023-2028 (%)
- Exhibits81: Chart on Europe - Market size and forecast 2023-2028 ($ billion)
- Exhibits82: Data Table on Europe - Market size and forecast 2023-2028 ($ billion)
- Exhibits83: Chart on Europe - Year-over-year growth 2023-2028 (%)
- Exhibits84: Data Table on Europe - Year-over-year growth 2023-2028 (%)
- Exhibits85: Chart on Asia - Market size and forecast 2023-2028 ($ billion)
- Exhibits86: Data Table on Asia - Market size and forecast 2023-2028 ($ billion)
- Exhibits87: Chart on Asia - Year-over-year growth 2023-2028 (%)
- Exhibits88: Data Table on Asia - Year-over-year growth 2023-2028 (%)
- Exhibits89: Chart on Rest of World (ROW) - Market size and forecast 2023-2028 ($ billion)
- Exhibits90: Data Table on Rest of World (ROW) - Market size and forecast 2023-2028 ($ billion)
- Exhibits91: Chart on Rest of World (ROW) - Year-over-year growth 2023-2028 (%)
- Exhibits92: Data Table on Rest of World (ROW) - Year-over-year growth 2023-2028 (%)
- Exhibits93: Chart on US - Market size and forecast 2023-2028 ($ billion)
- Exhibits94: Data Table on US - Market size and forecast 2023-2028 ($ billion)
- Exhibits95: Chart on US - Year-over-year growth 2023-2028 (%)
- Exhibits96: Data Table on US - Year-over-year growth 2023-2028 (%)
- Exhibits97: Chart on Germany - Market size and forecast 2023-2028 ($ billion)
- Exhibits98: Data Table on Germany - Market size and forecast 2023-2028 ($ billion)
- Exhibits99: Chart on Germany - Year-over-year growth 2023-2028 (%)
- Exhibits100: Data Table on Germany - Year-over-year growth 2023-2028 (%)
- Exhibits101: Chart on UK - Market size and forecast 2023-2028 ($ billion)
- Exhibits102: Data Table on UK - Market size and forecast 2023-2028 ($ billion)
- Exhibits103: Chart on UK - Year-over-year growth 2023-2028 (%)
- Exhibits104: Data Table on UK - Year-over-year growth 2023-2028 (%)
- Exhibits105: Chart on Canada - Market size and forecast 2023-2028 ($ billion)
- Exhibits106: Data Table on Canada - Market size and forecast 2023-2028 ($ billion)
- Exhibits107: Chart on Canada - Year-over-year growth 2023-2028 (%)
- Exhibits108: Data Table on Canada - Year-over-year growth 2023-2028 (%)
- Exhibits109: Chart on China - Market size and forecast 2023-2028 ($ billion)
- Exhibits110: Data Table on China - Market size and forecast 2023-2028 ($ billion)
- Exhibits111: Chart on China - Year-over-year growth 2023-2028 (%)
- Exhibits112: Data Table on China - Year-over-year growth 2023-2028 (%)
- Exhibits113: Market opportunity By Geographical Landscape ($ billion)
- Exhibits114: Data Tables on Market opportunity By Geographical Landscape ($ billion)
- Exhibits115: Impact of drivers and challenges in 2023 and 2028
- Exhibits116: Overview on criticality of inputs and factors of differentiation
- Exhibits117: Overview on factors of disruption
- Exhibits118: Impact of key risks on business
- Exhibits119: Companies covered
- Exhibits120: Matrix on companies position and classification
- Exhibits121: 3M Co. - Overview
- Exhibits122: 3M Co. - Business segments
- Exhibits123: 3M Co. - Key news
- Exhibits124: 3M Co. - Key offerings
- Exhibits125: 3M Co. - Segment focus
- Exhibits126: AbbVie Inc. - Overview
- Exhibits127: AbbVie Inc. - Product / Service
- Exhibits128: AbbVie Inc. - Key news
- Exhibits129: AbbVie Inc. - Key offerings
- Exhibits130: B.Braun SE - Overview
- Exhibits131: B.Braun SE - Business segments
- Exhibits132: B.Braun SE - Key news
- Exhibits133: B.Braun SE - Key offerings
- Exhibits134: B.Braun SE - Segment focus
- Exhibits135: Baxter International Inc. - Overview
- Exhibits136: Baxter International Inc. - Business segments
- Exhibits137: Baxter International Inc. - Key news
- Exhibits138: Baxter International Inc. - Key offerings
- Exhibits139: Baxter International Inc. - Segment focus
- Exhibits140: Becton Dickinson and Co. - Overview
- Exhibits141: Becton Dickinson and Co. - Business segments
- Exhibits142: Becton Dickinson and Co. - Key news
- Exhibits143: Becton Dickinson and Co. - Key offerings
- Exhibits144: Becton Dickinson and Co. - Segment focus
- Exhibits145: Cook Group Inc. - Overview
- Exhibits146: Cook Group Inc. - Product / Service
- Exhibits147: Cook Group Inc. - Key news
- Exhibits148: Cook Group Inc. - Key offerings
- Exhibits149: Integra Lifesciences Corp. - Overview
- Exhibits150: Integra Lifesciences Corp. - Business segments
- Exhibits151: Integra Lifesciences Corp. - Key news
- Exhibits152: Integra Lifesciences Corp. - Key offerings
- Exhibits153: Integra Lifesciences Corp. - Segment focus
- Exhibits154: Johnson and Johnson Services Inc. - Overview
- Exhibits155: Johnson and Johnson Services Inc. - Business segments
- Exhibits156: Johnson and Johnson Services Inc. - Key news
- Exhibits157: Johnson and Johnson Services Inc. - Key offerings
- Exhibits158: Johnson and Johnson Services Inc. - Segment focus
- Exhibits159: Medtronic Plc - Overview
- Exhibits160: Medtronic Plc - Business segments
- Exhibits161: Medtronic Plc - Key news
- Exhibits162: Medtronic Plc - Key offerings
- Exhibits163: Medtronic Plc - Segment focus
- Exhibits164: Organogenesis Holdings Inc. - Overview
- Exhibits165: Organogenesis Holdings Inc. - Product / Service
- Exhibits166: Organogenesis Holdings Inc. - Key offerings
- Exhibits167: RTI Surgical Inc. - Overview
- Exhibits168: RTI Surgical Inc. - Product / Service
- Exhibits169: RTI Surgical Inc. - Key offerings
- Exhibits170: Smith and Nephew plc - Overview
- Exhibits171: Smith and Nephew plc - Business segments
- Exhibits172: Smith and Nephew plc - Key news
- Exhibits173: Smith and Nephew plc - Key offerings
- Exhibits174: Smith and Nephew plc - Segment focus
- Exhibits175: Stryker Corp. - Overview
- Exhibits176: Stryker Corp. - Business segments
- Exhibits177: Stryker Corp. - Key news
- Exhibits178: Stryker Corp. - Key offerings
- Exhibits179: Stryker Corp. - Segment focus
- Exhibits180: Tissue Regenix Group Plc - Overview
- Exhibits181: Tissue Regenix Group Plc - Business segments
- Exhibits182: Tissue Regenix Group Plc - Key offerings
- Exhibits183: Tissue Regenix Group Plc - Segment focus
- Exhibits184: Zimmer Biomet Holdings Inc. - Overview
- Exhibits185: Zimmer Biomet Holdings Inc. - Business segments
- Exhibits186: Zimmer Biomet Holdings Inc. - Key news
- Exhibits187: Zimmer Biomet Holdings Inc. - Key offerings
- Exhibits188: Zimmer Biomet Holdings Inc. - Segment focus
- Exhibits189: Inclusions checklist
- Exhibits190: Exclusions checklist
- Exhibits191: Currency conversion rates for US$
- Exhibits192: Research methodology
- Exhibits193: Information sources
- Exhibits194: Data validation
- Exhibits195: Validation techniques employed for market sizing
- Exhibits196: Data synthesis
- Exhibits197: 360 degree market analysis
- Exhibits198: List of abbreviations
The tissue engineering and regeneration market is forecasted to grow by USD 28.3 bn during 2023-2028, accelerating at a CAGR of 16.86% during the forecast period. The report on the tissue engineering and regeneration market provides a holistic analysis, market size and forecast, trends, growth drivers, and challenges, as well as vendor analysis covering around 25 vendors.
The report offers an up-to-date analysis regarding the current market scenario, the latest trends and drivers, and the overall market environment. The market is driven by increasing prevalence of chronic diseases, rising adoption of tissue scaffolds, and increasing initiatives and support from public and private healthcare organizations for cell-based tissue engineering research.
Technavio's tissue engineering and regeneration market is segmented as below:
| Market Scope | |
|---|---|
| Base Year | 2024 |
| End Year | 2028 |
| Series Year | 2024-2028 |
| Growth Momentum | Accelerate |
| YOY 2024 | 14.17% |
| CAGR | 16.86% |
| Incremental Value | $28.3 bn |
By Material
- Synthetic
- Biologic
- Genetically modified
By Application
- Orthopedic musculoskeletal and spine
- Dermatology
- Neurology
- Others
By Geographical Landscape
- North America
- Europe
- Asia
- Rest of World (ROW)
This study identifies the emerging technological advances as one of the prime reasons driving the tissue engineering and regeneration market growth during the next few years. Also, increasing number of clinical trials and increasing strategic partnerships and acquisitions in tissue engineering and regeneration will lead to sizable demand in the market.
The report on the tissue engineering and regeneration market covers the following areas:
- Tissue engineering and regeneration market sizing
- Tissue engineering and regeneration market forecast
- Tissue engineering and regeneration market industry analysis
The robust vendor analysis is designed to help clients improve their market position, and in line with this, this report provides a detailed analysis of several leading tissue engineering and regeneration market vendors that include 3M Co., AbbVie Inc., Astellas Pharma Inc., B.Braun SE, Baxter International Inc., Becton Dickinson and Co., CO.DON GmbH, Cook Group Inc., Integra Lifesciences Corp., Johnson and Johnson Services Inc., Medtronic PLC, Organogenesis Holdings Inc., Plus Therapeutics Inc., REPROCELL Inc., RTI Surgical Inc., Smith and Nephew PLC, Stryker Corp., Tissue Regenix Group PLC, Vericel Corp., and Zimmer Biomet Holdings Inc.. Also, the tissue engineering and regeneration market analysis report includes information on upcoming trends and challenges that will influence market growth. This is to help companies strategize and leverage all forthcoming growth opportunities.
The study was conducted using an objective combination of primary and secondary information including inputs from key participants in the industry. The report contains a comprehensive market and vendor landscape in addition to an analysis of the key vendors.
The publisher presents a detailed picture of the market by the way of study, synthesis, and summation of data from multiple sources by an analysis of key parameters such as profit, pricing, competition, and promotions. It presents various market facets by identifying the key industry influencers. The data presented is comprehensive, reliable, and a result of extensive research - both primary and secondary. The market research reports provide a complete competitive landscape and an in-depth vendor selection methodology and analysis using qualitative and quantitative research to forecast the accurate market growth.
Table of Contents
1 Executive Summary
- 1.1 Market overview
- Executive Summary - Chart on Market Overview
- Executive Summary - Data Table on Market Overview
- Executive Summary - Chart on Global Market Characteristics
- Executive Summary - Chart on Market By Geographical Landscape
- Executive Summary - Chart on Market Segmentation by Material
- Executive Summary - Chart on Market Segmentation by Application
- Executive Summary - Chart on Incremental Growth
- Executive Summary - Data Table on Incremental Growth
- Executive Summary - Chart on Company Market Positioning
2 Market Landscape
- 2.1 Market ecosystem
- Parent Market
- Data Table on - Parent Market
- 2.2 Market characteristics
- Market characteristics analysis
- 2.3 Value chain analysis
- Value Chain Analysis
3 Market Sizing
- 3.1 Market definition
- Offerings of companies included in the market definition
- 3.2 Market segment analysis
- Market segments
- 3.3 Market size 2023
- 3.4 Market outlook: Forecast for 2023-2028
- Chart on Global - Market size and forecast 2023-2028 ($ billion)
- Data Table on Global - Market size and forecast 2023-2028 ($ billion)
- Chart on Global Market: Year-over-year growth 2023-2028 (%)
- Data Table on Global Market: Year-over-year growth 2023-2028 (%)
4 Historic Market Size
- 4.1 Global Tissue Engineering And Regeneration Market 2018 - 2022
- Historic Market Size - Data Table on Global Tissue Engineering And Regeneration Market 2018 - 2022 ($ billion)
- 4.2 Material segment analysis 2018 - 2022
- Historic Market Size - Material Segment 2018 - 2022 ($ billion)
- 4.3 Application segment analysis 2018 - 2022
- Historic Market Size - Application Segment 2018 - 2022 ($ billion)
- 4.4 Geography segment analysis 2018 - 2022
- Historic Market Size - Geography Segment 2018 - 2022 ($ billion)
- 4.5 Country segment analysis 2018 - 2022
- Historic Market Size - Country Segment 2018 - 2022 ($ billion)
5 Five Forces Analysis
- 5.1 Five forces summary
- Five forces analysis - Comparison between 2023 and 2028
- 5.2 Bargaining power of buyers
- Bargaining power of buyers - Impact of key factors 2023 and 2028
- 5.3 Bargaining power of suppliers
- Bargaining power of suppliers - Impact of key factors in 2023 and 2028
- 5.4 Threat of new entrants
- Threat of new entrants - Impact of key factors in 2023 and 2028
- 5.5 Threat of substitutes
- Threat of substitutes - Impact of key factors in 2023 and 2028
- 5.6 Threat of rivalry
- Threat of rivalry - Impact of key factors in 2023 and 2028
- 5.7 Market condition
- Chart on Market condition - Five forces 2023 and 2028
6 Market Segmentation by Material
- 6.1 Market segments
- Chart on Material - Market share 2023-2028 (%)
- Data Table on Material - Market share 2023-2028 (%)
- 6.2 Comparison by Material
- Chart on Comparison by Material
- Data Table on Comparison by Material
- 6.3 Synthetic - Market size and forecast 2023-2028
- Chart on Synthetic - Market size and forecast 2023-2028 ($ billion)
- Data Table on Synthetic - Market size and forecast 2023-2028 ($ billion)
- Chart on Synthetic - Year-over-year growth 2023-2028 (%)
- Data Table on Synthetic - Year-over-year growth 2023-2028 (%)
- 6.4 Biologic - Market size and forecast 2023-2028
- Chart on Biologic - Market size and forecast 2023-2028 ($ billion)
- Data Table on Biologic - Market size and forecast 2023-2028 ($ billion)
- Chart on Biologic - Year-over-year growth 2023-2028 (%)
- Data Table on Biologic - Year-over-year growth 2023-2028 (%)
- 6.5 Genetically modified - Market size and forecast 2023-2028
- Chart on Genetically modified - Market size and forecast 2023-2028 ($ billion)
- Data Table on Genetically modified - Market size and forecast 2023-2028 ($ billion)
- Chart on Genetically modified - Year-over-year growth 2023-2028 (%)
- Data Table on Genetically modified - Year-over-year growth 2023-2028 (%)
- 6.6 Market opportunity by Material
- Market opportunity by Material ($ billion)
- Data Table on Market opportunity by Material ($ billion)
7 Market Segmentation by Application
- 7.1 Market segments
- Chart on Application - Market share 2023-2028 (%)
- Data Table on Application - Market share 2023-2028 (%)
- 7.2 Comparison by Application
- Chart on Comparison by Application
- Data Table on Comparison by Application
- 7.3 Orthopedic musculoskeletal and spine - Market size and forecast 2023-2028
- Chart on Orthopedic musculoskeletal and spine - Market size and forecast 2023-2028 ($ billion)
- Data Table on Orthopedic musculoskeletal and spine - Market size and forecast 2023-2028 ($ billion)
- Chart on Orthopedic musculoskeletal and spine - Year-over-year growth 2023-2028 (%)
- Data Table on Orthopedic musculoskeletal and spine - Year-over-year growth 2023-2028 (%)
- 7.4 Dermatology - Market size and forecast 2023-2028
- Chart on Dermatology - Market size and forecast 2023-2028 ($ billion)
- Data Table on Dermatology - Market size and forecast 2023-2028 ($ billion)
- Chart on Dermatology - Year-over-year growth 2023-2028 (%)
- Data Table on Dermatology - Year-over-year growth 2023-2028 (%)
- 7.5 Neurology - Market size and forecast 2023-2028
- Chart on Neurology - Market size and forecast 2023-2028 ($ billion)
- Data Table on Neurology - Market size and forecast 2023-2028 ($ billion)
- Chart on Neurology - Year-over-year growth 2023-2028 (%)
- Data Table on Neurology - Year-over-year growth 2023-2028 (%)
- 7.6 Others - Market size and forecast 2023-2028
- Chart on Others - Market size and forecast 2023-2028 ($ billion)
- Data Table on Others - Market size and forecast 2023-2028 ($ billion)
- Chart on Others - Year-over-year growth 2023-2028 (%)
- Data Table on Others - Year-over-year growth 2023-2028 (%)
- 7.7 Market opportunity by Application
- Market opportunity by Application ($ billion)
- Data Table on Market opportunity by Application ($ billion)
8 Customer Landscape
- 8.1 Customer landscape overview
- Analysis of price sensitivity, lifecycle, customer purchase basket, adoption rates, and purchase criteria
9 Geographic Landscape
- 9.1 Geographic segmentation
- Chart on Market share By Geographical Landscape 2023-2028 (%)
- Data Table on Market share By Geographical Landscape 2023-2028 (%)
- 9.2 Geographic comparison
- Chart on Geographic comparison
- Data Table on Geographic comparison
- 9.3 North America - Market size and forecast 2023-2028
- Chart on North America - Market size and forecast 2023-2028 ($ billion)
- Data Table on North America - Market size and forecast 2023-2028 ($ billion)
- Chart on North America - Year-over-year growth 2023-2028 (%)
- Data Table on North America - Year-over-year growth 2023-2028 (%)
- 9.4 Europe - Market size and forecast 2023-2028
- Chart on Europe - Market size and forecast 2023-2028 ($ billion)
- Data Table on Europe - Market size and forecast 2023-2028 ($ billion)
- Chart on Europe - Year-over-year growth 2023-2028 (%)
- Data Table on Europe - Year-over-year growth 2023-2028 (%)
- 9.5 Asia - Market size and forecast 2023-2028
- Chart on Asia - Market size and forecast 2023-2028 ($ billion)
- Data Table on Asia - Market size and forecast 2023-2028 ($ billion)
- Chart on Asia - Year-over-year growth 2023-2028 (%)
- Data Table on Asia - Year-over-year growth 2023-2028 (%)
- 9.6 Rest of World (ROW) - Market size and forecast 2023-2028
- Chart on Rest of World (ROW) - Market size and forecast 2023-2028 ($ billion)
- Data Table on Rest of World (ROW) - Market size and forecast 2023-2028 ($ billion)
- Chart on Rest of World (ROW) - Year-over-year growth 2023-2028 (%)
- Data Table on Rest of World (ROW) - Year-over-year growth 2023-2028 (%)
- 9.7 US - Market size and forecast 2023-2028
- Chart on US - Market size and forecast 2023-2028 ($ billion)
- Data Table on US - Market size and forecast 2023-2028 ($ billion)
- Chart on US - Year-over-year growth 2023-2028 (%)
- Data Table on US - Year-over-year growth 2023-2028 (%)
- 9.8 Germany - Market size and forecast 2023-2028
- Chart on Germany - Market size and forecast 2023-2028 ($ billion)
- Data Table on Germany - Market size and forecast 2023-2028 ($ billion)
- Chart on Germany - Year-over-year growth 2023-2028 (%)
- Data Table on Germany - Year-over-year growth 2023-2028 (%)
- 9.9 UK - Market size and forecast 2023-2028
- Chart on UK - Market size and forecast 2023-2028 ($ billion)
- Data Table on UK - Market size and forecast 2023-2028 ($ billion)
- Chart on UK - Year-over-year growth 2023-2028 (%)
- Data Table on UK - Year-over-year growth 2023-2028 (%)
- 9.10 Canada - Market size and forecast 2023-2028
- Chart on Canada - Market size and forecast 2023-2028 ($ billion)
- Data Table on Canada - Market size and forecast 2023-2028 ($ billion)
- Chart on Canada - Year-over-year growth 2023-2028 (%)
- Data Table on Canada - Year-over-year growth 2023-2028 (%)
- 9.11 China - Market size and forecast 2023-2028
- Chart on China - Market size and forecast 2023-2028 ($ billion)
- Data Table on China - Market size and forecast 2023-2028 ($ billion)
- Chart on China - Year-over-year growth 2023-2028 (%)
- Data Table on China - Year-over-year growth 2023-2028 (%)
- 9.12 Market opportunity By Geographical Landscape
- Market opportunity By Geographical Landscape ($ billion)
- Data Tables on Market opportunity By Geographical Landscape ($ billion)
10 Drivers, Challenges, and Opportunity/Restraints
- 10.1 Market drivers
- 10.2 Market challenges
- 10.3 Impact of drivers and challenges
- Impact of drivers and challenges in 2023 and 2028
- 10.4 Market opportunities/restraints
11 Competitive Landscape
- 11.1 Overview
- 11.2 Competitive Landscape
- Overview on criticality of inputs and factors of differentiation
- 11.3 Landscape disruption
- Overview on factors of disruption
- 11.4 Industry risks
- Impact of key risks on business
12 Competitive Analysis
- 12.1 Companies profiled
- Companies covered
- 12.2 Market positioning of companies
- Matrix on companies position and classification
- 3M Co.
- 3M Co. - Overview
- 3M Co. - Business segments
- 3M Co. - Key news
- 3M Co. - Key offerings
- 3M Co. - Segment focus
- 12.4 AbbVie Inc.
- AbbVie Inc. - Overview
- AbbVie Inc. - Product / Service
- AbbVie Inc. - Key news
- AbbVie Inc. - Key offerings
- 12.5 B.Braun SE
- B.Braun SE - Overview
- B.Braun SE - Business segments
- B.Braun SE - Key news
- B.Braun SE - Key offerings
- B.Braun SE - Segment focus
- 12.6 Baxter International Inc.
- Baxter International Inc. - Overview
- Baxter International Inc. - Business segments
- Baxter International Inc. - Key news
- Baxter International Inc. - Key offerings
- Baxter International Inc. - Segment focus
- 12.7 Becton Dickinson and Co.
- Becton Dickinson and Co. - Overview
- Becton Dickinson and Co. - Business segments
- Becton Dickinson and Co. - Key news
- Becton Dickinson and Co. - Key offerings
- Becton Dickinson and Co. - Segment focus
- 12.8 Cook Group Inc.
- Cook Group Inc. - Overview
- Cook Group Inc. - Product / Service
- Cook Group Inc. - Key news
- Cook Group Inc. - Key offerings
- 12.9 Integra Lifesciences Corp.
- Integra Lifesciences Corp. - Overview
- Integra Lifesciences Corp. - Business segments
- Integra Lifesciences Corp. - Key news
- Integra Lifesciences Corp. - Key offerings
- Integra Lifesciences Corp. - Segment focus
- 12.10 Johnson and Johnson Services Inc.
- Johnson and Johnson Services Inc. - Overview
- Johnson and Johnson Services Inc. - Business segments
- Johnson and Johnson Services Inc. - Key news
- Johnson and Johnson Services Inc. - Key offerings
- Johnson and Johnson Services Inc. - Segment focus
- 12.11 Medtronic Plc
- Medtronic Plc - Overview
- Medtronic Plc - Business segments
- Medtronic Plc - Key news
- Medtronic Plc - Key offerings
- Medtronic Plc - Segment focus
- 12.12 Organogenesis Holdings Inc.
- Organogenesis Holdings Inc. - Overview
- Organogenesis Holdings Inc. - Product / Service
- Organogenesis Holdings Inc. - Key offerings
- 12.13 RTI Surgical Inc.
- RTI Surgical Inc. - Overview
- RTI Surgical Inc. - Product / Service
- RTI Surgical Inc. - Key offerings
- 12.14 Smith and Nephew plc
- Smith and Nephew plc - Overview
- Smith and Nephew plc - Business segments
- Smith and Nephew plc - Key news
- Smith and Nephew plc - Key offerings
- Smith and Nephew plc - Segment focus
- 12.15 Stryker Corp.
- Stryker Corp. - Overview
- Stryker Corp. - Business segments
- Stryker Corp. - Key news
- Stryker Corp. - Key offerings
- Stryker Corp. - Segment focus
- 12.16 Tissue Regenix Group Plc
- Tissue Regenix Group Plc - Overview
- Tissue Regenix Group Plc - Business segments
- Tissue Regenix Group Plc - Key offerings
- Tissue Regenix Group Plc - Segment focus
- 12.17 Zimmer Biomet Holdings Inc.
- Zimmer Biomet Holdings Inc. - Overview
- Zimmer Biomet Holdings Inc. - Business segments
- Zimmer Biomet Holdings Inc. - Key news
- Zimmer Biomet Holdings Inc. - Key offerings
- Zimmer Biomet Holdings Inc. - Segment focus
13 Appendix
- 13.1 Scope of the report
- 13.2 Inclusions and exclusions checklist
- Inclusions checklist
- Exclusions checklist
- 13.3 Currency conversion rates for US$
- Currency conversion rates for US$
- 13.4 Research methodology
- Research methodology
- 13.5 Data procurement
- Information sources
- 13.6 Data validation
- Data validation
- 13.7 Validation techniques employed for market sizing
- Validation techniques employed for market sizing
- 13.8 Data synthesis
- Data synthesis
- 13.9 360 degree market analysis
- 360 degree market analysis
- 13.10 List of abbreviations
- List of abbreviations

