|
|
市場調査レポート
商品コード
1544365
アミン類の世界市場、2024~2028年Global Amines Market 2024-2028 |
||||||

|
|||||||
カスタマイズ可能
|
|||||||

| アミン類の世界市場、2024~2028年 |
|
出版日: 2024年07月12日
発行: TechNavio
ページ情報: 英文 178 Pages
納期: 即納可能
|

全表示
- 概要
- 図表
- 目次
アミン類市場は2023~2028年に24億4,920万米ドル、予測期間中のCAGRは4.36%で成長すると予測されます。
当レポートでは、アミン類市場の全体的な分析、市場規模・予測、動向、成長促進要因、課題、約25のベンダーを網羅したベンダー分析などを掲載しています。
現在の市場シナリオ、最新動向と促進要因、市場環境全体に関する最新分析を提供しています。農薬におけるアミン類の需要の急増、水処理薬品としてのグリーンケミカルの使用、建設セグメントでのアミン類の需要と使用の増加などが市場を牽引しています。
| 市場範囲 | |
|---|---|
| 基準年 | 2024年 |
| 終了年 | 2028年 |
| 予測期間 | 2024~2028年 |
| 成長モメンタム | 加速 |
| 前年比[2024年] | 4.11% |
| CAGR | 4.36% |
| 増分額 | 24億4,920万米ドル |
本調査では、今後数年間のアミン類市場の成長を牽引する主要理由の一つとして、製薬業界からの需要増加を挙げています。また、有機食品添加物の注目度が高まり、コンビニエンス食品におけるペクチンの需要が増加していることも、市場の大きな需要につながります。
目次
第1章 エグゼクティブサマリー
- 市場概要
第2章 市場情勢
- 市場エコシステム
- 市場の特徴
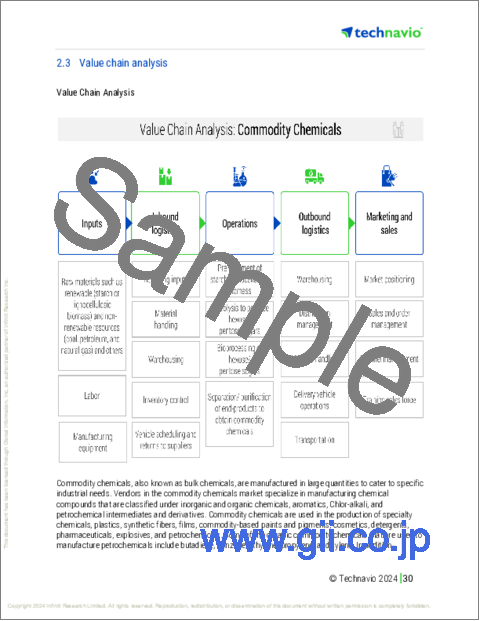
- バリューチェーン分析
第3章 市場規模の評価
- 市場の定義
- 市場セグメント分析
- 市場規模 2023年
- 市場の展望 2023~2028年
第4章 市場規模実績
- アミン類の世界市場 2018~2022年
- 製品別セグメント分析 2018~2022年
- 用途別セグメント分析 2018~2022年
- 地域別セグメント分析 2018~2022年
- 国別セグメント分析 2018~2022年
第5章 ファイブフォース分析
- ファイブフォースの要約
- 買い手の交渉力
- 供給企業の交渉力
- 新規参入業者の脅威
- 代替品の脅威
- 競争の脅威
- 市況
第6章 市場セグメンテーション:製品別
- 市場セグメンテーション
- 比較:製品別
- エタノールアミン類:市場規模と予測 2023~2028年
- 脂肪アミン類:市場規模と予測 2023~2028年
- 特殊アミン類:市場規模と予測 2023~2028年
- エチレンアミン類:市場規模と予測 2023~2028年
- 市場機会:製品別
第7章 市場セグメンテーション:用途別
- 市場セグメンテーション
- 比較:用途別
- 農薬:市場規模と予測 2023~2028年
- 界面活性剤:市場規模と予測 2023~2028年
- パーソナルケア:市場規模と予測 2023~2028年
- 潤滑剤:市場規模と予測 2023~2028年
- その他:市場規模と予測 2023~2028年
- 市場機会:用途別
第8章 顧客情勢
- 顧客情勢概要
第9章 地域別情勢
- 地域別セグメンテーション
- 比較:地域別
- アジア太平洋:市場規模と予測 2023~2028年
- 北米:市場規模と予測 2023~2028年
- 欧州:市場規模と予測 2023~2028年
- 中東・アフリカ:市場規模と予測 2023~2028年
- 南米:市場規模と予測 2023~2028年
- 中国:市場規模と予測 2023~2028年
- 米国:市場規模と予測 2023~2028年
- 英国:市場規模と予測 2023~2028年
- ドイツ:市場規模と予測 2023~2028年
- インド:市場規模と予測 2023~2028年
- 市場機会:地域情勢別
第10章 促進要因・課題・機会・抑制要因
- 市場促進要因
- 市場課題
- 促進要因と課題の影響
- 市場の機会・抑制要因
第11章 競合情勢
- 概要
- 競合情勢
- 混乱の状況
- 業界のリスク
第12章 競合分析
- 企業プロファイル
- 企業の市場ポジショニング
- Akzo Nobel NV
- Arkema Group
- Ascensus Specialties LLC
- BASF SE
- Celanese Corp.
- ChemImpex International Inc.
- Dow Chemical Co.
- Eastman Chemical Co.
- Enamine Ltd
- Huntsman International LLC
- LGC Science Group Holdings Ltd.
- Merck KGaA
- Solvay SA
- Thermo Fisher Scientific Inc.
- Tokyo Chemical Industry Co. Ltd.
第13章 付録
Exhibits:
- Exhibits1: Executive Summary - Chart on Market Overview
- Exhibits2: Executive Summary - Data Table on Market Overview
- Exhibits3: Executive Summary - Chart on Global Market Characteristics
- Exhibits4: Executive Summary - Chart on Market By Geographical Landscape
- Exhibits5: Executive Summary - Chart on Market Segmentation by Product
- Exhibits6: Executive Summary - Chart on Market Segmentation by Application
- Exhibits7: Executive Summary - Chart on Incremental Growth
- Exhibits8: Executive Summary - Data Table on Incremental Growth
- Exhibits9: Executive Summary - Chart on Company Market Positioning
- Exhibits10: Parent Market
- Exhibits11: Data Table on - Parent Market
- Exhibits12: Market characteristics analysis
- Exhibits13: Value Chain Analysis
- Exhibits14: Offerings of companies included in the market definition
- Exhibits15: Market segments
- Exhibits16: Chart on Global - Market size and forecast 2023-2028 ($ million)
- Exhibits17: Data Table on Global - Market size and forecast 2023-2028 ($ million)
- Exhibits18: Chart on Global Market: Year-over-year growth 2023-2028 (%)
- Exhibits19: Data Table on Global Market: Year-over-year growth 2023-2028 (%)
- Exhibits20: Historic Market Size - Data Table on Global Amines Market 2018 - 2022 ($ million)
- Exhibits21: Historic Market Size - Product Segment 2018 - 2022 ($ million)
- Exhibits22: Historic Market Size - Application Segment 2018 - 2022 ($ million)
- Exhibits23: Historic Market Size - Geography Segment 2018 - 2022 ($ million)
- Exhibits24: Historic Market Size - Country Segment 2018 - 2022 ($ million)
- Exhibits25: Five forces analysis - Comparison between 2023 and 2028
- Exhibits26: Bargaining power of buyers - Impact of key factors 2023 and 2028
- Exhibits27: Bargaining power of suppliers - Impact of key factors in 2023 and 2028
- Exhibits28: Threat of new entrants - Impact of key factors in 2023 and 2028
- Exhibits29: Threat of substitutes - Impact of key factors in 2023 and 2028
- Exhibits30: Threat of rivalry - Impact of key factors in 2023 and 2028
- Exhibits31: Chart on Market condition - Five forces 2023 and 2028
- Exhibits32: Chart on Product - Market share 2023-2028 (%)
- Exhibits33: Data Table on Product - Market share 2023-2028 (%)
- Exhibits34: Chart on Comparison by Product
- Exhibits35: Data Table on Comparison by Product
- Exhibits36: Chart on Ethanolamine - Market size and forecast 2023-2028 ($ million)
- Exhibits37: Data Table on Ethanolamine - Market size and forecast 2023-2028 ($ million)
- Exhibits38: Chart on Ethanolamine - Year-over-year growth 2023-2028 (%)
- Exhibits39: Data Table on Ethanolamine - Year-over-year growth 2023-2028 (%)
- Exhibits40: Chart on Fatty amines - Market size and forecast 2023-2028 ($ million)
- Exhibits41: Data Table on Fatty amines - Market size and forecast 2023-2028 ($ million)
- Exhibits42: Chart on Fatty amines - Year-over-year growth 2023-2028 (%)
- Exhibits43: Data Table on Fatty amines - Year-over-year growth 2023-2028 (%)
- Exhibits44: Chart on Specialty amines - Market size and forecast 2023-2028 ($ million)
- Exhibits45: Data Table on Specialty amines - Market size and forecast 2023-2028 ($ million)
- Exhibits46: Chart on Specialty amines - Year-over-year growth 2023-2028 (%)
- Exhibits47: Data Table on Specialty amines - Year-over-year growth 2023-2028 (%)
- Exhibits48: Chart on Ethyleneamines - Market size and forecast 2023-2028 ($ million)
- Exhibits49: Data Table on Ethyleneamines - Market size and forecast 2023-2028 ($ million)
- Exhibits50: Chart on Ethyleneamines - Year-over-year growth 2023-2028 (%)
- Exhibits51: Data Table on Ethyleneamines - Year-over-year growth 2023-2028 (%)
- Exhibits52: Market opportunity by Product ($ million)
- Exhibits53: Data Table on Market opportunity by Product ($ million)
- Exhibits54: Chart on Application - Market share 2023-2028 (%)
- Exhibits55: Data Table on Application - Market share 2023-2028 (%)
- Exhibits56: Chart on Comparison by Application
- Exhibits57: Data Table on Comparison by Application
- Exhibits58: Chart on Pesticides - Market size and forecast 2023-2028 ($ million)
- Exhibits59: Data Table on Pesticides - Market size and forecast 2023-2028 ($ million)
- Exhibits60: Chart on Pesticides - Year-over-year growth 2023-2028 (%)
- Exhibits61: Data Table on Pesticides - Year-over-year growth 2023-2028 (%)
- Exhibits62: Chart on Surfactants - Market size and forecast 2023-2028 ($ million)
- Exhibits63: Data Table on Surfactants - Market size and forecast 2023-2028 ($ million)
- Exhibits64: Chart on Surfactants - Year-over-year growth 2023-2028 (%)
- Exhibits65: Data Table on Surfactants - Year-over-year growth 2023-2028 (%)
- Exhibits66: Chart on Personal care - Market size and forecast 2023-2028 ($ million)
- Exhibits67: Data Table on Personal care - Market size and forecast 2023-2028 ($ million)
- Exhibits68: Chart on Personal care - Year-over-year growth 2023-2028 (%)
- Exhibits69: Data Table on Personal care - Year-over-year growth 2023-2028 (%)
- Exhibits70: Chart on Lubricants - Market size and forecast 2023-2028 ($ million)
- Exhibits71: Data Table on Lubricants - Market size and forecast 2023-2028 ($ million)
- Exhibits72: Chart on Lubricants - Year-over-year growth 2023-2028 (%)
- Exhibits73: Data Table on Lubricants - Year-over-year growth 2023-2028 (%)
- Exhibits74: Chart on Others - Market size and forecast 2023-2028 ($ million)
- Exhibits75: Data Table on Others - Market size and forecast 2023-2028 ($ million)
- Exhibits76: Chart on Others - Year-over-year growth 2023-2028 (%)
- Exhibits77: Data Table on Others - Year-over-year growth 2023-2028 (%)
- Exhibits78: Market opportunity by Application ($ million)
- Exhibits79: Data Table on Market opportunity by Application ($ million)
- Exhibits80: Analysis of price sensitivity, lifecycle, customer purchase basket, adoption rates, and purchase criteria
- Exhibits81: Chart on Market share By Geographical Landscape 2023-2028 (%)
- Exhibits82: Data Table on Market share By Geographical Landscape 2023-2028 (%)
- Exhibits83: Chart on Geographic comparison
- Exhibits84: Data Table on Geographic comparison
- Exhibits85: Chart on APAC - Market size and forecast 2023-2028 ($ million)
- Exhibits86: Data Table on APAC - Market size and forecast 2023-2028 ($ million)
- Exhibits87: Chart on APAC - Year-over-year growth 2023-2028 (%)
- Exhibits88: Data Table on APAC - Year-over-year growth 2023-2028 (%)
- Exhibits89: Chart on North America - Market size and forecast 2023-2028 ($ million)
- Exhibits90: Data Table on North America - Market size and forecast 2023-2028 ($ million)
- Exhibits91: Chart on North America - Year-over-year growth 2023-2028 (%)
- Exhibits92: Data Table on North America - Year-over-year growth 2023-2028 (%)
- Exhibits93: Chart on Europe - Market size and forecast 2023-2028 ($ million)
- Exhibits94: Data Table on Europe - Market size and forecast 2023-2028 ($ million)
- Exhibits95: Chart on Europe - Year-over-year growth 2023-2028 (%)
- Exhibits96: Data Table on Europe - Year-over-year growth 2023-2028 (%)
- Exhibits97: Chart on Middle East and Africa - Market size and forecast 2023-2028 ($ million)
- Exhibits98: Data Table on Middle East and Africa - Market size and forecast 2023-2028 ($ million)
- Exhibits99: Chart on Middle East and Africa - Year-over-year growth 2023-2028 (%)
- Exhibits100: Data Table on Middle East and Africa - Year-over-year growth 2023-2028 (%)
- Exhibits101: Chart on South America - Market size and forecast 2023-2028 ($ million)
- Exhibits102: Data Table on South America - Market size and forecast 2023-2028 ($ million)
- Exhibits103: Chart on South America - Year-over-year growth 2023-2028 (%)
- Exhibits104: Data Table on South America - Year-over-year growth 2023-2028 (%)
- Exhibits105: Chart on China - Market size and forecast 2023-2028 ($ million)
- Exhibits106: Data Table on China - Market size and forecast 2023-2028 ($ million)
- Exhibits107: Chart on China - Year-over-year growth 2023-2028 (%)
- Exhibits108: Data Table on China - Year-over-year growth 2023-2028 (%)
- Exhibits109: Chart on US - Market size and forecast 2023-2028 ($ million)
- Exhibits110: Data Table on US - Market size and forecast 2023-2028 ($ million)
- Exhibits111: Chart on US - Year-over-year growth 2023-2028 (%)
- Exhibits112: Data Table on US - Year-over-year growth 2023-2028 (%)
- Exhibits113: Chart on UK - Market size and forecast 2023-2028 ($ million)
- Exhibits114: Data Table on UK - Market size and forecast 2023-2028 ($ million)
- Exhibits115: Chart on UK - Year-over-year growth 2023-2028 (%)
- Exhibits116: Data Table on UK - Year-over-year growth 2023-2028 (%)
- Exhibits117: Chart on Germany - Market size and forecast 2023-2028 ($ million)
- Exhibits118: Data Table on Germany - Market size and forecast 2023-2028 ($ million)
- Exhibits119: Chart on Germany - Year-over-year growth 2023-2028 (%)
- Exhibits120: Data Table on Germany - Year-over-year growth 2023-2028 (%)
- Exhibits121: Chart on India - Market size and forecast 2023-2028 ($ million)
- Exhibits122: Data Table on India - Market size and forecast 2023-2028 ($ million)
- Exhibits123: Chart on India - Year-over-year growth 2023-2028 (%)
- Exhibits124: Data Table on India - Year-over-year growth 2023-2028 (%)
- Exhibits125: Market opportunity By Geographical Landscape ($ million)
- Exhibits126: Data Tables on Market opportunity By Geographical Landscape ($ million)
- Exhibits127: Impact of drivers and challenges in 2023 and 2028
- Exhibits128: Overview on criticality of inputs and factors of differentiation
- Exhibits129: Overview on factors of disruption
- Exhibits130: Impact of key risks on business
- Exhibits131: Companies covered
- Exhibits132: Matrix on companies position and classification
- Exhibits133: Akzo Nobel NV - Overview
- Exhibits134: Akzo Nobel NV - Business segments
- Exhibits135: Akzo Nobel NV - Key news
- Exhibits136: Akzo Nobel NV - Key offerings
- Exhibits137: Akzo Nobel NV - Segment focus
- Exhibits138: Arkema Group - Overview
- Exhibits139: Arkema Group - Business segments
- Exhibits140: Arkema Group - Key news
- Exhibits141: Arkema Group - Key offerings
- Exhibits142: Arkema Group - Segment focus
- Exhibits143: Ascensus Specialties LLC - Overview
- Exhibits144: Ascensus Specialties LLC - Product / Service
- Exhibits145: Ascensus Specialties LLC - Key offerings
- Exhibits146: BASF SE - Overview
- Exhibits147: BASF SE - Business segments
- Exhibits148: BASF SE - Key news
- Exhibits149: BASF SE - Key offerings
- Exhibits150: BASF SE - Segment focus
- Exhibits151: Celanese Corp. - Overview
- Exhibits152: Celanese Corp. - Business segments
- Exhibits153: Celanese Corp. - Key news
- Exhibits154: Celanese Corp. - Key offerings
- Exhibits155: Celanese Corp. - Segment focus
- Exhibits156: ChemImpex International Inc. - Overview
- Exhibits157: ChemImpex International Inc. - Product / Service
- Exhibits158: ChemImpex International Inc. - Key offerings
- Exhibits159: Dow Chemical Co. - Overview
- Exhibits160: Dow Chemical Co. - Business segments
- Exhibits161: Dow Chemical Co. - Key news
- Exhibits162: Dow Chemical Co. - Key offerings
- Exhibits163: Dow Chemical Co. - Segment focus
- Exhibits164: Eastman Chemical Co. - Overview
- Exhibits165: Eastman Chemical Co. - Business segments
- Exhibits166: Eastman Chemical Co. - Key news
- Exhibits167: Eastman Chemical Co. - Key offerings
- Exhibits168: Eastman Chemical Co. - Segment focus
- Exhibits169: Enamine Ltd - Overview
- Exhibits170: Enamine Ltd - Product / Service
- Exhibits171: Enamine Ltd - Key offerings
- Exhibits172: Huntsman International LLC - Overview
- Exhibits173: Huntsman International LLC - Business segments
- Exhibits174: Huntsman International LLC - Key news
- Exhibits175: Huntsman International LLC - Key offerings
- Exhibits176: Huntsman International LLC - Segment focus
- Exhibits177: LGC Science Group Holdings Ltd. - Overview
- Exhibits178: LGC Science Group Holdings Ltd. - Product / Service
- Exhibits179: LGC Science Group Holdings Ltd. - Key offerings
- Exhibits180: Merck KGaA - Overview
- Exhibits181: Merck KGaA - Business segments
- Exhibits182: Merck KGaA - Key news
- Exhibits183: Merck KGaA - Key offerings
- Exhibits184: Merck KGaA - Segment focus
- Exhibits185: Solvay SA - Overview
- Exhibits186: Solvay SA - Business segments
- Exhibits187: Solvay SA - Key news
- Exhibits188: Solvay SA - Key offerings
- Exhibits189: Solvay SA - Segment focus
- Exhibits190: Thermo Fisher Scientific Inc. - Overview
- Exhibits191: Thermo Fisher Scientific Inc. - Business segments
- Exhibits192: Thermo Fisher Scientific Inc. - Key news
- Exhibits193: Thermo Fisher Scientific Inc. - Key offerings
- Exhibits194: Thermo Fisher Scientific Inc. - Segment focus
- Exhibits195: Tokyo Chemical Industry Co. Ltd. - Overview
- Exhibits196: Tokyo Chemical Industry Co. Ltd. - Product / Service
- Exhibits197: Tokyo Chemical Industry Co. Ltd. - Key offerings
- Exhibits198: Inclusions checklist
- Exhibits199: Exclusions checklist
- Exhibits200: Currency conversion rates for US$
- Exhibits201: Research methodology
- Exhibits202: Information sources
- Exhibits203: Data validation
- Exhibits204: Validation techniques employed for market sizing
- Exhibits205: Data synthesis
- Exhibits206: 360 degree market analysis
- Exhibits207: List of abbreviations
The amines market is forecasted to grow by USD 2449.2 mn during 2023-2028, accelerating at a CAGR of 4.36% during the forecast period. The report on the amines market provides a holistic analysis, market size and forecast, trends, growth drivers, and challenges, as well as vendor analysis covering around 25 vendors.
The report offers an up-to-date analysis regarding the current market scenario, the latest trends and drivers, and the overall market environment. The market is driven by burgeoning demand for amines in agrochemicals, use of green chemicals as water treatment chemicals, and increasing demand and usage of amines in construction sector.
Technavio's amines market is segmented as below:
| Market Scope | |
|---|---|
| Base Year | 2024 |
| End Year | 2028 |
| Series Year | 2024-2028 |
| Growth Momentum | Accelerate |
| YOY 2024 | 4.11% |
| CAGR | 4.36% |
| Incremental Value | $2449.2 mn |
By Product
- Ethanolamine
- Fatty amines
- Specialty amines
- Ethyleneamines
By Application
- Pesticides
- Surfactants
- Personal care
- Lubricants
- Others
By Geographical Landscape
- APAC
- North America
- Europe
- Middle East and Africa
- South America
This study identifies the increasing demand from pharmaceutical industry as one of the prime reasons driving the amines market growth during the next few years. Also, growing prominence of organic food additives and increasing demand for pectin in convenience foods will lead to sizable demand in the market.
The report on the amines market covers the following areas:
- Amines market sizing
- Amines market forecast
- Amines market industry analysis
The robust vendor analysis is designed to help clients improve their market position, and in line with this, this report provides a detailed analysis of several leading amines market vendors that include Akzo Nobel NV, Arkema Group., Ascensus Specialties LLC, BASF SE, Biosynth Ltd., Celanese Corp., ChemImpex International Inc., Dow Chemical Co., Eastman Chemical Co., Enamine Ltd, Huntsman International LLC, INEOS AG, LGC Science Group Holdings Ltd., Merck KGaA, Otsuka Holdings Co. Ltd., Solvay SA, SynQuest Laboratories Inc, Thermo Fisher Scientific Inc., Tokyo Chemical Industry Co. Ltd., and Toronto Research Chemicals Inc.. Also, the amines market analysis report includes information on upcoming trends and challenges that will influence market growth. This is to help companies strategize and leverage all forthcoming growth opportunities.
The study was conducted using an objective combination of primary and secondary information including inputs from key participants in the industry. The report contains a comprehensive market and vendor landscape in addition to an analysis of the key vendors.
The publisher presents a detailed picture of the market by the way of study, synthesis, and summation of data from multiple sources by an analysis of key parameters such as profit, pricing, competition, and promotions. It presents various market facets by identifying the key industry influencers. The data presented is comprehensive, reliable, and a result of extensive research - both primary and secondary. The market research reports provide a complete competitive landscape and an in-depth vendor selection methodology and analysis using qualitative and quantitative research to forecast the accurate market growth.
Table of Contents
1 Executive Summary
- 1.1 Market overview
- Executive Summary - Chart on Market Overview
- Executive Summary - Data Table on Market Overview
- Executive Summary - Chart on Global Market Characteristics
- Executive Summary - Chart on Market By Geographical Landscape
- Executive Summary - Chart on Market Segmentation by Product
- Executive Summary - Chart on Market Segmentation by Application
- Executive Summary - Chart on Incremental Growth
- Executive Summary - Data Table on Incremental Growth
- Executive Summary - Chart on Company Market Positioning
2 Market Landscape
- 2.1 Market ecosystem
- Parent Market
- Data Table on - Parent Market
- 2.2 Market characteristics
- Market characteristics analysis
- 2.3 Value chain analysis
- Value Chain Analysis
3 Market Sizing
- 3.1 Market definition
- Offerings of companies included in the market definition
- 3.2 Market segment analysis
- Market segments
- 3.3 Market size 2023
- 3.4 Market outlook: Forecast for 2023-2028
- Chart on Global - Market size and forecast 2023-2028 ($ million)
- Data Table on Global - Market size and forecast 2023-2028 ($ million)
- Chart on Global Market: Year-over-year growth 2023-2028 (%)
- Data Table on Global Market: Year-over-year growth 2023-2028 (%)
4 Historic Market Size
- 4.1 Global Amines Market 2018 - 2022
- Historic Market Size - Data Table on Global Amines Market 2018 - 2022 ($ million)
- 4.2 Product segment analysis 2018 - 2022
- Historic Market Size - Product Segment 2018 - 2022 ($ million)
- 4.3 Application segment analysis 2018 - 2022
- Historic Market Size - Application Segment 2018 - 2022 ($ million)
- 4.4 Geography segment analysis 2018 - 2022
- Historic Market Size - Geography Segment 2018 - 2022 ($ million)
- 4.5 Country segment analysis 2018 - 2022
- Historic Market Size - Country Segment 2018 - 2022 ($ million)
5 Five Forces Analysis
- 5.1 Five forces summary
- Five forces analysis - Comparison between 2023 and 2028
- 5.2 Bargaining power of buyers
- Bargaining power of buyers - Impact of key factors 2023 and 2028
- 5.3 Bargaining power of suppliers
- Bargaining power of suppliers - Impact of key factors in 2023 and 2028
- 5.4 Threat of new entrants
- Threat of new entrants - Impact of key factors in 2023 and 2028
- 5.5 Threat of substitutes
- Threat of substitutes - Impact of key factors in 2023 and 2028
- 5.6 Threat of rivalry
- Threat of rivalry - Impact of key factors in 2023 and 2028
- 5.7 Market condition
- Chart on Market condition - Five forces 2023 and 2028
6 Market Segmentation by Product
- 6.1 Market segments
- Chart on Product - Market share 2023-2028 (%)
- Data Table on Product - Market share 2023-2028 (%)
- 6.2 Comparison by Product
- Chart on Comparison by Product
- Data Table on Comparison by Product
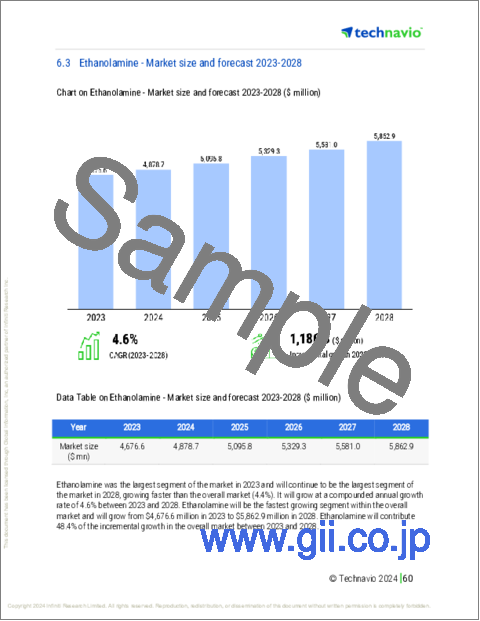
- 6.3 Ethanolamine - Market size and forecast 2023-2028
- Chart on Ethanolamine - Market size and forecast 2023-2028 ($ million)
- Data Table on Ethanolamine - Market size and forecast 2023-2028 ($ million)
- Chart on Ethanolamine - Year-over-year growth 2023-2028 (%)
- Data Table on Ethanolamine - Year-over-year growth 2023-2028 (%)
- 6.4 Fatty amines - Market size and forecast 2023-2028
- Chart on Fatty amines - Market size and forecast 2023-2028 ($ million)
- Data Table on Fatty amines - Market size and forecast 2023-2028 ($ million)
- Chart on Fatty amines - Year-over-year growth 2023-2028 (%)
- Data Table on Fatty amines - Year-over-year growth 2023-2028 (%)
- 6.5 Specialty amines - Market size and forecast 2023-2028
- Chart on Specialty amines - Market size and forecast 2023-2028 ($ million)
- Data Table on Specialty amines - Market size and forecast 2023-2028 ($ million)
- Chart on Specialty amines - Year-over-year growth 2023-2028 (%)
- Data Table on Specialty amines - Year-over-year growth 2023-2028 (%)
- 6.6 Ethyleneamines - Market size and forecast 2023-2028
- Chart on Ethyleneamines - Market size and forecast 2023-2028 ($ million)
- Data Table on Ethyleneamines - Market size and forecast 2023-2028 ($ million)
- Chart on Ethyleneamines - Year-over-year growth 2023-2028 (%)
- Data Table on Ethyleneamines - Year-over-year growth 2023-2028 (%)
- 6.7 Market opportunity by Product
- Market opportunity by Product ($ million)
- Data Table on Market opportunity by Product ($ million)
7 Market Segmentation by Application
- 7.1 Market segments
- Chart on Application - Market share 2023-2028 (%)
- Data Table on Application - Market share 2023-2028 (%)
- 7.2 Comparison by Application
- Chart on Comparison by Application
- Data Table on Comparison by Application
- 7.3 Pesticides - Market size and forecast 2023-2028
- Chart on Pesticides - Market size and forecast 2023-2028 ($ million)
- Data Table on Pesticides - Market size and forecast 2023-2028 ($ million)
- Chart on Pesticides - Year-over-year growth 2023-2028 (%)
- Data Table on Pesticides - Year-over-year growth 2023-2028 (%)
- 7.4 Surfactants - Market size and forecast 2023-2028
- Chart on Surfactants - Market size and forecast 2023-2028 ($ million)
- Data Table on Surfactants - Market size and forecast 2023-2028 ($ million)
- Chart on Surfactants - Year-over-year growth 2023-2028 (%)
- Data Table on Surfactants - Year-over-year growth 2023-2028 (%)
- 7.5 Personal care - Market size and forecast 2023-2028
- Chart on Personal care - Market size and forecast 2023-2028 ($ million)
- Data Table on Personal care - Market size and forecast 2023-2028 ($ million)
- Chart on Personal care - Year-over-year growth 2023-2028 (%)
- Data Table on Personal care - Year-over-year growth 2023-2028 (%)
- 7.6 Lubricants - Market size and forecast 2023-2028
- Chart on Lubricants - Market size and forecast 2023-2028 ($ million)
- Data Table on Lubricants - Market size and forecast 2023-2028 ($ million)
- Chart on Lubricants - Year-over-year growth 2023-2028 (%)
- Data Table on Lubricants - Year-over-year growth 2023-2028 (%)
- 7.7 Others - Market size and forecast 2023-2028
- Chart on Others - Market size and forecast 2023-2028 ($ million)
- Data Table on Others - Market size and forecast 2023-2028 ($ million)
- Chart on Others - Year-over-year growth 2023-2028 (%)
- Data Table on Others - Year-over-year growth 2023-2028 (%)
- 7.8 Market opportunity by Application
- Market opportunity by Application ($ million)
- Data Table on Market opportunity by Application ($ million)
8 Customer Landscape
- 8.1 Customer landscape overview
- Analysis of price sensitivity, lifecycle, customer purchase basket, adoption rates, and purchase criteria
9 Geographic Landscape
- 9.1 Geographic segmentation
- Chart on Market share By Geographical Landscape 2023-2028 (%)
- Data Table on Market share By Geographical Landscape 2023-2028 (%)
- 9.2 Geographic comparison
- Chart on Geographic comparison
- Data Table on Geographic comparison
- 9.3 APAC - Market size and forecast 2023-2028
- Chart on APAC - Market size and forecast 2023-2028 ($ million)
- Data Table on APAC - Market size and forecast 2023-2028 ($ million)
- Chart on APAC - Year-over-year growth 2023-2028 (%)
- Data Table on APAC - Year-over-year growth 2023-2028 (%)
- 9.4 North America - Market size and forecast 2023-2028
- Chart on North America - Market size and forecast 2023-2028 ($ million)
- Data Table on North America - Market size and forecast 2023-2028 ($ million)
- Chart on North America - Year-over-year growth 2023-2028 (%)
- Data Table on North America - Year-over-year growth 2023-2028 (%)
- 9.5 Europe - Market size and forecast 2023-2028
- Chart on Europe - Market size and forecast 2023-2028 ($ million)
- Data Table on Europe - Market size and forecast 2023-2028 ($ million)
- Chart on Europe - Year-over-year growth 2023-2028 (%)
- Data Table on Europe - Year-over-year growth 2023-2028 (%)
- 9.6 Middle East and Africa - Market size and forecast 2023-2028
- Chart on Middle East and Africa - Market size and forecast 2023-2028 ($ million)
- Data Table on Middle East and Africa - Market size and forecast 2023-2028 ($ million)
- Chart on Middle East and Africa - Year-over-year growth 2023-2028 (%)
- Data Table on Middle East and Africa - Year-over-year growth 2023-2028 (%)
- 9.7 South America - Market size and forecast 2023-2028
- Chart on South America - Market size and forecast 2023-2028 ($ million)
- Data Table on South America - Market size and forecast 2023-2028 ($ million)
- Chart on South America - Year-over-year growth 2023-2028 (%)
- Data Table on South America - Year-over-year growth 2023-2028 (%)
- 9.8 China - Market size and forecast 2023-2028
- Chart on China - Market size and forecast 2023-2028 ($ million)
- Data Table on China - Market size and forecast 2023-2028 ($ million)
- Chart on China - Year-over-year growth 2023-2028 (%)
- Data Table on China - Year-over-year growth 2023-2028 (%)
- 9.9 US - Market size and forecast 2023-2028
- Chart on US - Market size and forecast 2023-2028 ($ million)
- Data Table on US - Market size and forecast 2023-2028 ($ million)
- Chart on US - Year-over-year growth 2023-2028 (%)
- Data Table on US - Year-over-year growth 2023-2028 (%)
- 9.10 UK - Market size and forecast 2023-2028
- Chart on UK - Market size and forecast 2023-2028 ($ million)
- Data Table on UK - Market size and forecast 2023-2028 ($ million)
- Chart on UK - Year-over-year growth 2023-2028 (%)
- Data Table on UK - Year-over-year growth 2023-2028 (%)
- 9.11 Germany - Market size and forecast 2023-2028
- Chart on Germany - Market size and forecast 2023-2028 ($ million)
- Data Table on Germany - Market size and forecast 2023-2028 ($ million)
- Chart on Germany - Year-over-year growth 2023-2028 (%)
- Data Table on Germany - Year-over-year growth 2023-2028 (%)
- 9.12 India - Market size and forecast 2023-2028
- Chart on India - Market size and forecast 2023-2028 ($ million)
- Data Table on India - Market size and forecast 2023-2028 ($ million)
- Chart on India - Year-over-year growth 2023-2028 (%)
- Data Table on India - Year-over-year growth 2023-2028 (%)
- 9.13 Market opportunity By Geographical Landscape
- Market opportunity By Geographical Landscape ($ million)
- Data Tables on Market opportunity By Geographical Landscape ($ million)
10 Drivers, Challenges, and Opportunity/Restraints
- 10.1 Market drivers
- 10.2 Market challenges
- 10.3 Impact of drivers and challenges
- Impact of drivers and challenges in 2023 and 2028
- 10.4 Market opportunities/restraints
11 Competitive Landscape
- 11.1 Overview
- 11.2 Competitive Landscape
- Overview on criticality of inputs and factors of differentiation
- 11.3 Landscape disruption
- Overview on factors of disruption
- 11.4 Industry risks
- Impact of key risks on business
12 Competitive Analysis
- 12.1 Companies profiled
- Companies covered
- 12.2 Market positioning of companies
- Matrix on companies position and classification
- 12.3 Akzo Nobel NV
- Akzo Nobel NV - Overview
- Akzo Nobel NV - Business segments
- Akzo Nobel NV - Key news
- Akzo Nobel NV - Key offerings
- Akzo Nobel NV - Segment focus
- 12.4 Arkema Group
- Arkema Group - Overview
- Arkema Group - Business segments
- Arkema Group - Key news
- Arkema Group - Key offerings
- Arkema Group - Segment focus
- 12.5 Ascensus Specialties LLC
- Ascensus Specialties LLC - Overview
- Ascensus Specialties LLC - Product / Service
- Ascensus Specialties LLC - Key offerings
- 12.6 BASF SE
- BASF SE - Overview
- BASF SE - Business segments
- BASF SE - Key news
- BASF SE - Key offerings
- BASF SE - Segment focus
- 12.7 Celanese Corp.
- Celanese Corp. - Overview
- Celanese Corp. - Business segments
- Celanese Corp. - Key news
- Celanese Corp. - Key offerings
- Celanese Corp. - Segment focus
- 12.8 ChemImpex International Inc.
- ChemImpex International Inc. - Overview
- ChemImpex International Inc. - Product / Service
- ChemImpex International Inc. - Key offerings
- 12.9 Dow Chemical Co.
- Dow Chemical Co. - Overview
- Dow Chemical Co. - Business segments
- Dow Chemical Co. - Key news
- Dow Chemical Co. - Key offerings
- Dow Chemical Co. - Segment focus
- 12.10 Eastman Chemical Co.
- Eastman Chemical Co. - Overview
- Eastman Chemical Co. - Business segments
- Eastman Chemical Co. - Key news
- Eastman Chemical Co. - Key offerings
- Eastman Chemical Co. - Segment focus
- 12.11 Enamine Ltd
- Enamine Ltd - Overview
- Enamine Ltd - Product / Service
- Enamine Ltd - Key offerings
- 12.12 Huntsman International LLC
- Huntsman International LLC - Overview
- Huntsman International LLC - Business segments
- Huntsman International LLC - Key news
- Huntsman International LLC - Key offerings
- Huntsman International LLC - Segment focus
- 12.13 LGC Science Group Holdings Ltd.
- LGC Science Group Holdings Ltd. - Overview
- LGC Science Group Holdings Ltd. - Product / Service
- LGC Science Group Holdings Ltd. - Key offerings
- 12.14 Merck KGaA
- Merck KGaA - Overview
- Merck KGaA - Business segments
- Merck KGaA - Key news
- Merck KGaA - Key offerings
- Merck KGaA - Segment focus
- 12.15 Solvay SA
- Solvay SA - Overview
- Solvay SA - Business segments
- Solvay SA - Key news
- Solvay SA - Key offerings
- Solvay SA - Segment focus
- 12.16 Thermo Fisher Scientific Inc.
- Thermo Fisher Scientific Inc. - Overview
- Thermo Fisher Scientific Inc. - Business segments
- Thermo Fisher Scientific Inc. - Key news
- Thermo Fisher Scientific Inc. - Key offerings
- Thermo Fisher Scientific Inc. - Segment focus
- 12.17 Tokyo Chemical Industry Co. Ltd.
- Tokyo Chemical Industry Co. Ltd. - Overview
- Tokyo Chemical Industry Co. Ltd. - Product / Service
- Tokyo Chemical Industry Co. Ltd. - Key offerings
13 Appendix
- 13.1 Scope of the report
- 13.2 Inclusions and exclusions checklist
- Inclusions checklist
- Exclusions checklist
- 13.3 Currency conversion rates for US$
- Currency conversion rates for US$
- 13.4 Research methodology
- Research methodology
- 13.5 Data procurement
- Information sources
- 13.6 Data validation
- Data validation
- 13.7 Validation techniques employed for market sizing
- Validation techniques employed for market sizing
- 13.8 Data synthesis
- Data synthesis
- 13.9 360 degree market analysis
- 360 degree market analysis
- 13.10 List of abbreviations
- List of abbreviations

