|
|
市場調査レポート
商品コード
1524877
RPAとハイパーオートメーションの世界市場 2024-2028Global RPA and hyperautomation market 2024-2028 |
||||||

|
|||||||
カスタマイズ可能
|
|||||||

| RPAとハイパーオートメーションの世界市場 2024-2028 |
|
出版日: 2024年07月03日
発行: TechNavio
ページ情報: 英文 165 Pages
納期: 即納可能
|

全表示
- 概要
- 図表
- 目次
RPAとハイパーオートメーション市場は2023-2028年に316億3,550万米ドル、予測期間中のCAGRは27.77%で成長すると予測されます。
当レポートでは、RPAとハイパーオートメーション市場の全体的な分析、市場規模・予測、動向、成長促進要因、課題、約25のベンダーを網羅したベンダー分析などを掲載しています。
現在の市場シナリオ、最新動向と促進要因、市場環境全体に関する最新分析を提供しています。市場は、主要産業における自動化ニーズの高まり、RPAとハイパーオートメーションにおける洗練された技術によるデジタルトランスフォーメーションの台頭、サービスの迅速な提供に対する需要の高まりによって牽引されています。
| 市場範囲 | |
|---|---|
| 基準年 | 2024 |
| 終了年 | 2028 |
| 予測期間 | 2024-2028 |
| 成長モメンタム | 加速 |
| 前年比2024年 | 22.76% |
| CAGR | 27.77% |
| 増分額 | 316億3,550万米ドル |
本調査では、今後数年間のRPAとハイパーオートメーション市場成長を牽引する主な要因の1つとして、技術進歩の拡大を挙げています。また、インテリジェント・プロセス・オートメーション(IPA)の利用拡大や戦略的パートナーシップの台頭は、同市場における大きな需要につながります。
目次
第1章 エグゼクティブサマリー
- 市場概要
第2章 市場情勢
- 市場エコシステム
- 市場の特徴
- バリューチェーン分析
第3章 市場規模の評価
- 市場の定義
- 市場セグメント分析
- 市場規模 2023
- 市場の見通し 2023-2028
第4章 市場規模実績
- 世界RPAとハイパーオートメーション市場 2018-2022
- コンポーネント別セグメント分析 2018-2022
- 技術別セグメント分析 2018-2022
- 地域別セグメント分析 2018-2022
- 国別セグメント分析 2018-2022
第5章 ファイブフォース分析
- ファイブフォースの要約
- 買い手の交渉力
- 供給企業の交渉力
- 新規参入業者の脅威
- 代替品の脅威
- 競争の脅威
- 市況
第6章 市場セグメンテーション:コンポーネント別
- 市場セグメンテーション
- 比較:コンポーネント別
- ソリューション:市場規模と予測 2023-2028
- サービス:市場規模と予測 2023-2028
- 市場機会:コンポーネント別
第7章 市場セグメンテーション:技術別
- 市場セグメンテーション
- 比較:技術別
- RPA(ロボティックプロセスオートメーション):市場規模と予測 2023-2028
- ビジネスプロセスマネジメント・スイート:市場規模と予測 2023-2028
- 意思決定管理システム:市場規模と予測 2023-2028
- サービスとしての統合プラットフォーム:市場規模と予測 2023-2028
- 市場機会:技術別
第8章 顧客情勢
- 顧客情勢の概要
第9章 地域別情勢
- 地域別セグメンテーション
- 地域別比較
- 北米:市場規模と予測 2023-2028
- アジア太平洋:市場規模と予測 2023-2028
- 欧州:市場規模と予測 2023-2028
- 南米:市場規模と予測 2023-2028
- 中東・アフリカ:市場規模と予測 2023-2028
- 米国:市場規模と予測 2023-2028
- 中国:市場規模と予測 2023-2028
- ドイツ:市場規模と予測 2023-2028
- 日本:市場規模と予測 2023-2028
- 英国:市場規模と予測 2023-2028
- 市場機会:地域情勢別
第10章 促進要因・課題・機会・抑制要因
- 市場促進要因
- 市場の課題
- 促進要因と課題の影響
- 市場の機会・抑制要因
第11章 競合情勢
- 概要
- 競合情勢
- 混乱の状況
- 業界のリスク
第12章 競合分析
- 企業プロファイル
- 企業の市場ポジショニング
- Alteryx Inc.
- Appian Corp.
- Automation Anywhere Inc.
- Celonis SE
- International Business Machines Corp.
- Juniper Networks Inc.
- Microsoft Corp.
- NICE Ltd.
- PagerDuty Inc.
- Pegasystems Inc.
- ProcessMaker Inc.
- SAP SE
- SolveXia Pty Ltd.
- UiPath Inc.
- Zendesk Inc.
第13章 付録
Exhibits:
- Exhibits1: Executive Summary - Chart on Market Overview
- Exhibits2: Executive Summary - Data Table on Market Overview
- Exhibits3: Executive Summary - Chart on Global Market Characteristics
- Exhibits4: Executive Summary - Chart on Market By Geographical Landscape
- Exhibits5: Executive Summary - Chart on Market Segmentation by Component
- Exhibits6: Executive Summary - Chart on Market Segmentation by Technology
- Exhibits7: Executive Summary - Chart on Incremental Growth
- Exhibits8: Executive Summary - Data Table on Incremental Growth
- Exhibits9: Executive Summary - Chart on Company Market Positioning
- Exhibits10: Parent Market
- Exhibits11: Data Table on - Parent Market
- Exhibits12: Market characteristics analysis
- Exhibits13: Value Chain Analysis
- Exhibits14: Offerings of companies included in the market definition
- Exhibits15: Market segments
- Exhibits16: Chart on Global - Market size and forecast 2023-2028 ($ million)
- Exhibits17: Data Table on Global - Market size and forecast 2023-2028 ($ million)
- Exhibits18: Chart on Global Market: Year-over-year growth 2023-2028 (%)
- Exhibits19: Data Table on Global Market: Year-over-year growth 2023-2028 (%)
- Exhibits20: Historic Market Size - Data Table on Global RPA And Hyperautomation Market 2018 - 2022 ($ million)
- Exhibits21: Historic Market Size - Component Segment 2018 - 2022 ($ million)
- Exhibits22: Historic Market Size - Technology Segment 2018 - 2022 ($ million)
- Exhibits23: Historic Market Size - Geography Segment 2018 - 2022 ($ million)
- Exhibits24: Historic Market Size - Country Segment 2018 - 2022 ($ million)
- Exhibits25: Five forces analysis - Comparison between 2023 and 2028
- Exhibits26: Bargaining power of buyers - Impact of key factors 2023 and 2028
- Exhibits27: Bargaining power of suppliers - Impact of key factors in 2023 and 2028
- Exhibits28: Threat of new entrants - Impact of key factors in 2023 and 2028
- Exhibits29: Threat of substitutes - Impact of key factors in 2023 and 2028
- Exhibits30: Threat of rivalry - Impact of key factors in 2023 and 2028
- Exhibits31: Chart on Market condition - Five forces 2023 and 2028
- Exhibits32: Chart on Component - Market share 2023-2028 (%)
- Exhibits33: Data Table on Component - Market share 2023-2028 (%)
- Exhibits34: Chart on Comparison by Component
- Exhibits35: Data Table on Comparison by Component
- Exhibits36: Chart on Solutions - Market size and forecast 2023-2028 ($ million)
- Exhibits37: Data Table on Solutions - Market size and forecast 2023-2028 ($ million)
- Exhibits38: Chart on Solutions - Year-over-year growth 2023-2028 (%)
- Exhibits39: Data Table on Solutions - Year-over-year growth 2023-2028 (%)
- Exhibits40: Chart on Services - Market size and forecast 2023-2028 ($ million)
- Exhibits41: Data Table on Services - Market size and forecast 2023-2028 ($ million)
- Exhibits42: Chart on Services - Year-over-year growth 2023-2028 (%)
- Exhibits43: Data Table on Services - Year-over-year growth 2023-2028 (%)
- Exhibits44: Market opportunity by Component ($ million)
- Exhibits45: Data Table on Market opportunity by Component ($ million)
- Exhibits46: Chart on Technology - Market share 2023-2028 (%)
- Exhibits47: Data Table on Technology - Market share 2023-2028 (%)
- Exhibits48: Chart on Comparison by Technology
- Exhibits49: Data Table on Comparison by Technology
- Exhibits50: Chart on RPA - Market size and forecast 2023-2028 ($ million)
- Exhibits51: Data Table on RPA - Market size and forecast 2023-2028 ($ million)
- Exhibits52: Chart on RPA - Year-over-year growth 2023-2028 (%)
- Exhibits53: Data Table on RPA - Year-over-year growth 2023-2028 (%)
- Exhibits54: Chart on Business process management suites - Market size and forecast 2023-2028 ($ million)
- Exhibits55: Data Table on Business process management suites - Market size and forecast 2023-2028 ($ million)
- Exhibits56: Chart on Business process management suites - Year-over-year growth 2023-2028 (%)
- Exhibits57: Data Table on Business process management suites - Year-over-year growth 2023-2028 (%)
- Exhibits58: Chart on Decision management systems - Market size and forecast 2023-2028 ($ million)
- Exhibits59: Data Table on Decision management systems - Market size and forecast 2023-2028 ($ million)
- Exhibits60: Chart on Decision management systems - Year-over-year growth 2023-2028 (%)
- Exhibits61: Data Table on Decision management systems - Year-over-year growth 2023-2028 (%)
- Exhibits62: Chart on Integration platform as a service - Market size and forecast 2023-2028 ($ million)
- Exhibits63: Data Table on Integration platform as a service - Market size and forecast 2023-2028 ($ million)
- Exhibits64: Chart on Integration platform as a service - Year-over-year growth 2023-2028 (%)
- Exhibits65: Data Table on Integration platform as a service - Year-over-year growth 2023-2028 (%)
- Exhibits66: Market opportunity by Technology ($ million)
- Exhibits67: Data Table on Market opportunity by Technology ($ million)
- Exhibits68: Analysis of price sensitivity, lifecycle, customer purchase basket, adoption rates, and purchase criteria
- Exhibits69: Chart on Market share By Geographical Landscape 2023-2028 (%)
- Exhibits70: Data Table on Market share By Geographical Landscape 2023-2028 (%)
- Exhibits71: Chart on Geographic comparison
- Exhibits72: Data Table on Geographic comparison
- Exhibits73: Chart on North America - Market size and forecast 2023-2028 ($ million)
- Exhibits74: Data Table on North America - Market size and forecast 2023-2028 ($ million)
- Exhibits75: Chart on North America - Year-over-year growth 2023-2028 (%)
- Exhibits76: Data Table on North America - Year-over-year growth 2023-2028 (%)
- Exhibits77: Chart on APAC - Market size and forecast 2023-2028 ($ million)
- Exhibits78: Data Table on APAC - Market size and forecast 2023-2028 ($ million)
- Exhibits79: Chart on APAC - Year-over-year growth 2023-2028 (%)
- Exhibits80: Data Table on APAC - Year-over-year growth 2023-2028 (%)
- Exhibits81: Chart on Europe - Market size and forecast 2023-2028 ($ million)
- Exhibits82: Data Table on Europe - Market size and forecast 2023-2028 ($ million)
- Exhibits83: Chart on Europe - Year-over-year growth 2023-2028 (%)
- Exhibits84: Data Table on Europe - Year-over-year growth 2023-2028 (%)
- Exhibits85: Chart on South America - Market size and forecast 2023-2028 ($ million)
- Exhibits86: Data Table on South America - Market size and forecast 2023-2028 ($ million)
- Exhibits87: Chart on South America - Year-over-year growth 2023-2028 (%)
- Exhibits88: Data Table on South America - Year-over-year growth 2023-2028 (%)
- Exhibits89: Chart on Middle East and Africa - Market size and forecast 2023-2028 ($ million)
- Exhibits90: Data Table on Middle East and Africa - Market size and forecast 2023-2028 ($ million)
- Exhibits91: Chart on Middle East and Africa - Year-over-year growth 2023-2028 (%)
- Exhibits92: Data Table on Middle East and Africa - Year-over-year growth 2023-2028 (%)
- Exhibits93: Chart on US - Market size and forecast 2023-2028 ($ million)
- Exhibits94: Data Table on US - Market size and forecast 2023-2028 ($ million)
- Exhibits95: Chart on US - Year-over-year growth 2023-2028 (%)
- Exhibits96: Data Table on US - Year-over-year growth 2023-2028 (%)
- Exhibits97: Chart on China - Market size and forecast 2023-2028 ($ million)
- Exhibits98: Data Table on China - Market size and forecast 2023-2028 ($ million)
- Exhibits99: Chart on China - Year-over-year growth 2023-2028 (%)
- Exhibits100: Data Table on China - Year-over-year growth 2023-2028 (%)
- Exhibits101: Chart on Germany - Market size and forecast 2023-2028 ($ million)
- Exhibits102: Data Table on Germany - Market size and forecast 2023-2028 ($ million)
- Exhibits103: Chart on Germany - Year-over-year growth 2023-2028 (%)
- Exhibits104: Data Table on Germany - Year-over-year growth 2023-2028 (%)
- Exhibits105: Chart on Japan - Market size and forecast 2023-2028 ($ million)
- Exhibits106: Data Table on Japan - Market size and forecast 2023-2028 ($ million)
- Exhibits107: Chart on Japan - Year-over-year growth 2023-2028 (%)
- Exhibits108: Data Table on Japan - Year-over-year growth 2023-2028 (%)
- Exhibits109: Chart on UK - Market size and forecast 2023-2028 ($ million)
- Exhibits110: Data Table on UK - Market size and forecast 2023-2028 ($ million)
- Exhibits111: Chart on UK - Year-over-year growth 2023-2028 (%)
- Exhibits112: Data Table on UK - Year-over-year growth 2023-2028 (%)
- Exhibits113: Market opportunity By Geographical Landscape ($ million)
- Exhibits114: Data Tables on Market opportunity By Geographical Landscape ($ million)
- Exhibits115: Impact of drivers and challenges in 2023 and 2028
- Exhibits116: Overview on criticality of inputs and factors of differentiation
- Exhibits117: Overview on factors of disruption
- Exhibits118: Impact of key risks on business
- Exhibits119: Companies covered
- Exhibits120: Matrix on companies position and classification
- Exhibits121: Alteryx Inc. - Overview
- Exhibits122: Alteryx Inc. - Product / Service
- Exhibits123: Alteryx Inc. - Key news
- Exhibits124: Alteryx Inc. - Key offerings
- Exhibits125: Appian Corp. - Overview
- Exhibits126: Appian Corp. - Product / Service
- Exhibits127: Appian Corp. - Key news
- Exhibits128: Appian Corp. - Key offerings
- Exhibits129: Automation Anywhere Inc. - Overview
- Exhibits130: Automation Anywhere Inc. - Product / Service
- Exhibits131: Automation Anywhere Inc. - Key offerings
- Exhibits132: Celonis SE - Overview
- Exhibits133: Celonis SE - Product / Service
- Exhibits134: Celonis SE - Key offerings
- Exhibits135: International Business Machines Corp. - Overview
- Exhibits136: International Business Machines Corp. - Business segments
- Exhibits137: International Business Machines Corp. - Key news
- Exhibits138: International Business Machines Corp. - Key offerings
- Exhibits139: International Business Machines Corp. - Segment focus
- Exhibits140: Juniper Networks Inc. - Overview
- Exhibits141: Juniper Networks Inc. - Product / Service
- Exhibits142: Juniper Networks Inc. - Key news
- Exhibits143: Juniper Networks Inc. - Key offerings
- Exhibits144: Microsoft Corp. - Overview
- Exhibits145: Microsoft Corp. - Business segments
- Exhibits146: Microsoft Corp. - Key news
- Exhibits147: Microsoft Corp. - Key offerings
- Exhibits148: Microsoft Corp. - Segment focus
- Exhibits149: NICE Ltd. - Overview
- Exhibits150: NICE Ltd. - Business segments
- Exhibits151: NICE Ltd. - Key news
- Exhibits152: NICE Ltd. - Key offerings
- Exhibits153: NICE Ltd. - Segment focus
- Exhibits154: PagerDuty Inc. - Overview
- Exhibits155: PagerDuty Inc. - Product / Service
- Exhibits156: PagerDuty Inc. - Key offerings
- Exhibits157: Pegasystems Inc. - Overview
- Exhibits158: Pegasystems Inc. - Product / Service
- Exhibits159: Pegasystems Inc. - Key news
- Exhibits160: Pegasystems Inc. - Key offerings
- Exhibits161: ProcessMaker Inc. - Overview
- Exhibits162: ProcessMaker Inc. - Product / Service
- Exhibits163: ProcessMaker Inc. - Key offerings
- Exhibits164: SAP SE - Overview
- Exhibits165: SAP SE - Business segments
- Exhibits166: SAP SE - Key news
- Exhibits167: SAP SE - Key offerings
- Exhibits168: SAP SE - Segment focus
- Exhibits169: SolveXia Pty Ltd. - Overview
- Exhibits170: SolveXia Pty Ltd. - Product / Service
- Exhibits171: SolveXia Pty Ltd. - Key offerings
- Exhibits172: UiPath Inc. - Overview
- Exhibits173: UiPath Inc. - Product / Service
- Exhibits174: UiPath Inc. - Key news
- Exhibits175: UiPath Inc. - Key offerings
- Exhibits176: Zendesk Inc. - Overview
- Exhibits177: Zendesk Inc. - Product / Service
- Exhibits178: Zendesk Inc. - Key offerings
- Exhibits179: Inclusions checklist
- Exhibits180: Exclusions checklist
- Exhibits181: Currency conversion rates for US$
- Exhibits182: Research methodology
- Exhibits183: Information sources
- Exhibits184: Data validation
- Exhibits185: Validation techniques employed for market sizing
- Exhibits186: Data synthesis
- Exhibits187: 360 degree market analysis
- Exhibits188: List of abbreviations
The RPA and hyperautomation market is forecasted to grow by USD 31635.5 mn during 2023-2028, accelerating at a CAGR of 27.77% during the forecast period. The report on the RPA and hyperautomation market provides a holistic analysis, market size and forecast, trends, growth drivers, and challenges, as well as vendor analysis covering around 25 vendors.
The report offers an up-to-date analysis regarding the current market scenario, the latest trends and drivers, and the overall market environment. The market is driven by rise in need for automation within major industries, rise of digital transformation with sophisticated techniques in RPA and hyperautomation, and rise in demand for fast delivery of services.
Technavio's RPA and hyperautomation market is segmented as below:
| Market Scope | |
|---|---|
| Base Year | 2024 |
| End Year | 2028 |
| Series Year | 2024-2028 |
| Growth Momentum | Accelerate |
| YOY 2024 | 22.76% |
| CAGR | 27.77% |
| Incremental Value | $31635.5mn |
By Component
- Solutions
- Services
By Technology
- RPA
- Business process management suites
- Decision management systems
- Integration platform as a service
By Geographical Landscape
- North America
- APAC
- Europe
- South America
- Middle East and Africa
This study identifies the growing technological advancements as one of the prime reasons driving the RPA and hyperautomation market growth during the next few years. Also, growing use of intelligent process automation (IPA) and rising strategic partnerships will lead to sizable demand in the market.
The report on the RPA and hyperautomation market covers the following areas:
- RPA and hyperautomation market sizing
- RPA and hyperautomation market forecast
- RPA and hyperautomation market industry analysis
The robust vendor analysis is designed to help clients improve their market position, and in line with this, this report provides a detailed analysis of several leading RPA and hyperautomation market vendors that include Akabot, Alteryx Inc., Appian Corp., Automation Anywhere Inc., Celonis SE, Compulink Management Center Inc., Datamatics Global Services Limited, Fortra LLC, International Business Machines Corp., Juniper Networks Inc., Microsoft Corp., NICE Ltd., PagerDuty Inc., Pegasystems Inc., ProcessMaker Inc., SAP SE, SolveXia Pty Ltd., SS and C Technologies Holdings Inc., UiPath Inc., and Zendesk Inc.. Also, the RPA and hyperautomation market analysis report includes information on upcoming trends and challenges that will influence market growth. This is to help companies strategize and leverage all forthcoming growth opportunities.
The study was conducted using an objective combination of primary and secondary information including inputs from key participants in the industry. The report contains a comprehensive market and vendor landscape in addition to an analysis of the key vendors.
The publisher presents a detailed picture of the market by the way of study, synthesis, and summation of data from multiple sources by an analysis of key parameters such as profit, pricing, competition, and promotions. IT presents various market facets by identifying the key industry influencers. The data presented is comprehensive, reliable, and a result of extensive research - both primary and secondary. The market research reports provide a complete competitive landscape and an in-depth vendor selection methodology and analysis using qualitative and quantitative research to forecast the accurate market growth.
Table of Contents
1 Executive Summary
- 1.1 Market overview
- Executive Summary - Chart on Market Overview
- Executive Summary - Data Table on Market Overview
- Executive Summary - Chart on Global Market Characteristics
- Executive Summary - Chart on Market By Geographical Landscape
- Executive Summary - Chart on Market Segmentation by Component
- Executive Summary - Chart on Market Segmentation by Technology
- Executive Summary - Chart on Incremental Growth
- Executive Summary - Data Table on Incremental Growth
- Executive Summary - Chart on Company Market Positioning
2 Market Landscape
- 2.1 Market ecosystem
- Parent Market
- Data Table on - Parent Market
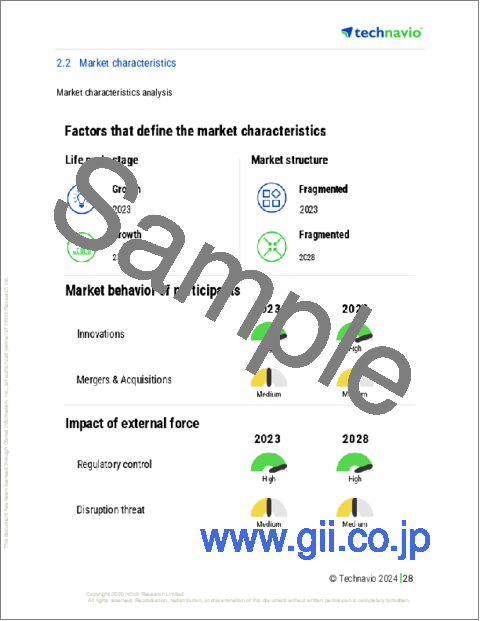
- 2.2 Market characteristics
- Market characteristics analysis
- 2.3 Value chain analysis
- Value Chain Analysis
3 Market Sizing
- 3.1 Market definition
- Offerings of companies included in the market definition
- 3.2 Market segment analysis
- Market segments
- 3.3 Market size 2023
- 3.4 Market outlook: Forecast for 2023-2028
- Chart on Global - Market size and forecast 2023-2028 ($ million)
- Data Table on Global - Market size and forecast 2023-2028 ($ million)
- Chart on Global Market: Year-over-year growth 2023-2028 (%)
- Data Table on Global Market: Year-over-year growth 2023-2028 (%)
4 Historic Market Size
- 4.1 Global RPA And Hyperautomation Market 2018 - 2022
- Historic Market Size - Data Table on Global RPA And Hyperautomation Market 2018 - 2022 ($ million)
- 4.2 Component segment analysis 2018 - 2022
- Historic Market Size - Component Segment 2018 - 2022 ($ million)
- 4.3 Technology segment analysis 2018 - 2022
- Historic Market Size - Technology Segment 2018 - 2022 ($ million)
- 4.4 Geography segment analysis 2018 - 2022
- Historic Market Size - Geography Segment 2018 - 2022 ($ million)
- 4.5 Country segment analysis 2018 - 2022
- Historic Market Size - Country Segment 2018 - 2022 ($ million)
5 Five Forces Analysis
- 5.1 Five forces summary
- Five forces analysis - Comparison between 2023 and 2028
- 5.2 Bargaining power of buyers
- Bargaining power of buyers - Impact of key factors 2023 and 2028
- 5.3 Bargaining power of suppliers
- Bargaining power of suppliers - Impact of key factors in 2023 and 2028
- 5.4 Threat of new entrants
- Threat of new entrants - Impact of key factors in 2023 and 2028
- 5.5 Threat of substitutes
- Threat of substitutes - Impact of key factors in 2023 and 2028
- 5.6 Threat of rivalry
- Threat of rivalry - Impact of key factors in 2023 and 2028
- 5.7 Market condition
- Chart on Market condition - Five forces 2023 and 2028
6 Market Segmentation by Component
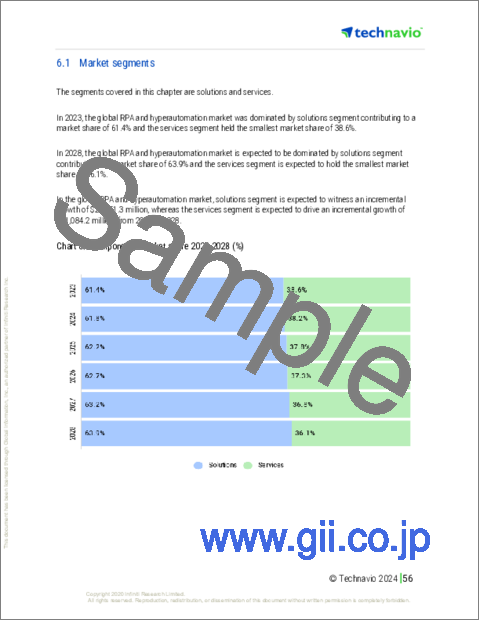
- 6.1 Market segments
- Chart on Component - Market share 2023-2028 (%)
- Data Table on Component - Market share 2023-2028 (%)
- 6.2 Comparison by Component
- Chart on Comparison by Component
- Data Table on Comparison by Component
- 6.3 Solutions - Market size and forecast 2023-2028
- Chart on Solutions - Market size and forecast 2023-2028 ($ million)
- Data Table on Solutions - Market size and forecast 2023-2028 ($ million)
- Chart on Solutions - Year-over-year growth 2023-2028 (%)
- Data Table on Solutions - Year-over-year growth 2023-2028 (%)
- 6.4 Services - Market size and forecast 2023-2028
- Chart on Services - Market size and forecast 2023-2028 ($ million)
- Data Table on Services - Market size and forecast 2023-2028 ($ million)
- Chart on Services - Year-over-year growth 2023-2028 (%)
- Data Table on Services - Year-over-year growth 2023-2028 (%)
- 6.5 Market opportunity by Component
- Market opportunity by Component ($ million)
- Data Table on Market opportunity by Component ($ million)
7 Market Segmentation by Technology
- 7.1 Market segments
- Chart on Technology - Market share 2023-2028 (%)
- Data Table on Technology - Market share 2023-2028 (%)
- 7.2 Comparison by Technology
- Chart on Comparison by Technology
- Data Table on Comparison by Technology
- 7.3 RPA - Market size and forecast 2023-2028
- Chart on RPA - Market size and forecast 2023-2028 ($ million)
- Data Table on RPA - Market size and forecast 2023-2028 ($ million)
- Chart on RPA - Year-over-year growth 2023-2028 (%)
- Data Table on RPA - Year-over-year growth 2023-2028 (%)
- 7.4 Business process management suites - Market size and forecast 2023-2028
- Chart on Business process management suites - Market size and forecast 2023-2028 ($ million)
- Data Table on Business process management suites - Market size and forecast 2023-2028 ($ million)
- Chart on Business process management suites - Year-over-year growth 2023-2028 (%)
- Data Table on Business process management suites - Year-over-year growth 2023-2028 (%)
- 7.5 Decision management systems - Market size and forecast 2023-2028
- Chart on Decision management systems - Market size and forecast 2023-2028 ($ million)
- Data Table on Decision management systems - Market size and forecast 2023-2028 ($ million)
- Chart on Decision management systems - Year-over-year growth 2023-2028 (%)
- Data Table on Decision management systems - Year-over-year growth 2023-2028 (%)
- 7.6 Integration platform as a service - Market size and forecast 2023-2028
- Chart on Integration platform as a service - Market size and forecast 2023-2028 ($ million)
- Data Table on Integration platform as a service - Market size and forecast 2023-2028 ($ million)
- Chart on Integration platform as a service - Year-over-year growth 2023-2028 (%)
- Data Table on Integration platform as a service - Year-over-year growth 2023-2028 (%)
- 7.7 Market opportunity by Technology
- Market opportunity by Technology ($ million)
- Data Table on Market opportunity by Technology ($ million)
8 Customer Landscape
- 8.1 Customer landscape overview
- Analysis of price sensitivity, lifecycle, customer purchase basket, adoption rates, and purchase criteria
9 Geographic Landscape
- 9.1 Geographic segmentation
- Chart on Market share By Geographical Landscape 2023-2028 (%)
- Data Table on Market share By Geographical Landscape 2023-2028 (%)
- 9.2 Geographic comparison
- Chart on Geographic comparison
- Data Table on Geographic comparison
- 9.3 North America - Market size and forecast 2023-2028
- Chart on North America - Market size and forecast 2023-2028 ($ million)
- Data Table on North America - Market size and forecast 2023-2028 ($ million)
- Chart on North America - Year-over-year growth 2023-2028 (%)
- Data Table on North America - Year-over-year growth 2023-2028 (%)
- 9.4 APAC - Market size and forecast 2023-2028
- Chart on APAC - Market size and forecast 2023-2028 ($ million)
- Data Table on APAC - Market size and forecast 2023-2028 ($ million)
- Chart on APAC - Year-over-year growth 2023-2028 (%)
- Data Table on APAC - Year-over-year growth 2023-2028 (%)
- 9.5 Europe - Market size and forecast 2023-2028
- Chart on Europe - Market size and forecast 2023-2028 ($ million)
- Data Table on Europe - Market size and forecast 2023-2028 ($ million)
- Chart on Europe - Year-over-year growth 2023-2028 (%)
- Data Table on Europe - Year-over-year growth 2023-2028 (%)
- 9.6 South America - Market size and forecast 2023-2028
- Chart on South America - Market size and forecast 2023-2028 ($ million)
- Data Table on South America - Market size and forecast 2023-2028 ($ million)
- Chart on South America - Year-over-year growth 2023-2028 (%)
- Data Table on South America - Year-over-year growth 2023-2028 (%)
- 9.7 Middle East and Africa - Market size and forecast 2023-2028
- Chart on Middle East and Africa - Market size and forecast 2023-2028 ($ million)
- Data Table on Middle East and Africa - Market size and forecast 2023-2028 ($ million)
- Chart on Middle East and Africa - Year-over-year growth 2023-2028 (%)
- Data Table on Middle East and Africa - Year-over-year growth 2023-2028 (%)
- 9.8 US - Market size and forecast 2023-2028
- Chart on US - Market size and forecast 2023-2028 ($ million)
- Data Table on US - Market size and forecast 2023-2028 ($ million)
- Chart on US - Year-over-year growth 2023-2028 (%)
- Data Table on US - Year-over-year growth 2023-2028 (%)
- 9.9 China - Market size and forecast 2023-2028
- Chart on China - Market size and forecast 2023-2028 ($ million)
- Data Table on China - Market size and forecast 2023-2028 ($ million)
- Chart on China - Year-over-year growth 2023-2028 (%)
- Data Table on China - Year-over-year growth 2023-2028 (%)
- 9.10 Germany - Market size and forecast 2023-2028
- Chart on Germany - Market size and forecast 2023-2028 ($ million)
- Data Table on Germany - Market size and forecast 2023-2028 ($ million)
- Chart on Germany - Year-over-year growth 2023-2028 (%)
- Data Table on Germany - Year-over-year growth 2023-2028 (%)
- 9.11 Japan - Market size and forecast 2023-2028
- Chart on Japan - Market size and forecast 2023-2028 ($ million)
- Data Table on Japan - Market size and forecast 2023-2028 ($ million)
- Chart on Japan - Year-over-year growth 2023-2028 (%)
- Data Table on Japan - Year-over-year growth 2023-2028 (%)
- 9.12 UK - Market size and forecast 2023-2028
- Chart on UK - Market size and forecast 2023-2028 ($ million)
- Data Table on UK - Market size and forecast 2023-2028 ($ million)
- Chart on UK - Year-over-year growth 2023-2028 (%)
- Data Table on UK - Year-over-year growth 2023-2028 (%)
- 9.13 Market opportunity By Geographical Landscape
- Market opportunity By Geographical Landscape ($ million)
- Data Tables on Market opportunity By Geographical Landscape ($ million)
10 Drivers, Challenges, and Opportunity/Restraints
- 10.1 Market drivers
- 10.2 Market challenges
- 10.3 Impact of drivers and challenges
- Impact of drivers and challenges in 2023 and 2028
- 10.4 Market opportunities/restraints
11 Competitive Landscape
- 11.1 Overview
- 11.2 Competitive Landscape
- Overview on criticality of inputs and factors of differentiation
- 11.3 Landscape disruption
- Overview on factors of disruption
- 11.4 Industry risks
- Impact of key risks on business
12 Competitive Analysis
- 12.1 Companies profiled
- Companies covered
- 12.2 Market positioning of companies
- Matrix on companies position and classification
- 12.3 Alteryx Inc.
- Alteryx Inc. - Overview
- Alteryx Inc. - Product / Service
- Alteryx Inc. - Key news
- Alteryx Inc. - Key offerings
- 12.4 Appian Corp.
- Appian Corp. - Overview
- Appian Corp. - Product / Service
- Appian Corp. - Key news
- Appian Corp. - Key offerings
- 12.5 Automation Anywhere Inc.
- Automation Anywhere Inc. - Overview
- Automation Anywhere Inc. - Product / Service
- Automation Anywhere Inc. - Key offerings
- 12.6 Celonis SE
- Celonis SE - Overview
- Celonis SE - Product / Service
- Celonis SE - Key offerings
- 12.7 International Business Machines Corp.
- International Business Machines Corp. - Overview
- International Business Machines Corp. - Business segments
- International Business Machines Corp. - Key news
- International Business Machines Corp. - Key offerings
- International Business Machines Corp. - Segment focus
- 12.8 Juniper Networks Inc.
- Juniper Networks Inc. - Overview
- Juniper Networks Inc. - Product / Service
- Juniper Networks Inc. - Key news
- Juniper Networks Inc. - Key offerings
- 12.9 Microsoft Corp.
- Microsoft Corp. - Overview
- Microsoft Corp. - Business segments
- Microsoft Corp. - Key news
- Microsoft Corp. - Key offerings
- Microsoft Corp. - Segment focus
- 12.10 NICE Ltd.
- NICE Ltd. - Overview
- NICE Ltd. - Business segments
- NICE Ltd. - Key news
- NICE Ltd. - Key offerings
- NICE Ltd. - Segment focus
- 12.11 PagerDuty Inc.
- PagerDuty Inc. - Overview
- PagerDuty Inc. - Product / Service
- PagerDuty Inc. - Key offerings
- 12.12 Pegasystems Inc.
- Pegasystems Inc. - Overview
- Pegasystems Inc. - Product / Service
- Pegasystems Inc. - Key news
- Pegasystems Inc. - Key offerings
- 12.13 ProcessMaker Inc.
- ProcessMaker Inc. - Overview
- ProcessMaker Inc. - Product / Service
- ProcessMaker Inc. - Key offerings
- 12.14 SAP SE
- SAP SE - Overview
- SAP SE - Business segments
- SAP SE - Key news
- SAP SE - Key offerings
- SAP SE - Segment focus
- 12.15 SolveXia Pty Ltd.
- SolveXia Pty Ltd. - Overview
- SolveXia Pty Ltd. - Product / Service
- SolveXia Pty Ltd. - Key offerings
- 12.16 UiPath Inc.
- UiPath Inc. - Overview
- UiPath Inc. - Product / Service
- UiPath Inc. - Key news
- UiPath Inc. - Key offerings
- 12.17 Zendesk Inc.
- Zendesk Inc. - Overview
- Zendesk Inc. - Product / Service
- Zendesk Inc. - Key offerings
13 Appendix
- 13.1 Scope of the report
- 13.2 Inclusions and exclusions checklist
- Inclusions checklist
- Exclusions checklist
- 13.3 Currency conversion rates for US$
- Currency conversion rates for US$
- 13.4 Research methodology
- Research methodology
- 13.5 Data procurement
- Information sources
- 13.6 Data validation
- Data validation
- 13.7 Validation techniques employed for market sizing
- Validation techniques employed for market sizing
- 13.8 Data synthesis
- Data synthesis
- 360 degree market analysis
- 360 degree market analysis
- 13.10 List of abbreviations
- List of abbreviations
