|
|
市場調査レポート
商品コード
1524791
自動車用ヒューズの世界市場 2024-2028Global automotive fuse market 2024-2028 |
||||||

|
|||||||
カスタマイズ可能
|
|||||||


| 自動車用ヒューズの世界市場 2024-2028 |
|
出版日: 2024年07月03日
発行: TechNavio
ページ情報: 英文 136 Pages
納期: 即納可能
|

全表示
- 概要
- 図表
- 目次
自動車用ヒューズ市場2024-2028
自動車用ヒューズ市場は2023-2028年に52億510万米ドル、予測期間中のCAGRは4.5%で成長すると予測されます。当レポートでは、自動車用ヒューズ市場の全体的な分析、市場規模・予測、動向、成長促進要因、課題、約25のベンダーを網羅したベンダー分析などを掲載しています。
現在の市場シナリオ、最新動向と促進要因、市場環境全体に関する最新分析を提供しています。市場は、EVやHEVの高価な部品を保護するためのヒューズの要件、LI-イオン電池の価格低下、ハイブリッド車や電気自動車の電子コンテンツの増加によって牽引されています。
| 市場範囲 | |
|---|---|
| 基準年 | 2024 |
| 終了年 | 2028 |
| 予測期間 | 2024-2028 |
| 成長モメンタム | 加速 |
| 前年比2024年 | 4.23% |
| CAGR | 4.5% |
| 増分額 | 52億510万米ドル |
本調査では、今後数年間の自動車用ヒューズ市場成長を牽引する主な要因の1つとして、EVおよびHEV専用ヒューズの市場開発を挙げています。また、先進的な電気自動車充電システムの採用が増加し、ヒューズがサーキットブレーカーに置き換わることで、市場の大きな需要が見込まれます。
目次
第1章 エグゼクティブサマリー
- 市場概要
第2章 市場情勢
- 市場エコシステム
- 市場の特徴
- バリューチェーン分析
第3章 市場規模の評価
- 市場の定義
- 市場セグメント分析
- 市場規模 2023
- 市場の見通し 2023-2028
第4章 市場規模実績
- 世界自動車用ヒューズ市場 2018-2022
- 車両タイプ別セグメント分析 2018-2022
- 地域別セグメント分析 2018-2022
- 国別セグメント分析 2018-2022
第5章 ファイブフォース分析
- ファイブフォースの要約
- 買い手の交渉力
- 供給企業の交渉力
- 新規参入業者の脅威
- 代替品の脅威
- 競争の脅威
- 市況
第6章 市場セグメンテーション:車両タイプ別
- 市場セグメンテーション
- 比較:車両タイプ別
- 乗用車:市場規模と予測 2023-2028
- 商用車:市場規模と予測 2023-2028
- 市場機会:車両タイプ別
第7章 顧客情勢
- 顧客情勢の概要
第8章 地域別情勢
- 地域別セグメンテーション
- 地域別比較
- アジア太平洋:市場規模と予測 2023-2028
- 北米:市場規模と予測 2023-2028
- 欧州:市場規模と予測 2023-2028
- 中東・アフリカ:市場規模と予測 2023-2028
- 南米:市場規模と予測 2023-2028
- 中国:市場規模と予測 2023-2028
- 米国:市場規模と予測 2023-2028
- 日本:市場規模と予測 2023-2028
- インド:市場規模と予測 2023-2028
- ドイツ:市場規模と予測 2023-2028
- 市場機会:地域情勢別
第9章 促進要因・課題・機会・抑制要因
- 市場促進要因
- 市場の課題
- 促進要因と課題の影響
- 市場の機会・抑制要因
第10章 競合情勢
- 概要
- 競合情勢
- 混乱の状況
- 業界のリスク
第11章 競合分析
- 企業プロファイル
- 企業の市場ポジショニング
- AEM Components USA Inc.
- Eaton Corp. Plc
- ETA Elektrotechnische Apparate GmbH
- Fuzetec Technology Co. Ltd.
- GLOSO TECH Inc.
- Littelfuse Inc.
- Mersen Corporate Services SAS
- OptiFuse
- Pacific Engineering Corp.
- SCHURTER Holding AG
第12章 付録
Exhibits:
- Exhibits1: Executive Summary - Chart on Market Overview
- Exhibits2: Executive Summary - Data Table on Market Overview
- Exhibits3: Executive Summary - Chart on Global Market Characteristics
- Exhibits4: Executive Summary - Chart on Market By Geographical Landscape
- Exhibits5: Executive Summary - Chart on Market Segmentation by Vehicle Type
- Exhibits6: Executive Summary - Chart on Incremental Growth
- Exhibits7: Executive Summary - Data Table on Incremental Growth
- Exhibits8: Executive Summary - Chart on Company Market Positioning
- Exhibits9: Parent Market
- Exhibits10: Data Table on - Parent Market
- Exhibits11: Market characteristics analysis
- Exhibits12: Value Chain Analysis
- Exhibits13: Offerings of companies included in the market definition
- Exhibits14: Market segments
- Exhibits15: Chart on Global - Market size and forecast 2023-2028 ($ million)
- Exhibits16: Data Table on Global - Market size and forecast 2023-2028 ($ million)
- Exhibits17: Chart on Global Market: Year-over-year growth 2023-2028 (%)
- Exhibits18: Data Table on Global Market: Year-over-year growth 2023-2028 (%)
- Exhibits19: Historic Market Size - Data Table on Global Automotive Fuse Market 2018 - 2022 ($ million)
- Exhibits20: Historic Market Size - Vehicle Type Segment 2018 - 2022 ($ million)
- Exhibits21: Historic Market Size - Geography Segment 2018 - 2022 ($ million)
- Exhibits22: Historic Market Size - Country Segment 2018 - 2022 ($ million)
- Exhibits23: Five forces analysis - Comparison between 2023 and 2028
- Exhibits24: Bargaining power of buyers - Impact of key factors 2023 and 2028
- Exhibits25: Bargaining power of suppliers - Impact of key factors in 2023 and 2028
- Exhibits26: Threat of new entrants - Impact of key factors in 2023 and 2028
- Exhibits27: Threat of substitutes - Impact of key factors in 2023 and 2028
- Exhibits28: Threat of rivalry - Impact of key factors in 2023 and 2028
- Exhibits29: Chart on Market condition - Five forces 2023 and 2028
- Exhibits30: Chart on Vehicle Type - Market share 2023-2028 (%)
- Exhibits31: Data Table on Vehicle Type - Market share 2023-2028 (%)
- Exhibits32: Chart on Comparison by Vehicle Type
- Exhibits33: Data Table on Comparison by Vehicle Type
- Exhibits34: Chart on Passenger vehicle - Market size and forecast 2023-2028 ($ million)
- Exhibits35: Data Table on Passenger vehicle - Market size and forecast 2023-2028 ($ million)
- Exhibits36: Chart on Passenger vehicle - Year-over-year growth 2023-2028 (%)
- Exhibits37: Data Table on Passenger vehicle - Year-over-year growth 2023-2028 (%)
- Exhibits38: Chart on Commercial vehicle - Market size and forecast 2023-2028 ($ million)
- Exhibits39: Data Table on Commercial vehicle - Market size and forecast 2023-2028 ($ million)
- Exhibits40: Chart on Commercial vehicle - Year-over-year growth 2023-2028 (%)
- Exhibits41: Data Table on Commercial vehicle - Year-over-year growth 2023-2028 (%)
- Exhibits42: Market opportunity by Vehicle Type ($ million)
- Exhibits43: Data Table on Market opportunity by Vehicle Type ($ million)
- Exhibits44: Analysis of price sensitivity, lifecycle, customer purchase basket, adoption rates, and purchase criteria
- Exhibits45: Chart on Market share By Geographical Landscape 2023-2028 (%)
- Exhibits46: Data Table on Market share By Geographical Landscape 2023-2028 (%)
- Exhibits47: Chart on Geographic comparison
- Exhibits48: Data Table on Geographic comparison
- Exhibits49: Chart on APAC - Market size and forecast 2023-2028 ($ million)
- Exhibits50: Data Table on APAC - Market size and forecast 2023-2028 ($ million)
- Exhibits51: Chart on APAC - Year-over-year growth 2023-2028 (%)
- Exhibits52: Data Table on APAC - Year-over-year growth 2023-2028 (%)
- Exhibits53: Chart on North America - Market size and forecast 2023-2028 ($ million)
- Exhibits54: Data Table on North America - Market size and forecast 2023-2028 ($ million)
- Exhibits55: Chart on North America - Year-over-year growth 2023-2028 (%)
- Exhibits56: Data Table on North America - Year-over-year growth 2023-2028 (%)
- Exhibits57: Chart on Europe - Market size and forecast 2023-2028 ($ million)
- Exhibits58: Data Table on Europe - Market size and forecast 2023-2028 ($ million)
- Exhibits59: Chart on Europe - Year-over-year growth 2023-2028 (%)
- Exhibits60: Data Table on Europe - Year-over-year growth 2023-2028 (%)
- Exhibits61: Chart on Middle East and Africa - Market size and forecast 2023-2028 ($ million)
- Exhibits62: Data Table on Middle East and Africa - Market size and forecast 2023-2028 ($ million)
- Exhibits63: Chart on Middle East and Africa - Year-over-year growth 2023-2028 (%)
- Exhibits64: Data Table on Middle East and Africa - Year-over-year growth 2023-2028 (%)
- Exhibits65: Chart on South America - Market size and forecast 2023-2028 ($ million)
- Exhibits66: Data Table on South America - Market size and forecast 2023-2028 ($ million)
- Exhibits67: Chart on South America - Year-over-year growth 2023-2028 (%)
- Exhibits68: Data Table on South America - Year-over-year growth 2023-2028 (%)
- Exhibits69: Chart on China - Market size and forecast 2023-2028 ($ million)
- Exhibits70: Data Table on China - Market size and forecast 2023-2028 ($ million)
- Exhibits71: Chart on China - Year-over-year growth 2023-2028 (%)
- Exhibits72: Data Table on China - Year-over-year growth 2023-2028 (%)
- Exhibits73: Chart on US - Market size and forecast 2023-2028 ($ million)
- Exhibits74: Data Table on US - Market size and forecast 2023-2028 ($ million)
- Exhibits75: Chart on US - Year-over-year growth 2023-2028 (%)
- Exhibits76: Data Table on US - Year-over-year growth 2023-2028 (%)
- Exhibits77: Chart on Japan - Market size and forecast 2023-2028 ($ million)
- Exhibits78: Data Table on Japan - Market size and forecast 2023-2028 ($ million)
- Exhibits79: Chart on Japan - Year-over-year growth 2023-2028 (%)
- Exhibits80: Data Table on Japan - Year-over-year growth 2023-2028 (%)
- Exhibits81: Chart on India - Market size and forecast 2023-2028 ($ million)
- Exhibits82: Data Table on India - Market size and forecast 2023-2028 ($ million)
- Exhibits83: Chart on India - Year-over-year growth 2023-2028 (%)
- Exhibits84: Data Table on India - Year-over-year growth 2023-2028 (%)
- Exhibits85: Chart on Germany - Market size and forecast 2023-2028 ($ million)
- Exhibits86: Data Table on Germany - Market size and forecast 2023-2028 ($ million)
- Exhibits87: Chart on Germany - Year-over-year growth 2023-2028 (%)
- Exhibits88: Data Table on Germany - Year-over-year growth 2023-2028 (%)
- Exhibits89: Market opportunity By Geographical Landscape ($ million)
- Exhibits90: Data Tables on Market opportunity By Geographical Landscape ($ million)
- Exhibits91: Impact of drivers and challenges in 2023 and 2028
- Exhibits92: Overview on criticality of inputs and factors of differentiation
- Exhibits93: Overview on factors of disruption
- Exhibits94: Impact of key risks on business
- Exhibits95: Companies covered
- Exhibits96: Matrix on companies position and classification
- Exhibits97: AEM Components USA Inc. - Overview
- Exhibits98: AEM Components USA Inc. - Product / Service
- Exhibits99: AEM Components USA Inc. - Key offerings
- Exhibits100: Eaton Corp. Plc - Overview
- Exhibits101: Eaton Corp. Plc - Business segments
- Exhibits102: Eaton Corp. Plc - Key news
- Exhibits103: Eaton Corp. Plc - Key offerings
- Exhibits104: Eaton Corp. Plc - Segment focus
- Exhibits105: ETA Elektrotechnische Apparate GmbH - Overview
- Exhibits106: ETA Elektrotechnische Apparate GmbH - Product / Service
- Exhibits107: ETA Elektrotechnische Apparate GmbH - Key offerings
- Exhibits108: Fuzetec Technology Co. Ltd. - Overview
- Exhibits109: Fuzetec Technology Co. Ltd. - Product / Service
- Exhibits110: Fuzetec Technology Co. Ltd. - Key offerings
- Exhibits111: GLOSO TECH Inc. - Overview
- Exhibits112: GLOSO TECH Inc. - Product / Service
- Exhibits113: GLOSO TECH Inc. - Key offerings
- Exhibits114: Littelfuse Inc. - Overview
- Exhibits115: Littelfuse Inc. - Business segments
- Exhibits116: Littelfuse Inc. - Key news
- Exhibits117: Littelfuse Inc. - Key offerings
- Exhibits118: Littelfuse Inc. - Segment focus
- Exhibits119: Mersen Corporate Services SAS - Overview
- Exhibits120: Mersen Corporate Services SAS - Business segments
- Exhibits121: Mersen Corporate Services SAS - Key news
- Exhibits122: Mersen Corporate Services SAS - Key offerings
- Exhibits123: Mersen Corporate Services SAS - Segment focus
- Exhibits124: OptiFuse - Overview
- Exhibits125: OptiFuse - Product / Service
- Exhibits126: OptiFuse - Key offerings
- Exhibits127: Pacific Engineering Corp. - Overview
- Exhibits128: Pacific Engineering Corp. - Product / Service
- Exhibits129: Pacific Engineering Corp. - Key offerings
- Exhibits130: SCHURTER Holding AG - Overview
- Exhibits131: SCHURTER Holding AG - Product / Service
- Exhibits132: SCHURTER Holding AG - Key news
- Exhibits133: SCHURTER Holding AG - Key offerings
- Exhibits134: Inclusions checklist
- Exhibits135: Exclusions checklist
- Exhibits136: Currency conversion rates for US$
- Exhibits137: Research methodology
- Exhibits138: Information sources
- Exhibits139: Data validation
- Exhibits140: Validation techniques employed for market sizing
- Exhibits141: Data synthesis
- Exhibits142: 360 degree market analysis
- Exhibits143: List of abbreviations
Automotive Fuse Market 2024-2028
The automotive fuse market is forecasted to grow by USD 5205.1 mn during 2023-2028, accelerating at a CAGR of 4.5% during the forecast period. The report on the automotive fuse market provides a holistic analysis, market size and forecast, trends, growth drivers, and challenges, as well as vendor analysis covering around 25 vendors.
The report offers an up-to-date analysis regarding the current market scenario, the latest trends and drivers, and the overall market environment. The market is driven by requirement of fuses to safeguard expensive components of EVs and HEVs, reducing prices of LI-ION batteries, and increasing electronic content in hybrid and electric vehicles.
| Market Scope | |
|---|---|
| Base Year | 2024 |
| End Year | 2028 |
| Series Year | 2024-2028 |
| Growth Momentum | Accelerate |
| YOY 2024 | 4.23% |
| CAGR | 4.5% |
| Incremental Value | $5205.1mn |
Technavio's automotive fuse market is segmented as below:
By Vehicle Type
- Passenger vehicle
- Commercial vehicle
By Geographical Landscape
- APAC
- North America
- Europe
- Middle East and Africa
- South America
This study identifies the development of fuses exclusively for EVs and HEVs as one of the prime reasons driving the automotive fuse market growth during the next few years. Also, rising adoption of advanced electric vehicle charging systems and replacement of fuses with circuit breakers will lead to sizable demand in the market.
The report on the automotive fuse market covers the following areas:
- Automotive fuse market sizing
- Automotive fuse market forecast
- Automotive fuse market industry analysis
The robust vendor analysis is designed to help clients improve their market position, and in line with this, this report provides a detailed analysis of several leading automotive fuse market vendors that include AEM Components USA Inc., Blue Sea Systems, Dongguan Better Electronics Technology Co. Ltd., Eaton Corp. PLC, ETA Elektrotechnische Apparate GmbH, Fuzetec Technology Co. Ltd., GLOSO TECH Inc., Halfords Group PLC, Littelfuse Inc., Mersen Corporate Services SAS, MTA Spa, ON Semiconductor Corp., OptiFuse, Pacific Engineering Corp., Protectron Electromech Pvt. Ltd., Rainbow Power Co. Ltd., SCHURTER Holding AG, Sensata Technologies Inc., SIBA GmbH, and Ultra Wiring Connectivity System Ltd.. Also, the automotive fuse market analysis report includes information on upcoming trends and challenges that will influence market growth. This is to help companies strategize and leverage all forthcoming growth opportunities.
The study was conducted using an objective combination of primary and secondary information including inputs from key participants in the industry. The report contains a comprehensive market and vendor landscape in addition to an analysis of the key vendors.
The publisher presents a detailed picture of the market by the way of study, synthesis, and summation of data from multiple sources by an analysis of key parameters such as profit, pricing, competition, and promotions. IT presents various market facets by identifying the key industry influencers. The data presented is comprehensive, reliable, and a result of extensive research - both primary and secondary. The market research reports provide a complete competitive landscape and an in-depth vendor selection methodology and analysis using qualitative and quantitative research to forecast the accurate market growth.
Table of Contents
1 Executive Summary
- 1.1 Market overview
- Executive Summary - Chart on Market Overview
- Executive Summary - Data Table on Market Overview
- Executive Summary - Chart on Global Market Characteristics
- Executive Summary - Chart on Market By Geographical Landscape
- Executive Summary - Chart on Market Segmentation by Vehicle Type
- Executive Summary - Chart on Incremental Growth
- Executive Summary - Data Table on Incremental Growth
- Executive Summary - Chart on Company Market Positioning
2 Market Landscape
- 2.1 Market ecosystem
- Parent Market
- Data Table on - Parent Market
- 2.2 Market characteristics
- Market characteristics analysis
- 2.3 Value chain analysis
- Value Chain Analysis
3 Market Sizing
- 3.1 Market definition
- Offerings of companies included in the market definition
- 3.2 Market segment analysis
- Market segments
- 3.3 Market size 2023
- 3.4 Market outlook: Forecast for 2023-2028
- Chart on Global - Market size and forecast 2023-2028 ($ million)
- Data Table on Global - Market size and forecast 2023-2028 ($ million)
- Chart on Global Market: Year-over-year growth 2023-2028 (%)
- Data Table on Global Market: Year-over-year growth 2023-2028 (%)
4 Historic Market Size
- 4.1 Global Automotive Fuse Market 2018 - 2022
- Historic Market Size - Data Table on Global Automotive Fuse Market 2018 - 2022 ($ million)
- 4.2 Vehicle Type segment analysis 2018 - 2022
- Historic Market Size - Vehicle Type Segment 2018 - 2022 ($ million)
- 4.3 Geography segment analysis 2018 - 2022
- Historic Market Size - Geography Segment 2018 - 2022 ($ million)
- 4.4 Country segment analysis 2018 - 2022
- Historic Market Size - Country Segment 2018 - 2022 ($ million)
5 Five Forces Analysis
- 5.1 Five forces summary
- Five forces analysis - Comparison between 2023 and 2028
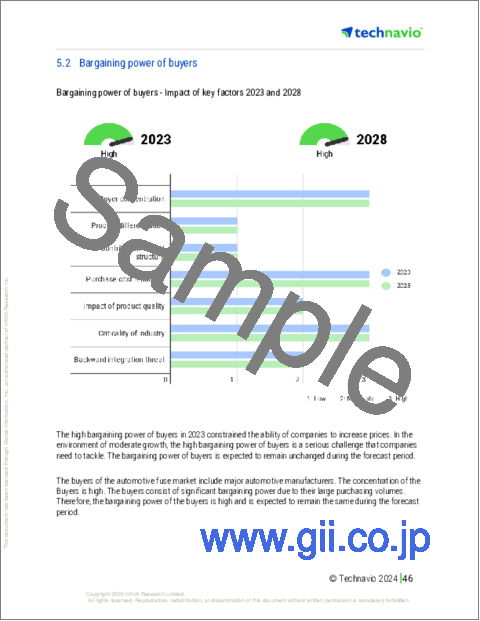
- 5.2 Bargaining power of buyers
- Bargaining power of buyers - Impact of key factors 2023 and 2028
- 5.3 Bargaining power of suppliers
- Bargaining power of suppliers - Impact of key factors in 2023 and 2028
- 5.4 Threat of new entrants
- Threat of new entrants - Impact of key factors in 2023 and 2028
- 5.5 Threat of substitutes
- Threat of substitutes - Impact of key factors in 2023 and 2028
- 5.6 Threat of rivalry
- Threat of rivalry - Impact of key factors in 2023 and 2028
- 5.7 Market condition
- Chart on Market condition - Five forces 2023 and 2028
6 Market Segmentation by Vehicle Type
- 6.1 Market segments
- Chart on Vehicle Type - Market share 2023-2028 (%)
- Data Table on Vehicle Type - Market share 2023-2028 (%)
- 6.2 Comparison by Vehicle Type
- Chart on Comparison by Vehicle Type
- Data Table on Comparison by Vehicle Type
- 6.3 Passenger vehicle - Market size and forecast 2023-2028
- Chart on Passenger vehicle - Market size and forecast 2023-2028 ($ million)
- Data Table on Passenger vehicle - Market size and forecast 2023-2028 ($ million)
- Chart on Passenger vehicle - Year-over-year growth 2023-2028 (%)
- Data Table on Passenger vehicle - Year-over-year growth 2023-2028 (%)
- 6.4 Commercial vehicle - Market size and forecast 2023-2028
- Chart on Commercial vehicle - Market size and forecast 2023-2028 ($ million)
- Data Table on Commercial vehicle - Market size and forecast 2023-2028 ($ million)
- Chart on Commercial vehicle - Year-over-year growth 2023-2028 (%)
- Data Table on Commercial vehicle - Year-over-year growth 2023-2028 (%)
- 6.5 Market opportunity by Vehicle Type
- Market opportunity by Vehicle Type ($ million)
- Data Table on Market opportunity by Vehicle Type ($ million)
7 Customer Landscape
- 7.1 Customer landscape overview
- Analysis of price sensitivity, lifecycle, customer purchase basket, adoption rates, and purchase criteria
8 Geographic Landscape
- 8.1 Geographic segmentation
- Chart on Market share By Geographical Landscape 2023-2028 (%)
- Data Table on Market share By Geographical Landscape 2023-2028 (%)
- 8.2 Geographic comparison
- Chart on Geographic comparison
- Data Table on Geographic comparison
- 8.3 APAC - Market size and forecast 2023-2028
- Chart on APAC - Market size and forecast 2023-2028 ($ million)
- Data Table on APAC - Market size and forecast 2023-2028 ($ million)
- Chart on APAC - Year-over-year growth 2023-2028 (%)
- Data Table on APAC - Year-over-year growth 2023-2028 (%)
- 8.4 North America - Market size and forecast 2023-2028
- Chart on North America - Market size and forecast 2023-2028 ($ million)
- Data Table on North America - Market size and forecast 2023-2028 ($ million)
- Chart on North America - Year-over-year growth 2023-2028 (%)
- Data Table on North America - Year-over-year growth 2023-2028 (%)
- 8.5 Europe - Market size and forecast 2023-2028
- Chart on Europe - Market size and forecast 2023-2028 ($ million)
- Data Table on Europe - Market size and forecast 2023-2028 ($ million)
- Chart on Europe - Year-over-year growth 2023-2028 (%)
- Data Table on Europe - Year-over-year growth 2023-2028 (%)
- 8.6 Middle East and Africa - Market size and forecast 2023-2028
- Chart on Middle East and Africa - Market size and forecast 2023-2028 ($ million)
- Data Table on Middle East and Africa - Market size and forecast 2023-2028 ($ million)
- Chart on Middle East and Africa - Year-over-year growth 2023-2028 (%)
- Data Table on Middle East and Africa - Year-over-year growth 2023-2028 (%)
- 8.7 South America - Market size and forecast 2023-2028
- Chart on South America - Market size and forecast 2023-2028 ($ million)
- Data Table on South America - Market size and forecast 2023-2028 ($ million)
- Chart on South America - Year-over-year growth 2023-2028 (%)
- Data Table on South America - Year-over-year growth 2023-2028 (%)
- 8.8 China - Market size and forecast 2023-2028
- Chart on China - Market size and forecast 2023-2028 ($ million)
- Data Table on China - Market size and forecast 2023-2028 ($ million)
- Chart on China - Year-over-year growth 2023-2028 (%)
- Data Table on China - Year-over-year growth 2023-2028 (%)
- 8.9 US - Market size and forecast 2023-2028
- Chart on US - Market size and forecast 2023-2028 ($ million)
- Data Table on US - Market size and forecast 2023-2028 ($ million)
- Chart on US - Year-over-year growth 2023-2028 (%)
- Data Table on US - Year-over-year growth 2023-2028 (%)
- 8.10 Japan - Market size and forecast 2023-2028
- Chart on Japan - Market size and forecast 2023-2028 ($ million)
- Data Table on Japan - Market size and forecast 2023-2028 ($ million)
- Chart on Japan - Year-over-year growth 2023-2028 (%)
- Data Table on Japan - Year-over-year growth 2023-2028 (%)
- 8.11 India - Market size and forecast 2023-2028
- Chart on India - Market size and forecast 2023-2028 ($ million)
- Data Table on India - Market size and forecast 2023-2028 ($ million)
- Chart on India - Year-over-year growth 2023-2028 (%)
- Data Table on India - Year-over-year growth 2023-2028 (%)
- 8.12 Germany - Market size and forecast 2023-2028
- Chart on Germany - Market size and forecast 2023-2028 ($ million)
- Data Table on Germany - Market size and forecast 2023-2028 ($ million)
- Chart on Germany - Year-over-year growth 2023-2028 (%)
- Data Table on Germany - Year-over-year growth 2023-2028 (%)
- 8.13 Market opportunity By Geographical Landscape
- Market opportunity By Geographical Landscape ($ million)
- Data Tables on Market opportunity By Geographical Landscape ($ million)
9 Drivers, Challenges, and Opportunity/Restraints
- 9.1 Market drivers
- 9.2 Market challenges
- 9.3 Impact of drivers and challenges
- Impact of drivers and challenges in 2023 and 2028
- 9.4 Market opportunities/restraints
10 Competitive Landscape
- 10.1 Overview
- 10.2 Competitive Landscape
- Overview on criticality of inputs and factors of differentiation
- 10.3 Landscape disruption
- Overview on factors of disruption
- 10.4 Industry risks
- Impact of key risks on business
11 Competitive Analysis
- 11.1 Companies profiled
- Companies covered
- 11.2 Market positioning of companies
- Matrix on companies position and classification
- 11.3 AEM Components USA Inc.
- AEM Components USA Inc. - Overview
- AEM Components USA Inc. - Product / Service
- AEM Components USA Inc. - Key offerings
- 11.4 Eaton Corp. Plc
- Eaton Corp. Plc - Overview
- Eaton Corp. Plc - Business segments
- Eaton Corp. Plc - Key news
- Eaton Corp. Plc - Key offerings
- Eaton Corp. Plc - Segment focus
- 11.5 ETA Elektrotechnische Apparate GmbH
- ETA Elektrotechnische Apparate GmbH - Overview
- ETA Elektrotechnische Apparate GmbH - Product / Service
- ETA Elektrotechnische Apparate GmbH - Key offerings
- 11.6 Fuzetec Technology Co. Ltd.
- Fuzetec Technology Co. Ltd. - Overview
- Fuzetec Technology Co. Ltd. - Product / Service
- Fuzetec Technology Co. Ltd. - Key offerings
- 11.7 GLOSO TECH Inc.
- GLOSO TECH Inc. - Overview
- GLOSO TECH Inc. - Product / Service
- GLOSO TECH Inc. - Key offerings
- 11.8 Littelfuse Inc.
- Littelfuse Inc. - Overview
- Littelfuse Inc. - Business segments
- Littelfuse Inc. - Key news
- Littelfuse Inc. - Key offerings
- Littelfuse Inc. - Segment focus
- 11.9 Mersen Corporate Services SAS
- Mersen Corporate Services SAS - Overview
- Mersen Corporate Services SAS - Business segments
- Mersen Corporate Services SAS - Key news
- Mersen Corporate Services SAS - Key offerings
- Mersen Corporate Services SAS - Segment focus
- 11.10 OptiFuse
- OptiFuse - Overview
- OptiFuse - Product / Service
- OptiFuse - Key offerings
- 11.11 Pacific Engineering Corp.
- Pacific Engineering Corp. - Overview
- Pacific Engineering Corp. - Product / Service
- Pacific Engineering Corp. - Key offerings
- 11.12 SCHURTER Holding AG
- SCHURTER Holding AG - Overview
- SCHURTER Holding AG - Product / Service
- SCHURTER Holding AG - Key news
- SCHURTER Holding AG - Key offerings
12 Appendix
- 12.1 Scope of the report
- 12.2 Inclusions and exclusions checklist
- Inclusions checklist
- Exclusions checklist
- 12.3 Currency conversion rates for US$
- Currency conversion rates for US$
- 12.4 Research methodology
- Research methodology
- 12.5 Data procurement
- Information sources
- 12.6 Data validation
- Data validation
- 12.7 Validation techniques employed for market sizing
- Validation techniques employed for market sizing
- 12.8 Data synthesis
- Data synthesis
- 360 degree market analysis
- 360 degree market analysis
- 12.10 List of abbreviations
- List of abbreviations
