|
|
市場調査レポート
商品コード
1502331
医療施設環境モニタリングシステムの世界市場 2024-2028Global medical facility environmental monitoring system market 2024-2028 |
||||||
|
|||||||
カスタマイズ可能
|
|||||||

| 医療施設環境モニタリングシステムの世界市場 2024-2028 |
|
出版日: 2024年05月22日
発行: TechNavio
ページ情報: 英文 164 Pages
納期: 即納可能
|

全表示
- 概要
- 図表
- 目次
Technavio社は医療施設環境モニタリングシステム市場をモニターしており、2023年から2028年にかけて1億1,430万米ドル、予測期間中のCAGRは6.46%で成長すると予測しています。
当レポートでは、医療施設環境モニタリングシステム市場の全体的な分析、市場規模・予測、動向、成長促進要因、課題、約25のベンダーを網羅したベンダー分析などを掲載しています。
現在の市場シナリオ、最新動向と促進要因、市場環境全体に関する最新分析を提供しています。手動のモニタリングよりも高い効率性、医療ロスの低減による収益性の向上、ヘルスケア施設の環境モニタリングに関する厳しい規制などが市場を牽引しています。
| 市場範囲 | |
|---|---|
| 基準年 | 2024 |
| 終了年 | 2028 |
| 予測期間 | 2024-2028 |
| 成長モメンタム | 加速 |
| 前年比2024年 | 5.66% |
| CAGR | 6.46% |
| 増分額 | 1億1,430万米ドル |
本調査では、今後数年間の医療施設環境モニタリングシステム市場成長を牽引する主要因の1つとして、クラウドベースのアナリティクス採用の拡大を挙げています。また、ヘルスケア機器へのBLEの実装や医療分野でのIoT利用の増加が市場の大きな需要につながります。
目次
第1章 エグゼクティブサマリー
- 市場概要
第2章 市場情勢
- 市場エコシステム
- 市場の特徴
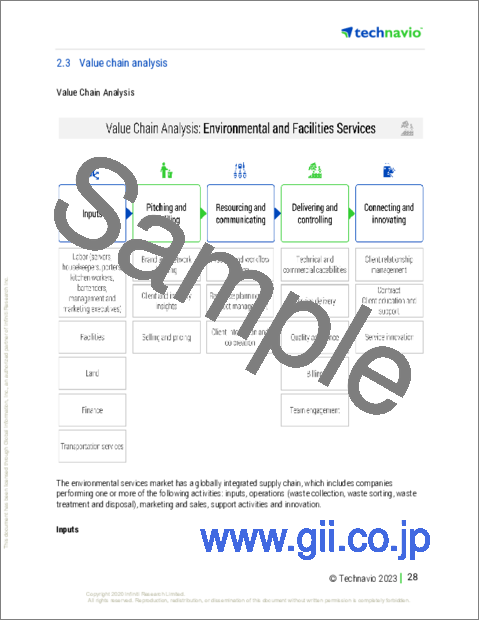
- バリューチェーン分析
第3章 市場規模の評価
- 市場の定義
- 市場セグメント分析
- 市場規模 2023
- 市場の見通し 2023-2028
第4章 市場規模実績
- 世界医療施設環境モニタリングシステム市場 2018-2022
- タイプ別セグメント分析 2018-2022
- エンドユーザー別セグメント分析 2018-2022
- 地域別セグメント分析 2018-2022
- 国別セグメント分析 2018-2022
第5章 ファイブフォース分析
- ファイブフォースの要約
- 買い手の交渉力
- 供給企業の交渉力
- 新規参入業者の脅威
- 代替品の脅威
- 競争の脅威
- 市況
第6章 市場セグメンテーション:タイプ別
- 市場セグメンテーション
- 比較:タイプ別
- 監視機器:市場規模と予測 2023-2028
- ソフトウェア:市場規模と予測 2023-2028
- 微生物学サービス:市場規模と予測 2023-2028
- 市場機会:タイプ別
第7章 市場セグメンテーション:エンドユーザー別
- 市場セグメンテーション
- 比較:エンドユーザー別
- 病院および診断センター:市場規模と予測 2023-2028
- 薬局:市場規模と予測 2023-2028
- 医療用保管センター:市場規模と予測 2023-2028
- 市場機会:エンドユーザー別
第8章 顧客情勢
- 顧客情勢の概要
第9章 地域別情勢
- 地域別セグメンテーション
- 地域別比較
- 北米:市場規模と予測 2023-2028
- 欧州:市場規模と予測 2023-2028
- アジア:市場規模と予測 2023-2028
- 世界のその他の地域:市場規模と予測 2023-2028
- 米国:市場規模と予測 2023-2028
- 英国:市場規模と予測 2023-2028
- ドイツ:市場規模と予測 2023-2028
- 中国:市場規模と予測 2023-2028
- カナダ:市場規模と予測 2023-2028
- 市場機会:地域別
第10章 促進要因・課題・機会・抑制要因
- 市場促進要因
- 市場の課題
- 促進要因と課題の影響
- 市場の機会・抑制要因
第11章 競合情勢
- 概要
- 競合情勢
- 混乱の状況
- 業界のリスク
第12章 競合分析
- 企業プロファイル
- 企業の市場ポジショニング
- Azenta Inc.
- CiK Solutions GmbH
- CirrusCon
- Compliant Healthcare Technologies LLC
- Danaher Corp.
- Dickson Inc.
- Elitech Technology lnc.
- ELPRO BUCHS AG
- Gemini Data Loggers UK Ltd.
- Hanwell Solutions Ltd.
- Tecnosoft Srl
- tempmate GmbH
- TSI Inc.
- Vaisala Oyj
- Vizzia Technologies
第13章 付録
Exhibits:
- Exhibits1: Executive Summary - Chart on Market Overview
- Exhibits2: Executive Summary - Data Table on Market Overview
- Exhibits3: Executive Summary - Chart on Global Market Characteristics
- Exhibits4: Executive Summary - Chart on Market by Geography
- Exhibits5: Executive Summary - Chart on Market Segmentation by Type
- Exhibits6: Executive Summary - Chart on Market Segmentation by End-user
- Exhibits7: Executive Summary - Chart on Incremental Growth
- Exhibits8: Executive Summary - Data Table on Incremental Growth
- Exhibits9: Executive Summary - Chart on Company Market Positioning
- Exhibits10: Parent Market
- Exhibits11: Data Table on - Parent Market
- Exhibits12: Market characteristics analysis
- Exhibits13: Value Chain Analysis
- Exhibits14: Offerings of companies included in the market definition
- Exhibits15: Market segments
- Exhibits16: Chart on Global - Market size and forecast 2023-2028 ($ million)
- Exhibits17: Data Table on Global - Market size and forecast 2023-2028 ($ million)
- Exhibits18: Chart on Global Market: Year-over-year growth 2023-2028 (%)
- Exhibits19: Data Table on Global Market: Year-over-year growth 2023-2028 (%)
- Exhibits20: Historic Market Size - Data Table on Global Medical Facility Environmental Monitoring System Market 2018 - 2022 ($ million)
- Exhibits21: Historic Market Size - Type Segment 2018 - 2022 ($ million)
- Exhibits22: Historic Market Size - End-user Segment 2018 - 2022 ($ million)
- Exhibits23: Historic Market Size - Geography Segment 2018 - 2022 ($ million)
- Exhibits24: Historic Market Size - Country Segment 2018 - 2022 ($ million)
- Exhibits25: Five forces analysis - Comparison between 2023 and 2028
- Exhibits26: Bargaining power of buyers - Impact of key factors 2023 and 2028
- Exhibits27: Bargaining power of suppliers - Impact of key factors in 2023 and 2028
- Exhibits28: Threat of new entrants - Impact of key factors in 2023 and 2028
- Exhibits29: Threat of substitutes - Impact of key factors in 2023 and 2028
- Exhibits30: Threat of rivalry - Impact of key factors in 2023 and 2028
- Exhibits31: Chart on Market condition - Five forces 2023 and 2028
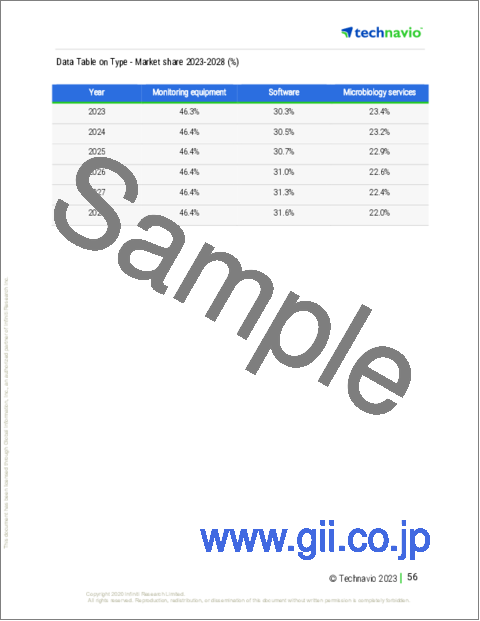
- Exhibits32: Chart on Type - Market share 2023-2028 (%)
- Exhibits33: Data Table on Type - Market share 2023-2028 (%)
- Exhibits34: Chart on Comparison by Type
- Exhibits35: Data Table on Comparison by Type
- Exhibits36: Chart on Monitoring equipment - Market size and forecast 2023-2028 ($ million)
- Exhibits37: Data Table on Monitoring equipment - Market size and forecast 2023-2028 ($ million)
- Exhibits38: Chart on Monitoring equipment - Year-over-year growth 2023-2028 (%)
- Exhibits39: Data Table on Monitoring equipment - Year-over-year growth 2023-2028 (%)
- Exhibits40: Chart on Software - Market size and forecast 2023-2028 ($ million)
- Exhibits41: Data Table on Software - Market size and forecast 2023-2028 ($ million)
- Exhibits42: Chart on Software - Year-over-year growth 2023-2028 (%)
- Exhibits43: Data Table on Software - Year-over-year growth 2023-2028 (%)
- Exhibits44: Chart on Microbiology services - Market size and forecast 2023-2028 ($ million)
- Exhibits45: Data Table on Microbiology services - Market size and forecast 2023-2028 ($ million)
- Exhibits46: Chart on Microbiology services - Year-over-year growth 2023-2028 (%)
- Exhibits47: Data Table on Microbiology services - Year-over-year growth 2023-2028 (%)
- Exhibits48: Market opportunity by Type ($ million)
- Exhibits49: Data Table on Market opportunity by Type ($ million)
- Exhibits50: Chart on End-user - Market share 2023-2028 (%)
- Exhibits51: Data Table on End-user - Market share 2023-2028 (%)
- Exhibits52: Chart on Comparison by End-user
- Exhibits53: Data Table on Comparison by End-user
- Exhibits54: Chart on Hospitals and diagnostic centers - Market size and forecast 2023-2028 ($ million)
- Exhibits55: Data Table on Hospitals and diagnostic centers - Market size and forecast 2023-2028 ($ million)
- Exhibits56: Chart on Hospitals and diagnostic centers - Year-over-year growth 2023-2028 (%)
- Exhibits57: Data Table on Hospitals and diagnostic centers - Year-over-year growth 2023-2028 (%)
- Exhibits58: Chart on Pharmacies - Market size and forecast 2023-2028 ($ million)
- Exhibits59: Data Table on Pharmacies - Market size and forecast 2023-2028 ($ million)
- Exhibits60: Chart on Pharmacies - Year-over-year growth 2023-2028 (%)
- Exhibits61: Data Table on Pharmacies - Year-over-year growth 2023-2028 (%)
- Exhibits62: Chart on Medical storage centers - Market size and forecast 2023-2028 ($ million)
- Exhibits63: Data Table on Medical storage centers - Market size and forecast 2023-2028 ($ million)
- Exhibits64: Chart on Medical storage centers - Year-over-year growth 2023-2028 (%)
- Exhibits65: Data Table on Medical storage centers - Year-over-year growth 2023-2028 (%)
- Exhibits66: Market opportunity by End-user ($ million)
- Exhibits67: Data Table on Market opportunity by End-user ($ million)
- Exhibits68: Analysis of price sensitivity, lifecycle, customer purchase basket, adoption rates, and purchase criteria
- Exhibits69: Chart on Market share By Geographical Landscape2023-2028 (%)
- Exhibits70: Data Table on Market share By Geographical Landscape2023-2028 (%)
- Exhibits71: Chart on Geographic comparison
- Exhibits72: Data Table on Geographic comparison
- Exhibits73: Chart on North America - Market size and forecast 2023-2028 ($ million)
- Exhibits74: Data Table on North America - Market size and forecast 2023-2028 ($ million)
- Exhibits75: Chart on North America - Year-over-year growth 2023-2028 (%)
- Exhibits76: Data Table on North America - Year-over-year growth 2023-2028 (%)
- Exhibits77: Chart on Europe - Market size and forecast 2023-2028 ($ million)
- Exhibits78: Data Table on Europe - Market size and forecast 2023-2028 ($ million)
- Exhibits79: Chart on Europe - Year-over-year growth 2023-2028 (%)
- Exhibits80: Data Table on Europe - Year-over-year growth 2023-2028 (%)
- Exhibits81: Chart on Asia - Market size and forecast 2023-2028 ($ million)
- Exhibits82: Data Table on Asia - Market size and forecast 2023-2028 ($ million)
- Exhibits83: Chart on Asia - Year-over-year growth 2023-2028 (%)
- Exhibits84: Data Table on Asia - Year-over-year growth 2023-2028 (%)
- Exhibits85: Chart on Rest of World (ROW) - Market size and forecast 2023-2028 ($ million)
- Exhibits86: Data Table on Rest of World (ROW) - Market size and forecast 2023-2028 ($ million)
- Exhibits87: Chart on Rest of World (ROW) - Year-over-year growth 2023-2028 (%)
- Exhibits88: Data Table on Rest of World (ROW) - Year-over-year growth 2023-2028 (%)
- Exhibits89: Chart on US - Market size and forecast 2023-2028 ($ million)
- Exhibits90: Data Table on US - Market size and forecast 2023-2028 ($ million)
- Exhibits91: Chart on US - Year-over-year growth 2023-2028 (%)
- Exhibits92: Data Table on US - Year-over-year growth 2023-2028 (%)
- Exhibits93: Chart on UK - Market size and forecast 2023-2028 ($ million)
- Exhibits94: Data Table on UK - Market size and forecast 2023-2028 ($ million)
- Exhibits95: Chart on UK - Year-over-year growth 2023-2028 (%)
- Exhibits96: Data Table on UK - Year-over-year growth 2023-2028 (%)
- Exhibits97: Chart on Germany - Market size and forecast 2023-2028 ($ million)
- Exhibits98: Data Table on Germany - Market size and forecast 2023-2028 ($ million)
- Exhibits99: Chart on Germany - Year-over-year growth 2023-2028 (%)
- Exhibits100: Data Table on Germany - Year-over-year growth 2023-2028 (%)
- Exhibits101: Chart on China - Market size and forecast 2023-2028 ($ million)
- Exhibits102: Data Table on China - Market size and forecast 2023-2028 ($ million)
- Exhibits103: Chart on China - Year-over-year growth 2023-2028 (%)
- Exhibits104: Data Table on China - Year-over-year growth 2023-2028 (%)
- Exhibits105: Chart on Canada - Market size and forecast 2023-2028 ($ million)
- Exhibits106: Data Table on Canada - Market size and forecast 2023-2028 ($ million)
- Exhibits107: Chart on Canada - Year-over-year growth 2023-2028 (%)
- Exhibits108: Data Table on Canada - Year-over-year growth 2023-2028 (%)
- Exhibits109: Market opportunity By Geographical Landscape($ million)
- Exhibits110: Data Tables on Market opportunity By Geographical Landscape($ million)
- Exhibits111: Impact of drivers and challenges in 2023 and 2028
- Exhibits112: Overview on criticality of inputs and factors of differentiation
- Exhibits113: Overview on factors of disruption
- Exhibits114: Impact of key risks on business
- Exhibits115: Companies covered
- Exhibits116: Matrix on companies position and classification
- Exhibits117: Azenta Inc. - Overview
- Exhibits118: Azenta Inc. - Business segments
- Exhibits119: Azenta Inc. - Key news
- Exhibits120: Azenta Inc. - Key offerings
- Exhibits121: Azenta Inc. - Segment focus
- Exhibits122: CiK Solutions GmbH - Overview
- Exhibits123: CiK Solutions GmbH - Product / Service
- Exhibits124: CiK Solutions GmbH - Key offerings
- Exhibits125: CirrusCon - Overview
- Exhibits126: CirrusCon - Product / Service
- Exhibits127: CirrusCon - Key offerings
- Exhibits128: Compliant Healthcare Technologies LLC - Overview
- Exhibits129: Compliant Healthcare Technologies LLC - Product / Service
- Exhibits130: Compliant Healthcare Technologies LLC - Key offerings
- Exhibits131: Danaher Corp. - Overview
- Exhibits132: Danaher Corp. - Business segments
- Exhibits133: Danaher Corp. - Key news
- Exhibits134: Danaher Corp. - Key offerings
- Exhibits135: Danaher Corp. - Segment focus
- Exhibits136: Dickson Inc. - Overview
- Exhibits137: Dickson Inc. - Product / Service
- Exhibits138: Dickson Inc. - Key offerings
- Exhibits139: Elitech Technology lnc. - Overview
- Exhibits140: Elitech Technology lnc. - Product / Service
- Exhibits141: Elitech Technology lnc. - Key offerings
- Exhibits142: ELPRO BUCHS AG - Overview
- Exhibits143: ELPRO BUCHS AG - Product / Service
- Exhibits144: ELPRO BUCHS AG - Key offerings
- Exhibits145: Gemini Data Loggers UK Ltd. - Overview
- Exhibits146: Gemini Data Loggers UK Ltd. - Product / Service
- Exhibits147: Gemini Data Loggers UK Ltd. - Key offerings
- Exhibits148: Hanwell Solutions Ltd. - Overview
- Exhibits149: Hanwell Solutions Ltd. - Product / Service
- Exhibits150: Hanwell Solutions Ltd. - Key offerings
- Exhibits151: Tecnosoft Srl - Overview
- Exhibits152: Tecnosoft Srl - Product / Service
- Exhibits153: Tecnosoft Srl - Key offerings
- Exhibits154: tempmate GmbH - Overview
- Exhibits155: tempmate GmbH - Product / Service
- Exhibits156: tempmate GmbH - Key offerings
- Exhibits157: TSI Inc. - Overview
- Exhibits158: TSI Inc. - Product / Service
- Exhibits159: TSI Inc. - Key offerings
- Exhibits160: Vaisala Oyj - Overview
- Exhibits161: Vaisala Oyj - Business segments
- Exhibits162: Vaisala Oyj - Key news
- Exhibits163: Vaisala Oyj - Key offerings
- Exhibits164: Vaisala Oyj - Segment focus
- Exhibits165: Vizzia Technologies - Overview
- Exhibits166: Vizzia Technologies - Product / Service
- Exhibits167: Vizzia Technologies - Key offerings
- Exhibits168: Inclusions checklist
- Exhibits169: Exclusions checklist
- Exhibits170: Currency conversion rates for US$
- Exhibits171: Research methodology
- Exhibits172: Information sources
- Exhibits173: Data validation
- Exhibits174: Validation techniques employed for market sizing
- Exhibits175: Data synthesis
- Exhibits176: 360 degree market analysis
- Exhibits177: List of abbreviations
Technavio has been monitoring the medical facility environmental monitoring system market and is forecast to grow by USD 114.3 mn during 2023-2028, accelerating at a CAGR of 6.46% during the forecast period. Our report on the medical facility environmental monitoring system market provides a holistic analysis, market size and forecast, trends, growth drivers, and challenges, as well as vendor analysis covering around 25 vendors.
The report offers an up-to-date analysis regarding the current market scenario, the latest trends and drivers, and the overall market environment. The market is driven by higher efficiency than manual monitoring, enhanced profitability by lowering medical losses, and stringent regulations on environmental monitoring in healthcare facilities.
Technavio's medical facility environmental monitoring system market is segmented as below:
| Market Scope | |
|---|---|
| Base Year | 2024 |
| End Year | 2028 |
| Series Year | 2024-2028 |
| Growth Momentum | Accelerate |
| YOY 2024 | 5.66% |
| CAGR | 6.46% |
| Incremental Value | $114.3mn |
By Type
- Monitoring equipment
- Software
- Microbiology services
By End-user
- Hospitals and diagnostic centers
- Pharmacies
- Medical storage centers
By Geography
- North America
- Europe
- Asia
- Rest of World (ROW)
This study identifies the growing adoption of cloud-based analytics as one of the prime reasons driving the medical facility environmental monitoring system market growth during the next few years. Also, implementation of ble in healthcare devices and increasing use of iot in medical sector will lead to sizable demand in the market.
Technavio presents a detailed picture of the market by the way of study, synthesis, and summation of data from multiple sources by an analysis of key parameters. Our report on the medical facility environmental monitoring system market covers the following areas:
- Medical facility environmental monitoring system market sizing
- Medical facility environmental monitoring system market forecast
- Medical facility environmental monitoring system market industry analysis
Technavio's robust vendor analysis is designed to help clients improve their market position, and in line with this, this report provides a detailed analysis of several leading medical facility environmental monitoring system market vendors that include Azenta Inc., CiK Solutions GmbH, CirrusCon, Compliant Healthcare Technologies LLC, Danaher Corp., Dickson Inc., Elitech Technology lnc., ELPRO BUCHS AG, Gemini Data Loggers UK Ltd., Halma Plc, Hanwell Solutions Ltd., Mesa Laboratories Inc., Tecnosoft Srl, tempmate GmbH, Testo SE and Co. KGaA, TSI Inc., Vaisala Oyj, Vizzia Technologies, and Xylem Inc.. Also, the medical facility environmental monitoring system market analysis report includes information on upcoming trends and challenges that will influence market growth. This is to help companies strategize and leverage all forthcoming growth opportunities.
The study was conducted using an objective combination of primary and secondary information including inputs from key participants in the industry. The report contains a comprehensive market and vendor landscape in addition to an analysis of the key vendors.
Technavio presents a detailed picture of the market by the way of study, synthesis, and summation of data from multiple sources by an analysis of key parameters such as profit, pricing, competition, and promotions. It presents various market facets by identifying the key industry influencers. The data presented is comprehensive, reliable, and a result of extensive research - both primary and secondary. Technavio's market research reports provide a complete competitive landscape and an in-depth vendor selection methodology and analysis using qualitative and quantitative research to forecast accurate market growth.
Table of Contents
1 Executive Summary
- 1.1 Market overview
- Executive Summary - Chart on Market Overview
- Executive Summary - Data Table on Market Overview
- Executive Summary - Chart on Global Market Characteristics
- Executive Summary - Chart on Market by Geography
- Executive Summary - Chart on Market Segmentation by Type
- Executive Summary - Chart on Market Segmentation by End-user
- Executive Summary - Chart on Incremental Growth
- Executive Summary - Data Table on Incremental Growth
- Executive Summary - Chart on Company Market Positioning
2 Market Landscape
- 2.1 Market ecosystem
- Parent Market
- Data Table on - Parent Market
- 2.2 Market characteristics
- Market characteristics analysis
- 2.3 Value chain analysis
- Value Chain Analysis
3 Market Sizing
- 3.1 Market definition
- Offerings of companies included in the market definition
- 3.2 Market segment analysis
- Market segments
- 3.3 Market size 2023
- 3.4 Market outlook: Forecast for 2023-2028
- Chart on Global - Market size and forecast 2023-2028 ($ million)
- Data Table on Global - Market size and forecast 2023-2028 ($ million)
- Chart on Global Market: Year-over-year growth 2023-2028 (%)
- Data Table on Global Market: Year-over-year growth 2023-2028 (%)
4 Historic Market Size
- 4.1 Global Medical Facility Environmental Monitoring System Market 2018 - 2022
- Historic Market Size - Data Table on Global Medical Facility Environmental Monitoring System Market 2018 - 2022 ($ million)
- 4.2 Type segment analysis 2018 - 2022
- Historic Market Size - Type Segment 2018 - 2022 ($ million)
- 4.3 End-user segment analysis 2018 - 2022
- Historic Market Size - End-user Segment 2018 - 2022 ($ million)
- 4.4 Geography segment analysis 2018 - 2022
- Historic Market Size - Geography Segment 2018 - 2022 ($ million)
- 4.5 Country segment analysis 2018 - 2022
- Historic Market Size - Country Segment 2018 - 2022 ($ million)
5 Five Forces Analysis
- 5.1 Five forces summary
- Five forces analysis - Comparison between 2023 and 2028
- 5.2 Bargaining power of buyers
- Bargaining power of buyers - Impact of key factors 2023 and 2028
- 5.3 Bargaining power of suppliers
- Bargaining power of suppliers - Impact of key factors in 2023 and 2028
- 5.4 Threat of new entrants
- Threat of new entrants - Impact of key factors in 2023 and 2028
- 5.5 Threat of substitutes
- Threat of substitutes - Impact of key factors in 2023 and 2028
- 5.6 Threat of rivalry
- Threat of rivalry - Impact of key factors in 2023 and 2028
- 5.7 Market condition
- Chart on Market condition - Five forces 2023 and 2028
6 Market Segmentation by Type
- 6.1 Market segments
- Chart on Type - Market share 2023-2028 (%)
- Data Table on Type - Market share 2023-2028 (%)
- 6.2 Comparison by Type
- Chart on Comparison by Type
- Data Table on Comparison by Type
- 6.3 Monitoring equipment - Market size and forecast 2023-2028
- Chart on Monitoring equipment - Market size and forecast 2023-2028 ($ million)
- Data Table on Monitoring equipment - Market size and forecast 2023-2028 ($ million)
- Chart on Monitoring equipment - Year-over-year growth 2023-2028 (%)
- Data Table on Monitoring equipment - Year-over-year growth 2023-2028 (%)
- 6.4 Software - Market size and forecast 2023-2028
- Chart on Software - Market size and forecast 2023-2028 ($ million)
- Data Table on Software - Market size and forecast 2023-2028 ($ million)
- Chart on Software - Year-over-year growth 2023-2028 (%)
- Data Table on Software - Year-over-year growth 2023-2028 (%)
- 6.5 Microbiology services - Market size and forecast 2023-2028
- Chart on Microbiology services - Market size and forecast 2023-2028 ($ million)
- Data Table on Microbiology services - Market size and forecast 2023-2028 ($ million)
- Chart on Microbiology services - Year-over-year growth 2023-2028 (%)
- Data Table on Microbiology services - Year-over-year growth 2023-2028 (%)
- 6.6 Market opportunity by Type
- Market opportunity by Type ($ million)
- Data Table on Market opportunity by Type ($ million)
7 Market Segmentation by End-user
- 7.1 Market segments
- Chart on End-user - Market share 2023-2028 (%)
- Data Table on End-user - Market share 2023-2028 (%)
- 7.2 Comparison by End-user
- Chart on Comparison by End-user
- Data Table on Comparison by End-user
- 7.3 Hospitals and diagnostic centers - Market size and forecast 2023-2028
- Chart on Hospitals and diagnostic centers - Market size and forecast 2023-2028 ($ million)
- Data Table on Hospitals and diagnostic centers - Market size and forecast 2023-2028 ($ million)
- Chart on Hospitals and diagnostic centers - Year-over-year growth 2023-2028 (%)
- Data Table on Hospitals and diagnostic centers - Year-over-year growth 2023-2028 (%)
- 7.4 Pharmacies - Market size and forecast 2023-2028
- Chart on Pharmacies - Market size and forecast 2023-2028 ($ million)
- Data Table on Pharmacies - Market size and forecast 2023-2028 ($ million)
- Chart on Pharmacies - Year-over-year growth 2023-2028 (%)
- Data Table on Pharmacies - Year-over-year growth 2023-2028 (%)
- 7.5 Medical storage centers - Market size and forecast 2023-2028
- Chart on Medical storage centers - Market size and forecast 2023-2028 ($ million)
- Data Table on Medical storage centers - Market size and forecast 2023-2028 ($ million)
- Chart on Medical storage centers - Year-over-year growth 2023-2028 (%)
- Data Table on Medical storage centers - Year-over-year growth 2023-2028 (%)
- 7.6 Market opportunity by End-user
- Market opportunity by End-user ($ million)
- Data Table on Market opportunity by End-user ($ million)
8 Customer Landscape
- 8.1 Customer landscape overview
- Analysis of price sensitivity, lifecycle, customer purchase basket, adoption rates, and purchase criteria
9 Geographic Landscape
- 9.1 Geographic segmentation
- Chart on Market share By Geographical Landscape2023-2028 (%)
- Data Table on Market share By Geographical Landscape2023-2028 (%)
- 9.2 Geographic comparison
- Chart on Geographic comparison
- Data Table on Geographic comparison
- 9.3 North America - Market size and forecast 2023-2028
- Chart on North America - Market size and forecast 2023-2028 ($ million)
- Data Table on North America - Market size and forecast 2023-2028 ($ million)
- Chart on North America - Year-over-year growth 2023-2028 (%)
- Data Table on North America - Year-over-year growth 2023-2028 (%)
- 9.4 Europe - Market size and forecast 2023-2028
- Chart on Europe - Market size and forecast 2023-2028 ($ million)
- Data Table on Europe - Market size and forecast 2023-2028 ($ million)
- Chart on Europe - Year-over-year growth 2023-2028 (%)
- Data Table on Europe - Year-over-year growth 2023-2028 (%)
- 9.5 Asia - Market size and forecast 2023-2028
- Chart on Asia - Market size and forecast 2023-2028 ($ million)
- Data Table on Asia - Market size and forecast 2023-2028 ($ million)
- Chart on Asia - Year-over-year growth 2023-2028 (%)
- Data Table on Asia - Year-over-year growth 2023-2028 (%)
- 9.6 Rest of World (ROW) - Market size and forecast 2023-2028
- Chart on Rest of World (ROW) - Market size and forecast 2023-2028 ($ million)
- Data Table on Rest of World (ROW) - Market size and forecast 2023-2028 ($ million)
- Chart on Rest of World (ROW) - Year-over-year growth 2023-2028 (%)
- Data Table on Rest of World (ROW) - Year-over-year growth 2023-2028 (%)
- 9.7 US - Market size and forecast 2023-2028
- Chart on US - Market size and forecast 2023-2028 ($ million)
- Data Table on US - Market size and forecast 2023-2028 ($ million)
- Chart on US - Year-over-year growth 2023-2028 (%)
- Data Table on US - Year-over-year growth 2023-2028 (%)
- 9.8 UK - Market size and forecast 2023-2028
- Chart on UK - Market size and forecast 2023-2028 ($ million)
- Data Table on UK - Market size and forecast 2023-2028 ($ million)
- Chart on UK - Year-over-year growth 2023-2028 (%)
- Data Table on UK - Year-over-year growth 2023-2028 (%)
- 9.9 Germany - Market size and forecast 2023-2028
- Chart on Germany - Market size and forecast 2023-2028 ($ million)
- Data Table on Germany - Market size and forecast 2023-2028 ($ million)
- Chart on Germany - Year-over-year growth 2023-2028 (%)
- Data Table on Germany - Year-over-year growth 2023-2028 (%)
- 9.10 China - Market size and forecast 2023-2028
- Chart on China - Market size and forecast 2023-2028 ($ million)
- Data Table on China - Market size and forecast 2023-2028 ($ million)
- Chart on China - Year-over-year growth 2023-2028 (%)
- Data Table on China - Year-over-year growth 2023-2028 (%)
- 9.11 Canada - Market size and forecast 2023-2028
- Chart on Canada - Market size and forecast 2023-2028 ($ million)
- Data Table on Canada - Market size and forecast 2023-2028 ($ million)
- Chart on Canada - Year-over-year growth 2023-2028 (%)
- Data Table on Canada - Year-over-year growth 2023-2028 (%)
- 9.12 Market opportunity by geography
- Market opportunity By Geographical Landscape($ million)
- Data Tables on Market opportunity By Geographical Landscape($ million)
10 Drivers, Challenges, and Opportunity/Restraints
- 10.1 Market drivers
- 10.2 Market challenges
- 10.3 Impact of drivers and challenges
- Impact of drivers and challenges in 2023 and 2028
- 10.4 Market opportunities/restraints
11 Competitive Landscape
- 11.1 Overview
- 11.2 Competitive Landscape
- Overview on criticality of inputs and factors of differentiation
- 11.3 Landscape disruption
- Overview on factors of disruption
- 11.4 Industry risks
- Impact of key risks on business
12 Competitive Analysis
- 12.1 Companies profiled
- Companies covered
- 12.2 Market positioning of companies
- Matrix on companies position and classification
- 12.3 Azenta Inc.
- Azenta Inc. - Overview
- Azenta Inc. - Business segments
- Azenta Inc. - Key news
- Azenta Inc. - Key offerings
- Azenta Inc. - Segment focus
- 12.4 CiK Solutions GmbH
- CiK Solutions GmbH - Overview
- CiK Solutions GmbH - Product / Service
- CiK Solutions GmbH - Key offerings
- 12.5 CirrusCon
- CirrusCon - Overview
- CirrusCon - Product / Service
- CirrusCon - Key offerings
- 12.6 Compliant Healthcare Technologies LLC
- Compliant Healthcare Technologies LLC - Overview
- Compliant Healthcare Technologies LLC - Product / Service
- Compliant Healthcare Technologies LLC - Key offerings
- 12.7 Danaher Corp.
- Danaher Corp. - Overview
- Danaher Corp. - Business segments
- Danaher Corp. - Key news
- Danaher Corp. - Key offerings
- Danaher Corp. - Segment focus
- 12.8 Dickson Inc.
- Dickson Inc. - Overview
- Dickson Inc. - Product / Service
- Dickson Inc. - Key offerings
- 12.9 Elitech Technology lnc.
- Elitech Technology lnc. - Overview
- Elitech Technology lnc. - Product / Service
- Elitech Technology lnc. - Key offerings
- 12.10 ELPRO BUCHS AG
- ELPRO BUCHS AG - Overview
- ELPRO BUCHS AG - Product / Service
- ELPRO BUCHS AG - Key offerings
- 12.11 Gemini Data Loggers UK Ltd.
- Gemini Data Loggers UK Ltd. - Overview
- Gemini Data Loggers UK Ltd. - Product / Service
- Gemini Data Loggers UK Ltd. - Key offerings
- 12.12 Hanwell Solutions Ltd.
- Hanwell Solutions Ltd. - Overview
- Hanwell Solutions Ltd. - Product / Service
- Hanwell Solutions Ltd. - Key offerings
- 12.13 Tecnosoft Srl
- Tecnosoft Srl - Overview
- Tecnosoft Srl - Product / Service
- Tecnosoft Srl - Key offerings
- 12.14 tempmate GmbH
- tempmate GmbH - Overview
- tempmate GmbH - Product / Service
- tempmate GmbH - Key offerings
- 12.15 TSI Inc.
- TSI Inc. - Overview
- TSI Inc. - Product / Service
- TSI Inc. - Key offerings
- 12.16 Vaisala Oyj
- Vaisala Oyj - Overview
- Vaisala Oyj - Business segments
- Vaisala Oyj - Key news
- Vaisala Oyj - Key offerings
- Vaisala Oyj - Segment focus
- 12.17 Vizzia Technologies
- Vizzia Technologies - Overview
- Vizzia Technologies - Product / Service
- Vizzia Technologies - Key offerings
13 Appendix
- 13.1 Scope of the report
- 13.2 Inclusions and exclusions checklist
- Inclusions checklist
- Exclusions checklist
- 13.3 Currency conversion rates for US$
- Currency conversion rates for US$
- 13.4 Research methodology
- Research methodology
- 13.5 Data procurement
- Information sources
- 13.6 Data validation
- Data validation
- 13.7 Validation techniques employed for market sizing
- Validation techniques employed for market sizing
- 13.8 Data synthesis
- Data synthesis
- 13.9 360 degree market analysis
- 360 degree market analysis
- 13.10 List of abbreviations
- List of abbreviations
