|
|
市場調査レポート
商品コード
1502322
アロマセラピーの世界市場 2024-2028Global aromatherapy market 2024-2028 |
||||||

|
|||||||
カスタマイズ可能
|
|||||||


| アロマセラピーの世界市場 2024-2028 |
|
出版日: 2024年05月20日
発行: TechNavio
ページ情報: 英文 163 Pages
納期: 即納可能
|

全表示
- 概要
- 図表
- 目次
Technavio社は、アロマセラピー市場を調査し、2023年から2028年にかけて27億3,090万米ドル、予測期間中のCAGRは10.87%で成長すると予測しています。
当レポートでは、アロマセラピー市場の全体的な分析、市場規模・予測、動向、成長促進要因、課題、約25のベンダーを網羅したベンダー分析などを掲載しています。
現在の市場シナリオ、最新動向と促進要因、市場環境全体に関する最新分析を提供しています。市場は、家庭でのアロマセラピー使用の増加、アロマセラピーの健康効果に関する意識の高まり、ライフスタイルの変化などが牽引しています。
| 市場範囲 | |
|---|---|
| 基準年 | 2024 |
| 終了年 | 2028 |
| 予測期間 | 2024-2028 |
| 成長モメンタム | 加速 |
| 前年比2024年 | 9.53% |
| CAGR | 10.87% |
| 増分額 | 27億3,090万米ドル |
本調査では、今後数年間のアロマセラピー市場成長を牽引する主な要因の1つとして、アロマセラピー製品に対する需要の増加を挙げています。また、継続的な製品の革新と改善、企業のウェルネスイニシアチブの増加が、市場の大きな需要につながります。
目次
第1章 エグゼクティブサマリー
- 市場概要
第2章 市場情勢
- 市場エコシステム
- 市場の特徴
- バリューチェーン分析
第3章 市場規模の評価
- 市場の定義
- 市場セグメント分析
- 市場規模 2023
- 市場の見通し 2023-2028
第4章 市場規模実績
- 世界アロマセラピー市場 2018-2022
- 製品別セグメント分析 2018-2022
- 使用別セグメント分析 2018-2022
- 地域別セグメント分析 2018-2022
- 国別セグメント分析 2018-2022
第5章 ファイブフォース分析
- ファイブフォースの要約
- 買い手の交渉力
- 供給企業の交渉力
- 新規参入業者の脅威
- 代替品の脅威
- 競争の脅威
- 市況
第6章 市場セグメンテーション:製品別
- 市場セグメンテーション
- 比較:製品別
- 消耗品:市場規模と予測 2023-2028
- 装置:市場規模と予測 2023-2028
- 市場機会:製品別
第7章 市場セグメンテーション用途別
- 市場セグメンテーション
- 比較用途別
- 局所塗布:市場規模と予測 2023-2028
- 空中拡散:市場規模と予測 2023-2028
- 直接吸入:市場規模と予測 2023-2028
- 市場機会用途別
第8章 顧客情勢
- 顧客情勢の概要
第9章 地域別情勢
- 地域別セグメンテーション
- 地域別比較
- 北米:市場規模と予測 2023-2028
- 欧州:市場規模と予測 2023-2028
- アジア太平洋:市場規模と予測 2023-2028
- 南米:市場規模と予測 2023-2028
- 中東・アフリカ:市場規模と予測 2023-2028
- 米国:市場規模と予測 2023-2028
- 英国:市場規模と予測 2023-2028
- 中国:市場規模と予測 2023-2028
- 日本:市場規模と予測 2023-2028
- ドイツ:市場規模と予測 2023-2028
- 市場機会:地域別
第10章 促進要因・課題・機会・抑制要因
- 市場促進要因
- 市場の課題
- 促進要因と課題の影響
- 市場の機会・抑制要因
第11章 競合情勢
- 概要
- 競合情勢
- 混乱の状況
- 業界のリスク
第12章 競合分析
- 企業プロファイル
- 企業の市場ポジショニング
- Air Aroma Internatinal
- Biolandes SAS
- doTERRA International LLC
- Edens Garden
- Falcon
- Hubmar International
- Isagenix Worldwide Inc.
- JE INTERNATIONAL SARL
- Mountain Rose Herbs
- North American Herb and Spice
- NOW Health Group Inc.
- Plant Therapy
- Rocky Mountain Oils LLC
- Starwest Botanicals.com Inc.
- Young Living Essential Oils LC
第13章 付録
Exhibits:
- Exhibits1: Executive Summary - Chart on Market Overview
- Exhibits2: Executive Summary - Data Table on Market Overview
- Exhibits3: Executive Summary - Chart on Global Market Characteristics
- Exhibits4: Executive Summary - Chart on Market by Geography
- Exhibits5: Executive Summary - Chart on Market Segmentation by Product
- Exhibits6: Executive Summary - Chart on Market Segmentation by Usage
- Exhibits7: Executive Summary - Chart on Incremental Growth
- Exhibits8: Executive Summary - Data Table on Incremental Growth
- Exhibits9: Executive Summary - Chart on Company Market Positioning
- Exhibits10: Parent Market
- Exhibits11: Data Table on - Parent Market
- Exhibits12: Market characteristics analysis
- Exhibits13: Value Chain Analysis
- Exhibits14: Offerings of companies included in the market definition
- Exhibits15: Market segments
- Exhibits16: Chart on Global - Market size and forecast 2023-2028 ($ million)
- Exhibits17: Data Table on Global - Market size and forecast 2023-2028 ($ million)
- Exhibits18: Chart on Global Market: Year-over-year growth 2023-2028 (%)
- Exhibits19: Data Table on Global Market: Year-over-year growth 2023-2028 (%)
- Exhibits20: Historic Market Size - Data Table on Global Aromatherapy Market 2018 - 2022 ($ million)
- Exhibits21: Historic Market Size - Product Segment 2018 - 2022 ($ million)
- Exhibits22: Historic Market Size - Usage Segment 2018 - 2022 ($ million)
- Exhibits23: Historic Market Size - Geography Segment 2018 - 2022 ($ million)
- Exhibits24: Historic Market Size - Country Segment 2018 - 2022 ($ million)
- Exhibits25: Five forces analysis - Comparison between 2023 and 2028
- Exhibits26: Bargaining power of buyers - Impact of key factors 2023 and 2028
- Exhibits27: Bargaining power of suppliers - Impact of key factors in 2023 and 2028
- Exhibits28: Threat of new entrants - Impact of key factors in 2023 and 2028
- Exhibits29: Threat of substitutes - Impact of key factors in 2023 and 2028
- Exhibits30: Threat of rivalry - Impact of key factors in 2023 and 2028
- Exhibits31: Chart on Market condition - Five forces 2023 and 2028
- Exhibits32: Chart on Product - Market share 2023-2028 (%)
- Exhibits33: Data Table on Product - Market share 2023-2028 (%)
- Exhibits34: Chart on Comparison by Product
- Exhibits35: Data Table on Comparison by Product
- Exhibits36: Chart on Consumables - Market size and forecast 2023-2028 ($ million)
- Exhibits37: Data Table on Consumables - Market size and forecast 2023-2028 ($ million)
- Exhibits38: Chart on Consumables - Year-over-year growth 2023-2028 (%)
- Exhibits39: Data Table on Consumables - Year-over-year growth 2023-2028 (%)
- Exhibits40: Chart on Equipment - Market size and forecast 2023-2028 ($ million)
- Exhibits41: Data Table on Equipment - Market size and forecast 2023-2028 ($ million)
- Exhibits42: Chart on Equipment - Year-over-year growth 2023-2028 (%)
- Exhibits43: Data Table on Equipment - Year-over-year growth 2023-2028 (%)
- Exhibits44: Market opportunity by Product ($ million)
- Exhibits45: Data Table on Market opportunity by Product ($ million)
- Exhibits46: Chart on Usage - Market share 2023-2028 (%)
- Exhibits47: Data Table on Usage - Market share 2023-2028 (%)
- Exhibits48: Chart on Comparison by Usage
- Exhibits49: Data Table on Comparison by Usage
- Exhibits50: Chart on Topical application - Market size and forecast 2023-2028 ($ million)
- Exhibits51: Data Table on Topical application - Market size and forecast 2023-2028 ($ million)
- Exhibits52: Chart on Topical application - Year-over-year growth 2023-2028 (%)
- Exhibits53: Data Table on Topical application - Year-over-year growth 2023-2028 (%)
- Exhibits54: Chart on Aerial diffusion - Market size and forecast 2023-2028 ($ million)
- Exhibits55: Data Table on Aerial diffusion - Market size and forecast 2023-2028 ($ million)
- Exhibits56: Chart on Aerial diffusion - Year-over-year growth 2023-2028 (%)
- Exhibits57: Data Table on Aerial diffusion - Year-over-year growth 2023-2028 (%)
- Exhibits58: Chart on Direct inhalation - Market size and forecast 2023-2028 ($ million)
- Exhibits59: Data Table on Direct inhalation - Market size and forecast 2023-2028 ($ million)
- Exhibits60: Chart on Direct inhalation - Year-over-year growth 2023-2028 (%)
- Exhibits61: Data Table on Direct inhalation - Year-over-year growth 2023-2028 (%)
- Exhibits62: Market opportunity by Usage ($ million)
- Exhibits63: Data Table on Market opportunity by Usage ($ million)
- Exhibits64: Analysis of price sensitivity, lifecycle, customer purchase basket, adoption rates, and purchase criteria
- Exhibits65: Chart on Market share By Geographical Landscape2023-2028 (%)
- Exhibits66: Data Table on Market share By Geographical Landscape2023-2028 (%)
- Exhibits67: Chart on Geographic comparison
- Exhibits68: Data Table on Geographic comparison
- Exhibits69: Chart on North America - Market size and forecast 2023-2028 ($ million)
- Exhibits70: Data Table on North America - Market size and forecast 2023-2028 ($ million)
- Exhibits71: Chart on North America - Year-over-year growth 2023-2028 (%)
- Exhibits72: Data Table on North America - Year-over-year growth 2023-2028 (%)
- Exhibits73: Chart on Europe - Market size and forecast 2023-2028 ($ million)
- Exhibits74: Data Table on Europe - Market size and forecast 2023-2028 ($ million)
- Exhibits75: Chart on Europe - Year-over-year growth 2023-2028 (%)
- Exhibits76: Data Table on Europe - Year-over-year growth 2023-2028 (%)
- Exhibits77: Chart on APAC - Market size and forecast 2023-2028 ($ million)
- Exhibits78: Data Table on APAC - Market size and forecast 2023-2028 ($ million)
- Exhibits79: Chart on APAC - Year-over-year growth 2023-2028 (%)
- Exhibits80: Data Table on APAC - Year-over-year growth 2023-2028 (%)
- Exhibits81: Chart on South America - Market size and forecast 2023-2028 ($ million)
- Exhibits82: Data Table on South America - Market size and forecast 2023-2028 ($ million)
- Exhibits83: Chart on South America - Year-over-year growth 2023-2028 (%)
- Exhibits84: Data Table on South America - Year-over-year growth 2023-2028 (%)
- Exhibits85: Chart on Middle East and Africa - Market size and forecast 2023-2028 ($ million)
- Exhibits86: Data Table on Middle East and Africa - Market size and forecast 2023-2028 ($ million)
- Exhibits87: Chart on Middle East and Africa - Year-over-year growth 2023-2028 (%)
- Exhibits88: Data Table on Middle East and Africa - Year-over-year growth 2023-2028 (%)
- Exhibits89: Chart on US - Market size and forecast 2023-2028 ($ million)
- Exhibits90: Data Table on US - Market size and forecast 2023-2028 ($ million)
- Exhibits91: Chart on US - Year-over-year growth 2023-2028 (%)
- Exhibits92: Data Table on US - Year-over-year growth 2023-2028 (%)
- Exhibits93: Chart on UK - Market size and forecast 2023-2028 ($ million)
- Exhibits94: Data Table on UK - Market size and forecast 2023-2028 ($ million)
- Exhibits95: Chart on UK - Year-over-year growth 2023-2028 (%)
- Exhibits96: Data Table on UK - Year-over-year growth 2023-2028 (%)
- Exhibits97: Chart on China - Market size and forecast 2023-2028 ($ million)
- Exhibits98: Data Table on China - Market size and forecast 2023-2028 ($ million)
- Exhibits99: Chart on China - Year-over-year growth 2023-2028 (%)
- Exhibits100: Data Table on China - Year-over-year growth 2023-2028 (%)
- Exhibits101: Chart on Japan - Market size and forecast 2023-2028 ($ million)
- Exhibits102: Data Table on Japan - Market size and forecast 2023-2028 ($ million)
- Exhibits103: Chart on Japan - Year-over-year growth 2023-2028 (%)
- Exhibits104: Data Table on Japan - Year-over-year growth 2023-2028 (%)
- Exhibits105: Chart on Germany - Market size and forecast 2023-2028 ($ million)
- Exhibits106: Data Table on Germany - Market size and forecast 2023-2028 ($ million)
- Exhibits107: Chart on Germany - Year-over-year growth 2023-2028 (%)
- Exhibits108: Data Table on Germany - Year-over-year growth 2023-2028 (%)
- Exhibits109: Market opportunity By Geographical Landscape($ million)
- Exhibits110: Data Tables on Market opportunity By Geographical Landscape($ million)
- Exhibits111: Impact of drivers and challenges in 2023 and 2028
- Exhibits112: Overview on criticality of inputs and factors of differentiation
- Exhibits113: Overview on factors of disruption
- Exhibits114: Impact of key risks on business
- Exhibits115: Companies covered
- Exhibits116: Matrix on companies position and classification
- Exhibits117: Air Aroma Internatinal - Overview
- Exhibits118: Air Aroma Internatinal - Product / Service
- Exhibits119: Air Aroma Internatinal - Key offerings
- Exhibits120: Biolandes SAS - Overview
- Exhibits121: Biolandes SAS - Product / Service
- Exhibits122: Biolandes SAS - Key offerings
- Exhibits123: doTERRA International LLC - Overview
- Exhibits124: doTERRA International LLC - Product / Service
- Exhibits125: doTERRA International LLC - Key news
- Exhibits126: doTERRA International LLC - Key offerings
- Exhibits127: Edens Garden - Overview
- Exhibits128: Edens Garden - Product / Service
- Exhibits129: Edens Garden - Key offerings
- Exhibits130: Falcon - Overview
- Exhibits131: Falcon - Product / Service
- Exhibits132: Falcon - Key offerings
- Exhibits133: Hubmar International - Overview
- Exhibits134: Hubmar International - Product / Service
- Exhibits135: Hubmar International - Key offerings
- Exhibits136: Isagenix Worldwide Inc. - Overview
- Exhibits137: Isagenix Worldwide Inc. - Product / Service
- Exhibits138: Isagenix Worldwide Inc. - Key offerings
- Exhibits139: JE INTERNATIONAL SARL - Overview
- Exhibits140: JE INTERNATIONAL SARL - Product / Service
- Exhibits141: JE INTERNATIONAL SARL - Key offerings
- Exhibits142: Mountain Rose Herbs - Overview
- Exhibits143: Mountain Rose Herbs - Product / Service
- Exhibits144: Mountain Rose Herbs - Key offerings
- Exhibits145: North American Herb and Spice - Overview
- Exhibits146: North American Herb and Spice - Product / Service
- Exhibits147: North American Herb and Spice - Key offerings
- Exhibits148: NOW Health Group Inc. - Overview
- Exhibits149: NOW Health Group Inc. - Product / Service
- Exhibits150: NOW Health Group Inc. - Key offerings
- Exhibits151: Plant Therapy - Overview
- Exhibits152: Plant Therapy - Product / Service
- Exhibits153: Plant Therapy - Key offerings
- Exhibits154: Rocky Mountain Oils LLC - Overview
- Exhibits155: Rocky Mountain Oils LLC - Product / Service
- Exhibits156: Rocky Mountain Oils LLC - Key offerings
- Exhibits157: Starwest Botanicals.com Inc. - Overview
- Exhibits158: Starwest Botanicals.com Inc. - Product / Service
- Exhibits159: Starwest Botanicals.com Inc. - Key offerings
- Exhibits160: Young Living Essential Oils LC - Overview
- Exhibits161: Young Living Essential Oils LC - Product / Service
- Exhibits162: Young Living Essential Oils LC - Key news
- Exhibits163: Young Living Essential Oils LC - Key offerings
- Exhibits164: Inclusions checklist
- Exhibits165: Exclusions checklist
- Exhibits166: Currency conversion rates for US$
- Exhibits167: Research methodology
- Exhibits168: Information sources
- Exhibits169: Data validation
- Exhibits170: Validation techniques employed for market sizing
- Exhibits171: Data synthesis
- Exhibits172: 360 degree market analysis
- Exhibits173: List of abbreviations
Technavio has been monitoring the aromatherapy market and is forecast to grow by USD 2730.9 mn during 2023-2028, accelerating at a CAGR of 10.87% during the forecast period. Our report on the aromatherapy market provides a holistic analysis, market size and forecast, trends, growth drivers, and challenges, as well as vendor analysis covering around 25 vendors.
The report offers an up-to-date analysis regarding the current market scenario, the latest trends and drivers, and the overall market environment. The market is driven by increasing use of aromatherapy at home, rise in awareness about health benefits of aromatherapy, and changing lifestyles.
Technavio's aromatherapy market is segmented as below:
| Market Scope | |
|---|---|
| Base Year | 2024 |
| End Year | 2028 |
| Series Year | 2024-2028 |
| Growth Momentum | Accelerate |
| YOY 2024 | 9.53% |
| CAGR | 10.87% |
| Incremental Value | $2730.9mn |
By Product
- Consumables
- Equipment
By Usage
- Topical application
- Aerial diffusion
- Direct inhalation
By Geography
- North America
- Europe
- APAC
- South America
- Middle East and Africa
This study identifies the increasing demand for aromatherapy products as one of the prime reasons driving the aromatherapy market growth during the next few years. Also, continuous product innovation and improvement and increase in corporate wellness initiatives will lead to sizable demand in the market.
Technavio presents a detailed picture of the market by the way of study, synthesis, and summation of data from multiple sources by an analysis of key parameters. Our report on the aromatherapy market covers the following areas:
- Aromatherapy market sizing
- Aromatherapy market forecast
- Aromatherapy market industry analysis
Technavio's robust vendor analysis is designed to help clients improve their market position, and in line with this, this report provides a detailed analysis of several leading aromatherapy market vendors that include Air Aroma Internatinal, Biolandes SAS, doTERRA International LLC, Edens Garden, Falcon, Frontier Co op, G. Baldwin and Co., Hubmar International, Isagenix Worldwide Inc., JE INTERNATIONAL SARL, Mountain Rose Herbs, North American Herb and Spice, NOW Health Group Inc., Nu Skin Enterprises Inc., Plant Therapy, Rocky Mountain Oils LLC, SpaRoom, Stadler Form Aktiengesellschaft, Starwest Botanicals.com Inc., and Young Living Essential Oils LC. Also, the aromatherapy market analysis report includes information on upcoming trends and challenges that will influence market growth. This is to help companies strategize and leverage all forthcoming growth opportunities.
The study was conducted using an objective combination of primary and secondary information including inputs from key participants in the industry. The report contains a comprehensive market and vendor landscape in addition to an analysis of the key vendors.
Technavio presents a detailed picture of the market by the way of study, synthesis, and summation of data from multiple sources by an analysis of key parameters such as profit, pricing, competition, and promotions. It presents various market facets by identifying the key industry influencers. The data presented is comprehensive, reliable, and a result of extensive research - both primary and secondary. Technavio's market research reports provide a complete competitive landscape and an in-depth vendor selection methodology and analysis using qualitative and quantitative research to forecast accurate market growth.
Table of Contents
1 Executive Summary
- 1.1 Market overview
- Executive Summary - Chart on Market Overview
- Executive Summary - Data Table on Market Overview
- Executive Summary - Chart on Global Market Characteristics
- Executive Summary - Chart on Market by Geography
- Executive Summary - Chart on Market Segmentation by Product
- Executive Summary - Chart on Market Segmentation by Usage
- Executive Summary - Chart on Incremental Growth
- Executive Summary - Data Table on Incremental Growth
- Executive Summary - Chart on Company Market Positioning
2 Market Landscape
- 2.1 Market ecosystem
- Parent Market
- Data Table on - Parent Market
- 2.2 Market characteristics
- Market characteristics analysis
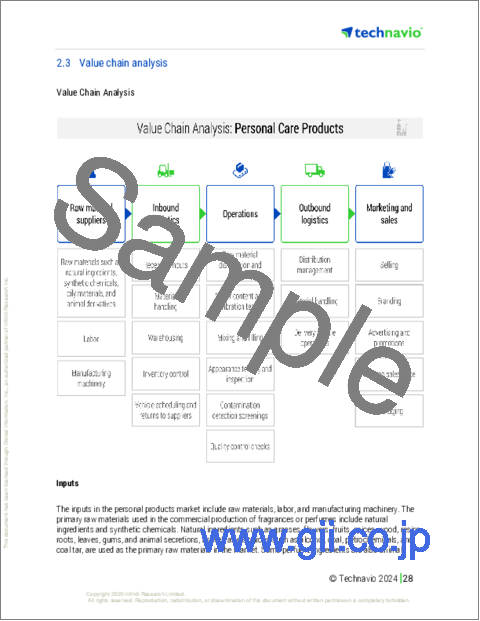
- 2.3 Value chain analysis
- Value Chain Analysis
3 Market Sizing
- 3.1 Market definition
- Offerings of companies included in the market definition
- 3.2 Market segment analysis
- Market segments
- 3.3 Market size 2023
- 3.4 Market outlook: Forecast for 2023-2028
- Chart on Global - Market size and forecast 2023-2028 ($ million)
- Data Table on Global - Market size and forecast 2023-2028 ($ million)
- Chart on Global Market: Year-over-year growth 2023-2028 (%)
- Data Table on Global Market: Year-over-year growth 2023-2028 (%)
4 Historic Market Size
- 4.1 Global Aromatherapy Market 2018 - 2022
- Historic Market Size - Data Table on Global Aromatherapy Market 2018 - 2022 ($ million)
- 4.2 Product segment analysis 2018 - 2022
- Historic Market Size - Product Segment 2018 - 2022 ($ million)
- 4.3 Usage segment analysis 2018 - 2022
- Historic Market Size - Usage Segment 2018 - 2022 ($ million)
- 4.4 Geography segment analysis 2018 - 2022
- Historic Market Size - Geography Segment 2018 - 2022 ($ million)
- 4.5 Country segment analysis 2018 - 2022
- Historic Market Size - Country Segment 2018 - 2022 ($ million)
5 Five Forces Analysis
- 5.1 Five forces summary
- Five forces analysis - Comparison between 2023 and 2028
- 5.2 Bargaining power of buyers
- Bargaining power of buyers - Impact of key factors 2023 and 2028
- 5.3 Bargaining power of suppliers
- Bargaining power of suppliers - Impact of key factors in 2023 and 2028
- 5.4 Threat of new entrants
- Threat of new entrants - Impact of key factors in 2023 and 2028
- 5.5 Threat of substitutes
- Threat of substitutes - Impact of key factors in 2023 and 2028
- 5.6 Threat of rivalry
- Threat of rivalry - Impact of key factors in 2023 and 2028
- 5.7 Market condition
- Chart on Market condition - Five forces 2023 and 2028
6 Market Segmentation by Product
- 6.1 Market segments
- Chart on Product - Market share 2023-2028 (%)
- Data Table on Product - Market share 2023-2028 (%)
- 6.2 Comparison by Product
- Chart on Comparison by Product
- Data Table on Comparison by Product
- 6.3 Consumables - Market size and forecast 2023-2028
- Chart on Consumables - Market size and forecast 2023-2028 ($ million)
- Data Table on Consumables - Market size and forecast 2023-2028 ($ million)
- Chart on Consumables - Year-over-year growth 2023-2028 (%)
- Data Table on Consumables - Year-over-year growth 2023-2028 (%)
- 6.4 Equipment - Market size and forecast 2023-2028
- Chart on Equipment - Market size and forecast 2023-2028 ($ million)
- Data Table on Equipment - Market size and forecast 2023-2028 ($ million)
- Chart on Equipment - Year-over-year growth 2023-2028 (%)
- Data Table on Equipment - Year-over-year growth 2023-2028 (%)
- 6.5 Market opportunity by Product
- Market opportunity by Product ($ million)
- Data Table on Market opportunity by Product ($ million)
7 Market Segmentation by Usage
- 7.1 Market segments
- Chart on Usage - Market share 2023-2028 (%)
- Data Table on Usage - Market share 2023-2028 (%)
- 7.2 Comparison by Usage
- Chart on Comparison by Usage
- Data Table on Comparison by Usage
- 7.3 Topical application - Market size and forecast 2023-2028
- Chart on Topical application - Market size and forecast 2023-2028 ($ million)
- Data Table on Topical application - Market size and forecast 2023-2028 ($ million)
- Chart on Topical application - Year-over-year growth 2023-2028 (%)
- Data Table on Topical application - Year-over-year growth 2023-2028 (%)
- 7.4 Aerial diffusion - Market size and forecast 2023-2028
- Chart on Aerial diffusion - Market size and forecast 2023-2028 ($ million)
- Data Table on Aerial diffusion - Market size and forecast 2023-2028 ($ million)
- Chart on Aerial diffusion - Year-over-year growth 2023-2028 (%)
- Data Table on Aerial diffusion - Year-over-year growth 2023-2028 (%)
- 7.5 Direct inhalation - Market size and forecast 2023-2028
- Chart on Direct inhalation - Market size and forecast 2023-2028 ($ million)
- Data Table on Direct inhalation - Market size and forecast 2023-2028 ($ million)
- Chart on Direct inhalation - Year-over-year growth 2023-2028 (%)
- Data Table on Direct inhalation - Year-over-year growth 2023-2028 (%)
- 7.6 Market opportunity by Usage
- Market opportunity by Usage ($ million)
- Data Table on Market opportunity by Usage ($ million)
8 Customer Landscape
- 8.1 Customer landscape overview
- Analysis of price sensitivity, lifecycle, customer purchase basket, adoption rates, and purchase criteria
9 Geographic Landscape
- 9.1 Geographic segmentation
- Chart on Market share By Geographical Landscape2023-2028 (%)
- Data Table on Market share By Geographical Landscape2023-2028 (%)
- 9.2 Geographic comparison
- Chart on Geographic comparison
- Data Table on Geographic comparison
- 9.3 North America - Market size and forecast 2023-2028
- Chart on North America - Market size and forecast 2023-2028 ($ million)
- Data Table on North America - Market size and forecast 2023-2028 ($ million)
- Chart on North America - Year-over-year growth 2023-2028 (%)
- Data Table on North America - Year-over-year growth 2023-2028 (%)
- 9.4 Europe - Market size and forecast 2023-2028
- Chart on Europe - Market size and forecast 2023-2028 ($ million)
- Data Table on Europe - Market size and forecast 2023-2028 ($ million)
- Chart on Europe - Year-over-year growth 2023-2028 (%)
- Data Table on Europe - Year-over-year growth 2023-2028 (%)
- 9.5 APAC - Market size and forecast 2023-2028
- Chart on APAC - Market size and forecast 2023-2028 ($ million)
- Data Table on APAC - Market size and forecast 2023-2028 ($ million)
- Chart on APAC - Year-over-year growth 2023-2028 (%)
- Data Table on APAC - Year-over-year growth 2023-2028 (%)
- 9.6 South America - Market size and forecast 2023-2028
- Chart on South America - Market size and forecast 2023-2028 ($ million)
- Data Table on South America - Market size and forecast 2023-2028 ($ million)
- Chart on South America - Year-over-year growth 2023-2028 (%)
- Data Table on South America - Year-over-year growth 2023-2028 (%)
- 9.7 Middle East and Africa - Market size and forecast 2023-2028
- Chart on Middle East and Africa - Market size and forecast 2023-2028 ($ million)
- Data Table on Middle East and Africa - Market size and forecast 2023-2028 ($ million)
- Chart on Middle East and Africa - Year-over-year growth 2023-2028 (%)
- Data Table on Middle East and Africa - Year-over-year growth 2023-2028 (%)
- 9.8 US - Market size and forecast 2023-2028
- Chart on US - Market size and forecast 2023-2028 ($ million)
- Data Table on US - Market size and forecast 2023-2028 ($ million)
- Chart on US - Year-over-year growth 2023-2028 (%)
- Data Table on US - Year-over-year growth 2023-2028 (%)
- 9.9 UK - Market size and forecast 2023-2028
- Chart on UK - Market size and forecast 2023-2028 ($ million)
- Data Table on UK - Market size and forecast 2023-2028 ($ million)
- Chart on UK - Year-over-year growth 2023-2028 (%)
- Data Table on UK - Year-over-year growth 2023-2028 (%)
- 9.10 China - Market size and forecast 2023-2028
- Chart on China - Market size and forecast 2023-2028 ($ million)
- Data Table on China - Market size and forecast 2023-2028 ($ million)
- Chart on China - Year-over-year growth 2023-2028 (%)
- Data Table on China - Year-over-year growth 2023-2028 (%)
- 9.11 Japan - Market size and forecast 2023-2028
- Chart on Japan - Market size and forecast 2023-2028 ($ million)
- Data Table on Japan - Market size and forecast 2023-2028 ($ million)
- Chart on Japan - Year-over-year growth 2023-2028 (%)
- Data Table on Japan - Year-over-year growth 2023-2028 (%)
- 9.12 Germany - Market size and forecast 2023-2028
- Chart on Germany - Market size and forecast 2023-2028 ($ million)
- Data Table on Germany - Market size and forecast 2023-2028 ($ million)
- Chart on Germany - Year-over-year growth 2023-2028 (%)
- Data Table on Germany - Year-over-year growth 2023-2028 (%)
- 9.13 Market opportunity by geography
- Market opportunity By Geographical Landscape($ million)
- Data Tables on Market opportunity By Geographical Landscape($ million)
10 Drivers, Challenges, and Opportunity/Restraints
- 10.1 Market drivers
- 10.2 Market challenges
- 10.3 Impact of drivers and challenges
- Impact of drivers and challenges in 2023 and 2028
- 10.4 Market opportunities/restraints
11 Competitive Landscape
- 11.1 Overview
- 11.2 Competitive Landscape
- Overview on criticality of inputs and factors of differentiation
- 11.3 Landscape disruption
- Overview on factors of disruption
- 11.4 Industry risks
- Impact of key risks on business
12 Competitive Analysis
- 12.1 Companies profiled
- Companies covered
- 12.2 Market positioning of companies
- Matrix on companies position and classification
- 12.3 Air Aroma Internatinal
- Air Aroma Internatinal - Overview
- Air Aroma Internatinal - Product / Service
- Air Aroma Internatinal - Key offerings
- 12.4 Biolandes SAS
- Biolandes SAS - Overview
- Biolandes SAS - Product / Service
- Biolandes SAS - Key offerings
- 12.5 doTERRA International LLC
- doTERRA International LLC - Overview
- doTERRA International LLC - Product / Service
- doTERRA International LLC - Key news
- doTERRA International LLC - Key offerings
- 12.6 Edens Garden
- Edens Garden - Overview
- Edens Garden - Product / Service
- Edens Garden - Key offerings
- 12.7 Falcon
- Falcon - Overview
- Falcon - Product / Service
- Falcon - Key offerings
- 12.8 Hubmar International
- Hubmar International - Overview
- Hubmar International - Product / Service
- Hubmar International - Key offerings
- 12.9 Isagenix Worldwide Inc.
- Isagenix Worldwide Inc. - Overview
- Isagenix Worldwide Inc. - Product / Service
- Isagenix Worldwide Inc. - Key offerings
- 12.10 JE INTERNATIONAL SARL
- JE INTERNATIONAL SARL - Overview
- JE INTERNATIONAL SARL - Product / Service
- JE INTERNATIONAL SARL - Key offerings
- 12.11 Mountain Rose Herbs
- Mountain Rose Herbs - Overview
- Mountain Rose Herbs - Product / Service
- Mountain Rose Herbs - Key offerings
- 12.12 North American Herb and Spice
- North American Herb and Spice - Overview
- North American Herb and Spice - Product / Service
- North American Herb and Spice - Key offerings
- 12.13 NOW Health Group Inc.
- NOW Health Group Inc. - Overview
- NOW Health Group Inc. - Product / Service
- NOW Health Group Inc. - Key offerings
- 12.14 Plant Therapy
- Plant Therapy - Overview
- Plant Therapy - Product / Service
- Plant Therapy - Key offerings
- 12.15 Rocky Mountain Oils LLC
- Rocky Mountain Oils LLC - Overview
- Rocky Mountain Oils LLC - Product / Service
- Rocky Mountain Oils LLC - Key offerings
- 12.16 Starwest Botanicals.com Inc.
- Starwest Botanicals.com Inc. - Overview
- Starwest Botanicals.com Inc. - Product / Service
- Starwest Botanicals.com Inc. - Key offerings
- 12.17 Young Living Essential Oils LC
- Young Living Essential Oils LC - Overview
- Young Living Essential Oils LC - Product / Service
- Young Living Essential Oils LC - Key news
- Young Living Essential Oils LC - Key offerings
13 Appendix
- 13.1 Scope of the report
- 13.2 Inclusions and exclusions checklist
- Inclusions checklist
- Exclusions checklist
- 13.3 Currency conversion rates for US$
- Currency conversion rates for US$
- 13.4 Research methodology
- Research methodology
- 13.5 Data procurement
- Information sources
- 13.6 Data validation
- Data validation
- 13.7 Validation techniques employed for market sizing
- Validation techniques employed for market sizing
- 13.8 Data synthesis
- Data synthesis
- 13.9 360 degree market analysis
- 360 degree market analysis
- 13.10 List of abbreviations
- List of abbreviations
