|
|
市場調査レポート
商品コード
1723062
全地形対応車(ATV)の世界市場 2025~2029年Global All-terrain Vehicle (ATV) Market 2025-2029 |
||||||

|
|||||||
カスタマイズ可能
|
|||||||


| 全地形対応車(ATV)の世界市場 2025~2029年 |
|
出版日: 2025年05月07日
発行: TechNavio
ページ情報: 英文 225 Pages
納期: 即納可能
|

全表示
- 概要
- 図表
- 目次
全地形対応車(ATV)市場は2024-2029年に21億6,090万米ドル、予測期間中のCAGRは8.4%で成長すると予測されます。
当レポートでは、全地形対応車(ATV)市場の全体的な分析、市場規模・予測、動向、成長促進要因、課題、約25のベンダーを網羅したベンダー分析などを掲載しています。
現在の市場シナリオ、最新動向と促進要因、市場環境全体に関する最新分析を提供しています。同市場は、レクリエーション、スポーツ、軍事用途におけるATVの使用拡大、レクリエーションや冒険的なスポーツ活動におけるATVの需要増加、ATVの需要増加などが牽引しています。
| 市場範囲 | |
|---|---|
| 基準年 | 2025 |
| 終了年 | 2029 |
| 予測期間 | 2025-2029 |
| 成長モメンタム | 加速 |
| 前年比2025年 | 7.8% |
| CAGR | 8.4% |
| 増分額 | 21億6,090万米ドル |
本調査は、業界の主要参加者からのインプットを含め、一次情報と二次情報を客観的に組み合わせて実施しました。レポートには、主要企業の分析に加え、包括的な市場規模データ、地域分析によるセグメント、ベンダー情勢が含まれています。レポートには過去データと予測データがあります。
本調査では、今後数年間の全地形対応車(ATV)市場の成長を促進する主な要因の1つとして、ATV体験ゾーンの増加を挙げています。また、ATVにおけるCVTシステムの普及拡大や自律型ATVの進歩は、市場の大きな需要につながります。
目次
第1章 エグゼクティブサマリー
- 市場概要
第2章 Technavio分析
- 価格・ライフサイクル・顧客購入バスケット・採用率・購入基準の分析
- インプットの重要性と差別化の要因
- 混乱の要因
- 促進要因と課題の影響
第3章 市場情勢
- 市場エコシステム
- 市場の特徴
- バリューチェーン分析
第4章 市場規模
- 市場の定義
- 市場セグメント分析
- 市場規模 2024
- 市場の見通し 2024-2029
第5章 市場規模実績
- 全地形対応車(ATV)の世界市場 2019-2023
- エンジン容量別セグメント分析 2019-2023
- 用途別セグメント分析 2019-2023
- 推進別セグメント分析 2019-2023
- 地域別セグメント分析 2019-2023
- 国別セグメント分析 2019-2023
第6章 定性分析
- AIの影響:全地形対応車(ATV)の世界市場
第7章 ファイブフォース分析
- ファイブフォースの要約
- 買い手の交渉力
- 供給企業の交渉力
- 新規参入業者の脅威
- 代替品の脅威
- 競争の脅威
- 市況
第8章 市場セグメンテーション:エンジン容量別
- 市場セグメント
- 比較:エンジン容量別
- 400cc以下:市場規模と予測 2024-2029
- 800cc以上:市場規模と予測 2024-2029
- 市場機会:エンジン容量別
第9章 市場セグメンテーション:用途別
- 市場セグメント
- 比較:用途別
- レクリエーション:市場規模と予測 2024-2029
- スポーツ:市場規模と予測 2024-2029
- 農業:市場規模と予測 2024-2029
- 軍事と防衛:市場規模と予測 2024-2029
- 市場機会:用途別
第10章 市場セグメンテーション:推進力別
- 市場セグメント
- 比較:推進力別
- ガソリン:市場規模と予測 2024-2029
- ディーゼル:市場規模と予測 2024-2029
- 電気:市場規模と予測 2024-2029
- 市場機会:推進力別
第11章 顧客情勢
- 顧客情勢の概要
第12章 地域別情勢
- 地域別セグメンテーション
- 地域別比較
- 北米:市場規模と予測 2024-2029
- 欧州:市場規模と予測 2024-2029
- アジア太平洋:市場規模と予測 2024-2029
- 中東・アフリカ:市場規模と予測 2024-2029
- 南米:市場規模と予測 2024-2029
- 米国:市場規模と予測 2024-2029
- オーストラリア:市場規模と予測 2024-2029
- ドイツ:市場規模と予測 2024-2029
- カナダ:市場規模と予測 2024-2029
- フランス:市場規模と予測 2024-2029
- 英国:市場規模と予測 2024-2029
- イタリア:市場規模と予測 2024-2029
- オランダ:市場規模と予測 2024-2029
- スペイン:市場規模と予測 2024-2029
- メキシコ:市場規模と予測 2024-2029
- 市場機会:地域情勢別
第13章 促進要因・課題・機会・抑制要因
- 市場促進要因
- 市場の課題
- 促進要因と課題の影響
- 市場の機会・抑制要因
第14章 競合情勢
- 概要
- 競合情勢
- 混乱の状況
- 業界のリスク
第15章 競合分析
- 企業プロファイル
- 企業ランキング指数
- 企業の市場ポジショニング
- Bombardier Recreational Products Inc.
- HISUN Motors Corp.
- Honda Motor Co. Ltd.
- Kawasaki Heavy Industries Ltd.
- Mahindra and Mahindra Ltd.
- Nebula Automotive Pvt. Ltd.
- Polaris Inc.
- SHERP
- Suzuki Motor Corp.
- Taiwan Golden Bee Co. Ltd.
- Tao Motor Inc.
- Textron Inc.
- TOMCAR
- Yamaha Motor Co. Ltd.
- ZHEJIANG CFMOTO POWER Co. Ltd.
第16章 付録
Exhibits:
- Exhibits1: Executive Summary - Chart on Market Overview
- Exhibits2: Executive Summary - Data Table on Market Overview
- Exhibits3: Executive Summary - Chart on Global Market Characteristics
- Exhibits4: Executive Summary - Chart on Market By Geographical Landscape
- Exhibits5: Executive Summary - Chart on Market Segmentation by Engine Capacity
- Exhibits6: Executive Summary - Chart on Market Segmentation by Application
- Exhibits7: Executive Summary - Chart on Market Segmentation by Propulsion
- Exhibits8: Executive Summary - Chart on Incremental Growth
- Exhibits9: Executive Summary - Data Table on Incremental Growth
- Exhibits10: Executive Summary - Chart on Company Market Positioning
- Exhibits11: Analysis of price sensitivity, lifecycle, customer purchase basket, adoption rates, and purchase criteria
- Exhibits12: Overview on criticality of inputs and factors of differentiation
- Exhibits13: Overview on factors of disruption
- Exhibits14: Impact of drivers and challenges in 2024 and 2029
- Exhibits15: Parent Market
- Exhibits16: Data Table on - Parent Market
- Exhibits17: Market characteristics analysis
- Exhibits18: Value chain analysis
- Exhibits19: Offerings of companies included in the market definition
- Exhibits20: Market segments
- Exhibits21: Chart on Global - Market size and forecast 2024-2029 ($ million)
- Exhibits22: Data Table on Global - Market size and forecast 2024-2029 ($ million)
- Exhibits23: Chart on Global Market: Year-over-year growth 2024-2029 (%)
- Exhibits24: Data Table on Global Market: Year-over-year growth 2024-2029 (%)
- Exhibits25: Historic Market Size - Data Table on Global All-Terrain Vehicle (ATV) Market 2019 - 2023 ($ million)
- Exhibits26: Historic Market Size - Engine Capacity Segment 2019 - 2023 ($ million)
- Exhibits27: Historic Market Size - Application Segment 2019 - 2023 ($ million)
- Exhibits28: Historic Market Size - Propulsion Segment 2019 - 2023 ($ million)
- Exhibits29: Historic Market Size - Geography Segment 2019 - 2023 ($ million)
- Exhibits30: Historic Market Size - Country Segment 2019 - 2023 ($ million)
- Exhibits31: Five forces analysis - Comparison between 2024 and 2029
- Exhibits32: Bargaining power of buyers - Impact of key factors 2024 and 2029
- Exhibits33: Bargaining power of suppliers - Impact of key factors in 2024 and 2029
- Exhibits34: Threat of new entrants - Impact of key factors in 2024 and 2029
- Exhibits35: Threat of substitutes - Impact of key factors in 2024 and 2029
- Exhibits36: Threat of rivalry - Impact of key factors in 2024 and 2029
- Exhibits37: Chart on Market condition - Five forces 2024 and 2029
- Exhibits38: Chart on Engine Capacity - Market share 2024-2029 (%)
- Exhibits39: Data Table on Engine Capacity - Market share 2024-2029 (%)
- Exhibits40: Chart on Comparison by Engine Capacity
- Exhibits41: Data Table on Comparison by Engine Capacity
- Exhibits42: Chart on 400cc-800cc - Market size and forecast 2024-2029 ($ million)
- Exhibits43: Data Table on 400cc-800cc - Market size and forecast 2024-2029 ($ million)
- Exhibits44: Chart on 400cc-800cc - Year-over-year growth 2024-2029 (%)
- Exhibits45: Data Table on 400cc-800cc - Year-over-year growth 2024-2029 (%)
- Exhibits46: Chart on Below 400cc - Market size and forecast 2024-2029 ($ million)
- Exhibits47: Data Table on Below 400cc - Market size and forecast 2024-2029 ($ million)
- Exhibits48: Chart on Below 400cc - Year-over-year growth 2024-2029 (%)
- Exhibits49: Data Table on Below 400cc - Year-over-year growth 2024-2029 (%)
- Exhibits50: Chart on Above 800cc - Market size and forecast 2024-2029 ($ million)
- Exhibits51: Data Table on Above 800cc - Market size and forecast 2024-2029 ($ million)
- Exhibits52: Chart on Above 800cc - Year-over-year growth 2024-2029 (%)
- Exhibits53: Data Table on Above 800cc - Year-over-year growth 2024-2029 (%)
- Exhibits54: Market opportunity by Engine Capacity ($ million)
- Exhibits55: Data Table on Market opportunity by Engine Capacity ($ million)
- Exhibits56: Chart on Application - Market share 2024-2029 (%)
- Exhibits57: Data Table on Application - Market share 2024-2029 (%)
- Exhibits58: Chart on Comparison by Application
- Exhibits59: Data Table on Comparison by Application
- Exhibits60: Chart on Recreational - Market size and forecast 2024-2029 ($ million)
- Exhibits61: Data Table on Recreational - Market size and forecast 2024-2029 ($ million)
- Exhibits62: Chart on Recreational - Year-over-year growth 2024-2029 (%)
- Exhibits63: Data Table on Recreational - Year-over-year growth 2024-2029 (%)
- Exhibits64: Chart on Sports - Market size and forecast 2024-2029 ($ million)
- Exhibits65: Data Table on Sports - Market size and forecast 2024-2029 ($ million)
- Exhibits66: Chart on Sports - Year-over-year growth 2024-2029 (%)
- Exhibits67: Data Table on Sports - Year-over-year growth 2024-2029 (%)
- Exhibits68: Chart on Agriculture - Market size and forecast 2024-2029 ($ million)
- Exhibits69: Data Table on Agriculture - Market size and forecast 2024-2029 ($ million)
- Exhibits70: Chart on Agriculture - Year-over-year growth 2024-2029 (%)
- Exhibits71: Data Table on Agriculture - Year-over-year growth 2024-2029 (%)
- Exhibits72: Chart on Military and defense - Market size and forecast 2024-2029 ($ million)
- Exhibits73: Data Table on Military and defense - Market size and forecast 2024-2029 ($ million)
- Exhibits74: Chart on Military and defense - Year-over-year growth 2024-2029 (%)
- Exhibits75: Data Table on Military and defense - Year-over-year growth 2024-2029 (%)
- Exhibits76: Market opportunity by Application ($ million)
- Exhibits77: Data Table on Market opportunity by Application ($ million)
- Exhibits78: Chart on Propulsion - Market share 2024-2029 (%)
- Exhibits79: Data Table on Propulsion - Market share 2024-2029 (%)
- Exhibits80: Chart on Comparison by Propulsion
- Exhibits81: Data Table on Comparison by Propulsion
- Exhibits82: Chart on Gasoline - Market size and forecast 2024-2029 ($ million)
- Exhibits83: Data Table on Gasoline - Market size and forecast 2024-2029 ($ million)
- Exhibits84: Chart on Gasoline - Year-over-year growth 2024-2029 (%)
- Exhibits85: Data Table on Gasoline - Year-over-year growth 2024-2029 (%)
- Exhibits86: Chart on Diesel - Market size and forecast 2024-2029 ($ million)
- Exhibits87: Data Table on Diesel - Market size and forecast 2024-2029 ($ million)
- Exhibits88: Chart on Diesel - Year-over-year growth 2024-2029 (%)
- Exhibits89: Data Table on Diesel - Year-over-year growth 2024-2029 (%)
- Exhibits90: Chart on Electric - Market size and forecast 2024-2029 ($ million)
- Exhibits91: Data Table on Electric - Market size and forecast 2024-2029 ($ million)
- Exhibits92: Chart on Electric - Year-over-year growth 2024-2029 (%)
- Exhibits93: Data Table on Electric - Year-over-year growth 2024-2029 (%)
- Exhibits94: Market opportunity by Propulsion ($ million)
- Exhibits95: Data Table on Market opportunity by Propulsion ($ million)
- Exhibits96: Analysis of price sensitivity, lifecycle, customer purchase basket, adoption rates, and purchase criteria
- Exhibits97: Chart on Market share By Geographical Landscape 2024-2029 (%)
- Exhibits98: Data Table on Market share By Geographical Landscape 2024-2029 (%)
- Exhibits99: Chart on Geographic comparison
- Exhibits100: Data Table on Geographic comparison
- Exhibits101: Chart on North America - Market size and forecast 2024-2029 ($ million)
- Exhibits102: Data Table on North America - Market size and forecast 2024-2029 ($ million)
- Exhibits103: Chart on North America - Year-over-year growth 2024-2029 (%)
- Exhibits104: Data Table on North America - Year-over-year growth 2024-2029 (%)
- Exhibits105: Chart on Europe - Market size and forecast 2024-2029 ($ million)
- Exhibits106: Data Table on Europe - Market size and forecast 2024-2029 ($ million)
- Exhibits107: Chart on Europe - Year-over-year growth 2024-2029 (%)
- Exhibits108: Data Table on Europe - Year-over-year growth 2024-2029 (%)
- Exhibits109: Chart on APAC - Market size and forecast 2024-2029 ($ million)
- Exhibits110: Data Table on APAC - Market size and forecast 2024-2029 ($ million)
- Exhibits111: Chart on APAC - Year-over-year growth 2024-2029 (%)
- Exhibits112: Data Table on APAC - Year-over-year growth 2024-2029 (%)
- Exhibits113: Chart on Middle East and Africa - Market size and forecast 2024-2029 ($ million)
- Exhibits114: Data Table on Middle East and Africa - Market size and forecast 2024-2029 ($ million)
- Exhibits115: Chart on Middle East and Africa - Year-over-year growth 2024-2029 (%)
- Exhibits116: Data Table on Middle East and Africa - Year-over-year growth 2024-2029 (%)
- Exhibits117: Chart on South America - Market size and forecast 2024-2029 ($ million)
- Exhibits118: Data Table on South America - Market size and forecast 2024-2029 ($ million)
- Exhibits119: Chart on South America - Year-over-year growth 2024-2029 (%)
- Exhibits120: Data Table on South America - Year-over-year growth 2024-2029 (%)
- Exhibits121: Chart on US - Market size and forecast 2024-2029 ($ million)
- Exhibits122: Data Table on US - Market size and forecast 2024-2029 ($ million)
- Exhibits123: Chart on US - Year-over-year growth 2024-2029 (%)
- Exhibits124: Data Table on US - Year-over-year growth 2024-2029 (%)
- Exhibits125: Chart on Australia - Market size and forecast 2024-2029 ($ million)
- Exhibits126: Data Table on Australia - Market size and forecast 2024-2029 ($ million)
- Exhibits127: Chart on Australia - Year-over-year growth 2024-2029 (%)
- Exhibits128: Data Table on Australia - Year-over-year growth 2024-2029 (%)
- Exhibits129: Chart on Germany - Market size and forecast 2024-2029 ($ million)
- Exhibits130: Data Table on Germany - Market size and forecast 2024-2029 ($ million)
- Exhibits131: Chart on Germany - Year-over-year growth 2024-2029 (%)
- Exhibits132: Data Table on Germany - Year-over-year growth 2024-2029 (%)
- Exhibits133: Chart on Canada - Market size and forecast 2024-2029 ($ million)
- Exhibits134: Data Table on Canada - Market size and forecast 2024-2029 ($ million)
- Exhibits135: Chart on Canada - Year-over-year growth 2024-2029 (%)
- Exhibits136: Data Table on Canada - Year-over-year growth 2024-2029 (%)
- Exhibits137: Chart on France - Market size and forecast 2024-2029 ($ million)
- Exhibits138: Data Table on France - Market size and forecast 2024-2029 ($ million)
- Exhibits139: Chart on France - Year-over-year growth 2024-2029 (%)
- Exhibits140: Data Table on France - Year-over-year growth 2024-2029 (%)
- Exhibits141: Chart on UK - Market size and forecast 2024-2029 ($ million)
- Exhibits142: Data Table on UK - Market size and forecast 2024-2029 ($ million)
- Exhibits143: Chart on UK - Year-over-year growth 2024-2029 (%)
- Exhibits144: Data Table on UK - Year-over-year growth 2024-2029 (%)
- Exhibits145: Chart on Italy - Market size and forecast 2024-2029 ($ million)
- Exhibits146: Data Table on Italy - Market size and forecast 2024-2029 ($ million)
- Exhibits147: Chart on Italy - Year-over-year growth 2024-2029 (%)
- Exhibits148: Data Table on Italy - Year-over-year growth 2024-2029 (%)
- Exhibits149: Chart on The Netherlands - Market size and forecast 2024-2029 ($ million)
- Exhibits150: Data Table on The Netherlands - Market size and forecast 2024-2029 ($ million)
- Exhibits151: Chart on The Netherlands - Year-over-year growth 2024-2029 (%)
- Exhibits152: Data Table on The Netherlands - Year-over-year growth 2024-2029 (%)
- Exhibits153: Chart on Spain - Market size and forecast 2024-2029 ($ million)
- Exhibits154: Data Table on Spain - Market size and forecast 2024-2029 ($ million)
- Exhibits155: Chart on Spain - Year-over-year growth 2024-2029 (%)
- Exhibits156: Data Table on Spain - Year-over-year growth 2024-2029 (%)
- Exhibits157: Chart on Mexico - Market size and forecast 2024-2029 ($ million)
- Exhibits158: Data Table on Mexico - Market size and forecast 2024-2029 ($ million)
- Exhibits159: Chart on Mexico - Year-over-year growth 2024-2029 (%)
- Exhibits160: Data Table on Mexico - Year-over-year growth 2024-2029 (%)
- Exhibits161: Market opportunity By Geographical Landscape ($ million)
- Exhibits162: Data Tables on Market opportunity By Geographical Landscape ($ million)
- Exhibits163: Impact of drivers and challenges in 2024 and 2029
- Exhibits164: Overview on criticality of inputs and factors of differentiation
- Exhibits165: Overview on factors of disruption
- Exhibits166: Impact of key risks on business
- Exhibits167: Companies covered
- Exhibits168: Company ranking index
- Exhibits169: Matrix on companies position and classification
- Exhibits170: Bombardier Recreational Products Inc. - Overview
- Exhibits171: Bombardier Recreational Products Inc. - Business segments
- Exhibits172: Bombardier Recreational Products Inc. - Key offerings
- Exhibits173: Bombardier Recreational Products Inc. - Segment focus
- Exhibits174: SWOT
- Exhibits175: HISUN Motors Corp. - Overview
- Exhibits176: HISUN Motors Corp. - Product / Service
- Exhibits177: HISUN Motors Corp. - Key offerings
- Exhibits178: SWOT
- Exhibits179: Honda Motor Co. Ltd. - Overview
- Exhibits180: Honda Motor Co. Ltd. - Business segments
- Exhibits181: Honda Motor Co. Ltd. - Key news
- Exhibits182: Honda Motor Co. Ltd. - Key offerings
- Exhibits183: Honda Motor Co. Ltd. - Segment focus
- Exhibits184: SWOT
- Exhibits185: Kawasaki Heavy Industries Ltd. - Overview
- Exhibits186: Kawasaki Heavy Industries Ltd. - Business segments
- Exhibits187: Kawasaki Heavy Industries Ltd. - Key offerings
- Exhibits188: Kawasaki Heavy Industries Ltd. - Segment focus
- Exhibits189: SWOT
- Exhibits190: Mahindra and Mahindra Ltd. - Overview
- Exhibits191: Mahindra and Mahindra Ltd. - Business segments
- Exhibits192: Mahindra and Mahindra Ltd. - Key news
- Exhibits193: Mahindra and Mahindra Ltd. - Key offerings
- Exhibits194: Mahindra and Mahindra Ltd. - Segment focus
- Exhibits195: SWOT
- Exhibits196: Nebula Automotive Pvt. Ltd. - Overview
- Exhibits197: Nebula Automotive Pvt. Ltd. - Product / Service
- Exhibits198: Nebula Automotive Pvt. Ltd. - Key offerings
- Exhibits199: SWOT
- Exhibits200: Polaris Inc. - Overview
- Exhibits201: Polaris Inc. - Business segments
- Exhibits202: Polaris Inc. - Key news
- Exhibits203: Polaris Inc. - Key offerings
- Exhibits204: Polaris Inc. - Segment focus
- Exhibits205: SWOT
- Exhibits206: SHERP - Overview
- Exhibits207: SHERP - Business segments
- Exhibits208: SHERP - Key offerings
- Exhibits209: SHERP - Segment focus
- Exhibits210: SWOT
- Exhibits211: Suzuki Motor Corp. - Overview
- Exhibits212: Suzuki Motor Corp. - Business segments
- Exhibits213: Suzuki Motor Corp. - Key offerings
- Exhibits214: Suzuki Motor Corp. - Segment focus
- Exhibits215: SWOT
- Exhibits216: Taiwan Golden Bee Co. Ltd. - Overview
- Exhibits217: Taiwan Golden Bee Co. Ltd. - Product / Service
- Exhibits218: Taiwan Golden Bee Co. Ltd. - Key offerings
- Exhibits219: SWOT
- Exhibits220: Tao Motor Inc. - Overview
- Exhibits221: Tao Motor Inc. - Product / Service
- Exhibits222: Tao Motor Inc. - Key offerings
- Exhibits223: SWOT
- Exhibits224: Textron Inc. - Overview
- Exhibits225: Textron Inc. - Business segments
- Exhibits226: Textron Inc. - Key offerings
- Exhibits227: Textron Inc. - Segment focus
- Exhibits228: SWOT
- Exhibits229: TOMCAR - Overview
- Exhibits230: TOMCAR - Business segments
- Exhibits231: TOMCAR - Key offerings
- Exhibits232: TOMCAR - Segment focus
- Exhibits233: SWOT
- Exhibits234: Yamaha Motor Co. Ltd. - Overview
- Exhibits235: Yamaha Motor Co. Ltd. - Business segments
- Exhibits236: Yamaha Motor Co. Ltd. - Key offerings
- Exhibits237: Yamaha Motor Co. Ltd. - Segment focus
- Exhibits238: SWOT
- Exhibits239: ZHEJIANG CFMOTO POWER Co. Ltd. - Overview
- Exhibits240: ZHEJIANG CFMOTO POWER Co. Ltd. - Product / Service
- Exhibits241: ZHEJIANG CFMOTO POWER Co. Ltd. - Key offerings
- Exhibits242: SWOT
- Exhibits243: Inclusions checklist
- Exhibits244: Exclusions checklist
- Exhibits245: Currency conversion rates for US$
- Exhibits246: Research methodology
- Exhibits247: Information sources
- Exhibits248: Data validation
- Exhibits249: Validation techniques employed for market sizing
- Exhibits250: Data synthesis
- Exhibits251: 360 degree market analysis
- Exhibits252: List of abbreviations
The all-terrain vehicle (ATV) market is forecasted to grow by USD 2160.9 mn during 2024-2029, accelerating at a CAGR of 8.4% during the forecast period. The report on the all-terrain vehicle (ATV) market provides a holistic analysis, market size and forecast, trends, growth drivers, and challenges, as well as vendor analysis covering around 25 vendors.
The report offers an up-to-date analysis regarding the current market scenario, the latest trends and drivers, and the overall market environment. The market is driven by growing use of atvs in recreational, sports, and military applications, increasing demand for atvs for recreational and adventurous sports activities, and rising demand for atvs.
| Market Scope | |
|---|---|
| Base Year | 2025 |
| End Year | 2029 |
| Series Year | 2025-2029 |
| Growth Momentum | Accelerate |
| YOY 2025 | 7.8% |
| CAGR | 8.4% |
| Incremental Value | $2160.9 mn |
The study was conducted using an objective combination of primary and secondary information including inputs from key participants in the industry. The report contains a comprehensive market size data, segment with regional analysis and vendor landscape in addition to an analysis of the key companies. Reports have historic and forecast data.
Technavio's all-terrain vehicle (ATV) market is segmented as below:
By Engine Capacity
- 400cc-800cc
- Below 400cc
- Above 800cc
By Application
- Recreational
- Sports
- Agriculture
- Military and defense
By Propulsion
- Gasoline
- Diesel
- Electric
By Geographical Landscape
- North America
- Europe
- APAC
- Middle East and Africa
- South America
This study identifies the increasing number of atv experience zones as one of the prime reasons driving the all-terrain vehicle (ATV) market growth during the next few years. Also, growing penetration of cvt systems in atvs and advances in autonomous atvs will lead to sizable demand in the market.
The report on the all-terrain vehicle (ATV) market covers the following areas:
- All-Terrain Vehicle (ATV) Market sizing
- All-Terrain Vehicle (ATV) Market forecast
- All-Terrain Vehicle (ATV) Market industry analysis
The robust vendor analysis is designed to help clients improve their market position, and in line with this, this report provides a detailed analysis of several leading all-terrain vehicle (ATV) market vendors that include BMS Motorsports Inc., Bombardier Recreational Products Inc., HISUN Motors Corp., Honda Motor Co. Ltd., Kawasaki Heavy Industries Ltd., Kayo USA, Kubota Corp., Mahindra and Mahindra Ltd., Massimo Motor Sports LLC, Nebula Automotive Pvt. Ltd., Polaris Inc., SHERP, Suzuki Motor Corp., Taiwan Golden Bee Co. Ltd., Tao Motor Inc., Textron Inc., TOMCAR, Yamaha Motor Co. Ltd., and ZHEJIANG CFMOTO POWER Co. Ltd.. Also, the all-terrain vehicle (ATV) market analysis report includes information on upcoming trends and challenges that will influence market growth. This is to help companies strategize and leverage all forthcoming growth opportunities.
The publisher presents a detailed picture of the market by the way of study, synthesis, and summation of data from multiple sources by an analysis of key parameters such as profit, pricing, competition, and promotions. It presents various market facets by identifying the key industry influencers. The data presented is comprehensive, reliable, and a result of extensive primary and secondary research. The market research reports provide a complete competitive landscape and an in-depth vendor selection methodology and analysis using qualitative and quantitative research to forecast accurate market growth.
Table of Contents
1 Executive Summary
- 1.1 Market overview
- Executive Summary - Chart on Market Overview
- Executive Summary - Data Table on Market Overview
- Executive Summary - Chart on Global Market Characteristics
- Executive Summary - Chart on Market By Geographical Landscape
- Executive Summary - Chart on Market Segmentation by Engine Capacity
- Executive Summary - Chart on Market Segmentation by Application
- Executive Summary - Chart on Market Segmentation by Propulsion
- Executive Summary - Chart on Incremental Growth
- Executive Summary - Data Table on Incremental Growth
- Executive Summary - Chart on Company Market Positioning
2 Technavio Analysis
- 2.1 Analysis of price sensitivity, lifecycle, customer purchase basket, adoption rates, and purchase criteria
- Analysis of price sensitivity, lifecycle, customer purchase basket, adoption rates, and purchase criteria
- 2.2 Criticality of inputs and Factors of differentiation
- Overview on criticality of inputs and factors of differentiation
- 2.3 Factors of disruption
- Overview on factors of disruption
- 2.4 Impact of drivers and challenges
- Impact of drivers and challenges in 2024 and 2029
3 Market Landscape
- 3.1 Market ecosystem
- Parent Market
- Data Table on - Parent Market
- 3.2 Market characteristics
- Market characteristics analysis
- 3.3 Value chain analysis
- Value chain analysis
4 Market Sizing
- 4.1 Market definition
- Offerings of companies included in the market definition
- 4.2 Market segment analysis
- Market segments
- 4.3 Market size 2024
- 4.4 Market outlook: Forecast for 2024-2029
- Chart on Global - Market size and forecast 2024-2029 ($ million)
- Data Table on Global - Market size and forecast 2024-2029 ($ million)
- Chart on Global Market: Year-over-year growth 2024-2029 (%)
- Data Table on Global Market: Year-over-year growth 2024-2029 (%)
5 Historic Market Size
- 5.1 Global All-Terrain Vehicle (ATV) Market 2019 - 2023
- Historic Market Size - Data Table on Global All-Terrain Vehicle (ATV) Market 2019 - 2023 ($ million)
- 5.2 Engine Capacity segment analysis 2019 - 2023
- Historic Market Size - Engine Capacity Segment 2019 - 2023 ($ million)
- 5.3 Application segment analysis 2019 - 2023
- Historic Market Size - Application Segment 2019 - 2023 ($ million)
- 5.4 Propulsion segment analysis 2019 - 2023
- Historic Market Size - Propulsion Segment 2019 - 2023 ($ million)
- 5.5 Geography segment analysis 2019 - 2023
- Historic Market Size - Geography Segment 2019 - 2023 ($ million)
- 5.6 Country segment analysis 2019 - 2023
- Historic Market Size - Country Segment 2019 - 2023 ($ million)
6 Qualitative Analysis
- 6.1 The AI impact on global all-terrain vehicle (ATV) market
7 Five Forces Analysis
- 7.1 Five forces summary
- Five forces analysis - Comparison between 2024 and 2029
- 7.2 Bargaining power of buyers
- Bargaining power of buyers - Impact of key factors 2024 and 2029
- 7.3 Bargaining power of suppliers
- Bargaining power of suppliers - Impact of key factors in 2024 and 2029
- 7.4 Threat of new entrants
- Threat of new entrants - Impact of key factors in 2024 and 2029
- 7.5 Threat of substitutes
- Threat of substitutes - Impact of key factors in 2024 and 2029
- 7.6 Threat of rivalry
- Threat of rivalry - Impact of key factors in 2024 and 2029
- 7.7 Market condition
- Chart on Market condition - Five forces 2024 and 2029
8 Market Segmentation by Engine Capacity
- 8.1 Market segments
- Chart on Engine Capacity - Market share 2024-2029 (%)
- Data Table on Engine Capacity - Market share 2024-2029 (%)
- 8.2 Comparison by Engine Capacity
- Chart on Comparison by Engine Capacity
- Data Table on Comparison by Engine Capacity
- 400cc-800cc - Market size and forecast 2024-2029
- Chart on 400cc-800cc - Market size and forecast 2024-2029 ($ million)
- Data Table on 400cc-800cc - Market size and forecast 2024-2029 ($ million)
- Chart on 400cc-800cc - Year-over-year growth 2024-2029 (%)
- Data Table on 400cc-800cc - Year-over-year growth 2024-2029 (%)
- 8.4 Below 400cc - Market size and forecast 2024-2029
- Chart on Below 400cc - Market size and forecast 2024-2029 ($ million)
- Data Table on Below 400cc - Market size and forecast 2024-2029 ($ million)
- Chart on Below 400cc - Year-over-year growth 2024-2029 (%)
- Data Table on Below 400cc - Year-over-year growth 2024-2029 (%)
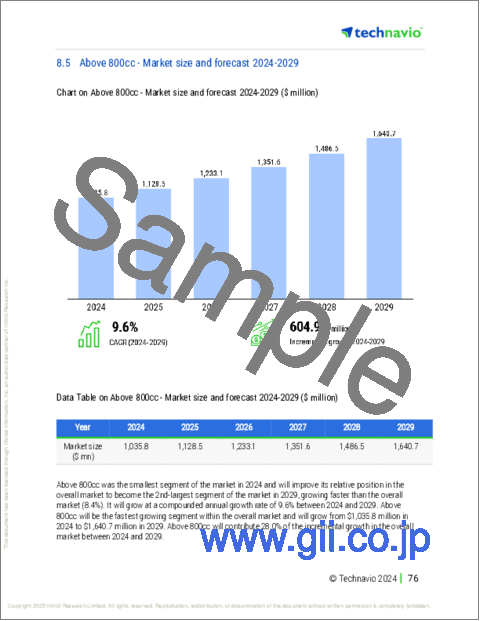
- 8.5 Above 800cc - Market size and forecast 2024-2029
- Chart on Above 800cc - Market size and forecast 2024-2029 ($ million)
- Data Table on Above 800cc - Market size and forecast 2024-2029 ($ million)
- Chart on Above 800cc - Year-over-year growth 2024-2029 (%)
- Data Table on Above 800cc - Year-over-year growth 2024-2029 (%)
- 8.6 Market opportunity by Engine Capacity
- Market opportunity by Engine Capacity ($ million)
- Data Table on Market opportunity by Engine Capacity ($ million)
9 Market Segmentation by Application
- 9.1 Market segments
- Chart on Application - Market share 2024-2029 (%)
- Data Table on Application - Market share 2024-2029 (%)
- 9.2 Comparison by Application
- Chart on Comparison by Application
- Data Table on Comparison by Application
- 9.3 Recreational - Market size and forecast 2024-2029
- Chart on Recreational - Market size and forecast 2024-2029 ($ million)
- Data Table on Recreational - Market size and forecast 2024-2029 ($ million)
- Chart on Recreational - Year-over-year growth 2024-2029 (%)
- Data Table on Recreational - Year-over-year growth 2024-2029 (%)
- 9.4 Sports - Market size and forecast 2024-2029
- Chart on Sports - Market size and forecast 2024-2029 ($ million)
- Data Table on Sports - Market size and forecast 2024-2029 ($ million)
- Chart on Sports - Year-over-year growth 2024-2029 (%)
- Data Table on Sports - Year-over-year growth 2024-2029 (%)
- 9.5 Agriculture - Market size and forecast 2024-2029
- Chart on Agriculture - Market size and forecast 2024-2029 ($ million)
- Data Table on Agriculture - Market size and forecast 2024-2029 ($ million)
- Chart on Agriculture - Year-over-year growth 2024-2029 (%)
- Data Table on Agriculture - Year-over-year growth 2024-2029 (%)
- 9.6 Military and defense - Market size and forecast 2024-2029
- Chart on Military and defense - Market size and forecast 2024-2029 ($ million)
- Data Table on Military and defense - Market size and forecast 2024-2029 ($ million)
- Chart on Military and defense - Year-over-year growth 2024-2029 (%)
- Data Table on Military and defense - Year-over-year growth 2024-2029 (%)
- 9.7 Market opportunity by Application
- Market opportunity by Application ($ million)
- Data Table on Market opportunity by Application ($ million)
10 Market Segmentation by Propulsion
- 10.1 Market segments
- Chart on Propulsion - Market share 2024-2029 (%)
- Data Table on Propulsion - Market share 2024-2029 (%)
- 10.2 Comparison by Propulsion
- Chart on Comparison by Propulsion
- Data Table on Comparison by Propulsion
- 10.3 Gasoline - Market size and forecast 2024-2029
- Chart on Gasoline - Market size and forecast 2024-2029 ($ million)
- Data Table on Gasoline - Market size and forecast 2024-2029 ($ million)
- Chart on Gasoline - Year-over-year growth 2024-2029 (%)
- Data Table on Gasoline - Year-over-year growth 2024-2029 (%)
- 10.4 Diesel - Market size and forecast 2024-2029
- Chart on Diesel - Market size and forecast 2024-2029 ($ million)
- Data Table on Diesel - Market size and forecast 2024-2029 ($ million)
- Chart on Diesel - Year-over-year growth 2024-2029 (%)
- Data Table on Diesel - Year-over-year growth 2024-2029 (%)
- 10.5 Electric - Market size and forecast 2024-2029
- Chart on Electric - Market size and forecast 2024-2029 ($ million)
- Data Table on Electric - Market size and forecast 2024-2029 ($ million)
- Chart on Electric - Year-over-year growth 2024-2029 (%)
- Data Table on Electric - Year-over-year growth 2024-2029 (%)
- 10.6 Market opportunity by Propulsion
- Market opportunity by Propulsion ($ million)
- Data Table on Market opportunity by Propulsion ($ million)
11 Customer Landscape
- 11.1 Customer landscape overview
- Analysis of price sensitivity, lifecycle, customer purchase basket, adoption rates, and purchase criteria
12 Geographic Landscape
- 12.1 Geographic segmentation
- Chart on Market share By Geographical Landscape 2024-2029 (%)
- Data Table on Market share By Geographical Landscape 2024-2029 (%)
- 12.2 Geographic comparison
- Chart on Geographic comparison
- Data Table on Geographic comparison
- 12.3 North America - Market size and forecast 2024-2029
- Chart on North America - Market size and forecast 2024-2029 ($ million)
- Data Table on North America - Market size and forecast 2024-2029 ($ million)
- Chart on North America - Year-over-year growth 2024-2029 (%)
- Data Table on North America - Year-over-year growth 2024-2029 (%)
- 12.4 Europe - Market size and forecast 2024-2029
- Chart on Europe - Market size and forecast 2024-2029 ($ million)
- Data Table on Europe - Market size and forecast 2024-2029 ($ million)
- Chart on Europe - Year-over-year growth 2024-2029 (%)
- Data Table on Europe - Year-over-year growth 2024-2029 (%)
- 12.5 APAC - Market size and forecast 2024-2029
- Chart on APAC - Market size and forecast 2024-2029 ($ million)
- Data Table on APAC - Market size and forecast 2024-2029 ($ million)
- Chart on APAC - Year-over-year growth 2024-2029 (%)
- Data Table on APAC - Year-over-year growth 2024-2029 (%)
- 12.6 Middle East and Africa - Market size and forecast 2024-2029
- Chart on Middle East and Africa - Market size and forecast 2024-2029 ($ million)
- Data Table on Middle East and Africa - Market size and forecast 2024-2029 ($ million)
- Chart on Middle East and Africa - Year-over-year growth 2024-2029 (%)
- Data Table on Middle East and Africa - Year-over-year growth 2024-2029 (%)
- 12.7 South America - Market size and forecast 2024-2029
- Chart on South America - Market size and forecast 2024-2029 ($ million)
- Data Table on South America - Market size and forecast 2024-2029 ($ million)
- Chart on South America - Year-over-year growth 2024-2029 (%)
- Data Table on South America - Year-over-year growth 2024-2029 (%)
- 12.8 US - Market size and forecast 2024-2029
- Chart on US - Market size and forecast 2024-2029 ($ million)
- Data Table on US - Market size and forecast 2024-2029 ($ million)
- Chart on US - Year-over-year growth 2024-2029 (%)
- Data Table on US - Year-over-year growth 2024-2029 (%)
- 12.9 Australia - Market size and forecast 2024-2029
- Chart on Australia - Market size and forecast 2024-2029 ($ million)
- Data Table on Australia - Market size and forecast 2024-2029 ($ million)
- Chart on Australia - Year-over-year growth 2024-2029 (%)
- Data Table on Australia - Year-over-year growth 2024-2029 (%)
- 12.10 Germany - Market size and forecast 2024-2029
- Chart on Germany - Market size and forecast 2024-2029 ($ million)
- Data Table on Germany - Market size and forecast 2024-2029 ($ million)
- Chart on Germany - Year-over-year growth 2024-2029 (%)
- Data Table on Germany - Year-over-year growth 2024-2029 (%)
- 12.11 Canada - Market size and forecast 2024-2029
- Chart on Canada - Market size and forecast 2024-2029 ($ million)
- Data Table on Canada - Market size and forecast 2024-2029 ($ million)
- Chart on Canada - Year-over-year growth 2024-2029 (%)
- Data Table on Canada - Year-over-year growth 2024-2029 (%)
- 12.12 France - Market size and forecast 2024-2029
- Chart on France - Market size and forecast 2024-2029 ($ million)
- Data Table on France - Market size and forecast 2024-2029 ($ million)
- Chart on France - Year-over-year growth 2024-2029 (%)
- Data Table on France - Year-over-year growth 2024-2029 (%)
- 12.13 UK - Market size and forecast 2024-2029
- Chart on UK - Market size and forecast 2024-2029 ($ million)
- Data Table on UK - Market size and forecast 2024-2029 ($ million)
- Chart on UK - Year-over-year growth 2024-2029 (%)
- Data Table on UK - Year-over-year growth 2024-2029 (%)
- 12.14 Italy - Market size and forecast 2024-2029
- Chart on Italy - Market size and forecast 2024-2029 ($ million)
- Data Table on Italy - Market size and forecast 2024-2029 ($ million)
- Chart on Italy - Year-over-year growth 2024-2029 (%)
- Data Table on Italy - Year-over-year growth 2024-2029 (%)
- 12.15 The Netherlands - Market size and forecast 2024-2029
- Chart on The Netherlands - Market size and forecast 2024-2029 ($ million)
- Data Table on The Netherlands - Market size and forecast 2024-2029 ($ million)
- Chart on The Netherlands - Year-over-year growth 2024-2029 (%)
- Data Table on The Netherlands - Year-over-year growth 2024-2029 (%)
- 12.16 Spain - Market size and forecast 2024-2029
- Chart on Spain - Market size and forecast 2024-2029 ($ million)
- Data Table on Spain - Market size and forecast 2024-2029 ($ million)
- Chart on Spain - Year-over-year growth 2024-2029 (%)
- Data Table on Spain - Year-over-year growth 2024-2029 (%)
- 12.17 Mexico - Market size and forecast 2024-2029
- Chart on Mexico - Market size and forecast 2024-2029 ($ million)
- Data Table on Mexico - Market size and forecast 2024-2029 ($ million)
- Chart on Mexico - Year-over-year growth 2024-2029 (%)
- Data Table on Mexico - Year-over-year growth 2024-2029 (%)
- 12.18 Market opportunity By Geographical Landscape
- Market opportunity By Geographical Landscape ($ million)
- Data Tables on Market opportunity By Geographical Landscape ($ million)
13 Drivers, Challenges, and Opportunity/Restraints
- 13.1 Market drivers
- 13.2 Market challenges
- 13.3 Impact of drivers and challenges
- Impact of drivers and challenges in 2024 and 2029
- 13.4 Market opportunities/restraints
14 Competitive Landscape
- 14.1 Overview
- 14.2 Competitive Landscape
- Overview on criticality of inputs and factors of differentiation
- 14.3 Landscape disruption
- Overview on factors of disruption
- 14.4 Industry risks
- Impact of key risks on business
15 Competitive Analysis
- 15.1 Companies profiled
- Companies covered
- 15.2 Company ranking index
- Company ranking index
- 15.3 Market positioning of companies
- Matrix on companies position and classification
- 15.4 Bombardier Recreational Products Inc.
- Bombardier Recreational Products Inc. - Overview
- Bombardier Recreational Products Inc. - Business segments
- Bombardier Recreational Products Inc. - Key offerings
- Bombardier Recreational Products Inc. - Segment focus
- SWOT
- 15.5 HISUN Motors Corp.
- HISUN Motors Corp. - Overview
- HISUN Motors Corp. - Product / Service
- HISUN Motors Corp. - Key offerings
- SWOT
- 15.6 Honda Motor Co. Ltd.
- Honda Motor Co. Ltd. - Overview
- Honda Motor Co. Ltd. - Business segments
- Honda Motor Co. Ltd. - Key news
- Honda Motor Co. Ltd. - Key offerings
- Honda Motor Co. Ltd. - Segment focus
- SWOT
- 15.7 Kawasaki Heavy Industries Ltd.
- Kawasaki Heavy Industries Ltd. - Overview
- Kawasaki Heavy Industries Ltd. - Business segments
- Kawasaki Heavy Industries Ltd. - Key offerings
- Kawasaki Heavy Industries Ltd. - Segment focus
- SWOT
- 15.8 Mahindra and Mahindra Ltd.
- Mahindra and Mahindra Ltd. - Overview
- Mahindra and Mahindra Ltd. - Business segments
- Mahindra and Mahindra Ltd. - Key news
- Mahindra and Mahindra Ltd. - Key offerings
- Mahindra and Mahindra Ltd. - Segment focus
- SWOT
- 15.9 Nebula Automotive Pvt. Ltd.
- Nebula Automotive Pvt. Ltd. - Overview
- Nebula Automotive Pvt. Ltd. - Product / Service
- Nebula Automotive Pvt. Ltd. - Key offerings
- SWOT
- 15.10 Polaris Inc.
- Polaris Inc. - Overview
- Polaris Inc. - Business segments
- Polaris Inc. - Key news
- Polaris Inc. - Key offerings
- Polaris Inc. - Segment focus
- SWOT
- 15.11 SHERP
- SHERP - Overview
- SHERP - Business segments
- SHERP - Key offerings
- SHERP - Segment focus
- SWOT
- 15.12 Suzuki Motor Corp.
- Suzuki Motor Corp. - Overview
- Suzuki Motor Corp. - Business segments
- Suzuki Motor Corp. - Key offerings
- Suzuki Motor Corp. - Segment focus
- SWOT
- 15.13 Taiwan Golden Bee Co. Ltd.
- Taiwan Golden Bee Co. Ltd. - Overview
- Taiwan Golden Bee Co. Ltd. - Product / Service
- Taiwan Golden Bee Co. Ltd. - Key offerings
- SWOT
- 15.14 Tao Motor Inc.
- Tao Motor Inc. - Overview
- Tao Motor Inc. - Product / Service
- Tao Motor Inc. - Key offerings
- SWOT
- 15.15 Textron Inc.
- Textron Inc. - Overview
- Textron Inc. - Business segments
- Textron Inc. - Key offerings
- Textron Inc. - Segment focus
- SWOT
- 15.16 TOMCAR
- TOMCAR - Overview
- TOMCAR - Business segments
- TOMCAR - Key offerings
- TOMCAR - Segment focus
- SWOT
- 15.17 Yamaha Motor Co. Ltd.
- Yamaha Motor Co. Ltd. - Overview
- Yamaha Motor Co. Ltd. - Business segments
- Yamaha Motor Co. Ltd. - Key offerings
- Yamaha Motor Co. Ltd. - Segment focus
- SWOT
- 15.18 ZHEJIANG CFMOTO POWER Co. Ltd.
- ZHEJIANG CFMOTO POWER Co. Ltd. - Overview
- ZHEJIANG CFMOTO POWER Co. Ltd. - Product / Service
- ZHEJIANG CFMOTO POWER Co. Ltd. - Key offerings
- SWOT
16 Appendix
- 16.1 Scope of the report
- 16.2 Inclusions and exclusions checklist
- Inclusions checklist
- Exclusions checklist
- 16.3 Currency conversion rates for US$
- Currency conversion rates for US$
- 16.4 Research methodology
- Research methodology
- 16.5 Data procurement
- Information sources
- 16.6 Data validation
- Data validation
- 16.7 Validation techniques employed for market sizing
- Validation techniques employed for market sizing
- 16.8 Data synthesis
- Data synthesis
- 16.9 360 degree market analysis
- 360 degree market analysis
- 16.10 List of abbreviations
- List of abbreviations
