|
|
市場調査レポート
商品コード
1502188
日焼け後ケア製品の世界市場 2024-2028Global after sunburn care products market 2024-2028 |
||||||
|
|||||||
カスタマイズ可能
|
|||||||

| 日焼け後ケア製品の世界市場 2024-2028 |
|
出版日: 2024年05月31日
発行: TechNavio
ページ情報: 英文 164 Pages
納期: 即納可能
|

全表示
- 概要
- 図表
- 目次
Technavio社は、日焼け後ケア製品市場をモニターしており、2023年から2028年にかけて5億3,020万米ドル、予測期間中のCAGRは6.34%で成長すると予測しています。
当レポートでは、日焼け後ケア製品市場の全体的な分析、市場規模・予測、動向、成長促進要因、課題、約25のベンダーを網羅したベンダー分析などを掲載しています。
現在の市場シナリオ、最新動向と促進要因、市場環境全体に関する最新分析を提供しています。市場は、地球温暖化による紫外線への曝露による悪影響、特定の薬剤による有害な日光や熱への影響、多機能日焼け後ケア製品の採用拡大などが牽引しています。
| 市場範囲 | |
|---|---|
| 基準年 | 2024 |
| 終了年 | 2028 |
| 予測期間 | 2024-2028 |
| 成長モメンタム | 加速 |
| 前年比2024年 | 5.86% |
| CAGR | 6.34% |
| 増分額 | 5億3,020万米ドル |
本調査では、今後数年間の日焼け後ケア製品市場成長を牽引する主な要因の一つとして、天然素材やオーガニック製品の注目度が高まっていることを挙げています。また、日焼け後ケア製品における薬用成分の応用の増加や、ラベリングやパッケージ開発の改善が、市場の大きな需要につながると思われます。
目次
第1章 エグゼクティブサマリー
- 市場概要
第2章 市場情勢
- 市場エコシステム
- 市場の特徴
- バリューチェーン分析
第3章 市場規模の評価
- 市場の定義
- 市場セグメント分析
- 市場規模 2023
- 市場の見通し 2023-2028
第4章 市場規模実績
- 世界日焼け後ケア製品市場 2018-2022
- 製品別セグメント分析 2018-2022
- 流通チャネル別セグメント分析 2018-2022
- 地域別セグメント分析 2018-2022
- 国別セグメント分析 2018-2022
第5章 ファイブフォース分析
- ファイブフォースの要約
- 買い手の交渉力
- 供給企業の交渉力
- 新規参入業者の脅威
- 代替品の脅威
- 競争の脅威
- 市況
第6章 市場セグメンテーション:製品別
- 市場セグメンテーション
- 比較:製品別
- ローション:市場規模と予測 2023-2028
- ゲル:市場規模と予測 2023-2028
- スプレー:市場規模と予測 2023-2028
- 市場機会:製品別
第7章 市場セグメンテーション:流通チャネル別
- 市場セグメンテーション
- 比較:流通チャネル別
- オフライン:市場規模と予測 2023-2028
- オンライン:市場規模と予測 2023-2028
- 市場機会:流通チャネル別
第8章 顧客情勢
- 顧客情勢の概要
第9章 地域別情勢
- 地域別セグメンテーション
- 地域別比較
- 欧州:市場規模と予測 2023-2028
- 北米:市場規模と予測 2023-2028
- アジア太平洋:市場規模と予測 2023-2028
- 中東・アフリカ:市場規模と予測 2023-2028
- 南米:市場規模と予測 2023-2028
- 米国:市場規模と予測 2023-2028
- ドイツ:市場規模と予測 2023-2028
- 中国:市場規模と予測 2023-2028
- フランス:市場規模と予測 2023-2028
- 日本:市場規模と予測 2023-2028
- 市場機会:地域別
第10章 促進要因・課題・機会・抑制要因
- 市場促進要因
- 市場の課題
- 促進要因と課題の影響
- 市場の機会・抑制要因
第11章 競合情勢
- 概要
- 競合情勢
- 混乱の状況
- 業界のリスク
第12章 競合分析
- 企業プロファイル
- 企業の市場ポジショニング
- Australian Gold.
- Bare Republic LLC
- Boiron SA
- CAREN
- Clarins USA Inc.
- Conde Nast
- Edgewell Personal Care Co.
- Fruit of the Earth
- Green Leaf
- InstaNatural
- maxingvest AG
- MOROCCANOIL
- Pierre Fabre SA
- Sun Bum LLC
- The Estee Lauder Companies Inc.
第13章 付録
Exhibits:
- Exhibits1: Executive Summary - Chart on Market Overview
- Exhibits2: Executive Summary - Data Table on Market Overview
- Exhibits3: Executive Summary - Chart on Global Market Characteristics
- Exhibits4: Executive Summary - Chart on Market by Geography
- Exhibits5: Executive Summary - Chart on Market Segmentation by Product
- Exhibits6: Executive Summary - Chart on Market Segmentation by Distribution Channel
- Exhibits7: Executive Summary - Chart on Incremental Growth
- Exhibits8: Executive Summary - Data Table on Incremental Growth
- Exhibits9: Executive Summary - Chart on Company Market Positioning
- Exhibits10: Parent Market
- Exhibits11: Data Table on - Parent Market
- Exhibits12: Market characteristics analysis
- Exhibits13: Value Chain Analysis
- Exhibits14: Offerings of companies included in the market definition
- Exhibits15: Market segments
- Exhibits16: Chart on Global - Market size and forecast 2023-2028 ($ million)
- Exhibits17: Data Table on Global - Market size and forecast 2023-2028 ($ million)
- Exhibits18: Chart on Global Market: Year-over-year growth 2023-2028 (%)
- Exhibits19: Data Table on Global Market: Year-over-year growth 2023-2028 (%)
- Exhibits20: Historic Market Size - Data Table on Global After Sunburn Care Products Market 2018 - 2022 ($ million)
- Exhibits21: Historic Market Size - Product Segment 2018 - 2022 ($ million)
- Exhibits22: Historic Market Size - Distribution Channel Segment 2018 - 2022 ($ million)
- Exhibits23: Historic Market Size - Geography Segment 2018 - 2022 ($ million)
- Exhibits24: Historic Market Size - Country Segment 2018 - 2022 ($ million)
- Exhibits25: Five forces analysis - Comparison between 2023 and 2028
- Exhibits26: Bargaining power of buyers - Impact of key factors 2023 and 2028
- Exhibits27: Bargaining power of suppliers - Impact of key factors in 2023 and 2028
- Exhibits28: Threat of new entrants - Impact of key factors in 2023 and 2028
- Exhibits29: Threat of substitutes - Impact of key factors in 2023 and 2028
- Exhibits30: Threat of rivalry - Impact of key factors in 2023 and 2028
- Exhibits31: Chart on Market condition - Five forces 2023 and 2028
- Exhibits32: Chart on Product - Market share 2023-2028 (%)
- Exhibits33: Data Table on Product - Market share 2023-2028 (%)
- Exhibits34: Chart on Comparison by Product
- Exhibits35: Data Table on Comparison by Product
- Exhibits36: Chart on Lotion - Market size and forecast 2023-2028 ($ million)
- Exhibits37: Data Table on Lotion - Market size and forecast 2023-2028 ($ million)
- Exhibits38: Chart on Lotion - Year-over-year growth 2023-2028 (%)
- Exhibits39: Data Table on Lotion - Year-over-year growth 2023-2028 (%)
- Exhibits40: Chart on Gel - Market size and forecast 2023-2028 ($ million)
- Exhibits41: Data Table on Gel - Market size and forecast 2023-2028 ($ million)
- Exhibits42: Chart on Gel - Year-over-year growth 2023-2028 (%)
- Exhibits43: Data Table on Gel - Year-over-year growth 2023-2028 (%)
- Exhibits44: Chart on Spray - Market size and forecast 2023-2028 ($ million)
- Exhibits45: Data Table on Spray - Market size and forecast 2023-2028 ($ million)
- Exhibits46: Chart on Spray - Year-over-year growth 2023-2028 (%)
- Exhibits47: Data Table on Spray - Year-over-year growth 2023-2028 (%)
- Exhibits48: Market opportunity by Product ($ million)
- Exhibits49: Data Table on Market opportunity by Product ($ million)
- Exhibits50: Chart on Distribution Channel - Market share 2023-2028 (%)
- Exhibits51: Data Table on Distribution Channel - Market share 2023-2028 (%)
- Exhibits52: Chart on Comparison by Distribution Channel
- Exhibits53: Data Table on Comparison by Distribution Channel
- Exhibits54: Chart on Offline - Market size and forecast 2023-2028 ($ million)
- Exhibits55: Data Table on Offline - Market size and forecast 2023-2028 ($ million)
- Exhibits56: Chart on Offline - Year-over-year growth 2023-2028 (%)
- Exhibits57: Data Table on Offline - Year-over-year growth 2023-2028 (%)
- Exhibits58: Chart on Online - Market size and forecast 2023-2028 ($ million)
- Exhibits59: Data Table on Online - Market size and forecast 2023-2028 ($ million)
- Exhibits60: Chart on Online - Year-over-year growth 2023-2028 (%)
- Exhibits61: Data Table on Online - Year-over-year growth 2023-2028 (%)
- Exhibits62: Market opportunity by Distribution Channel ($ million)
- Exhibits63: Data Table on Market opportunity by Distribution Channel ($ million)
- Exhibits64: Analysis of price sensitivity, lifecycle, customer purchase basket, adoption rates, and purchase criteria
- Exhibits65: Chart on Market share By Geographical Landscape2023-2028 (%)
- Exhibits66: Data Table on Market share By Geographical Landscape2023-2028 (%)
- Exhibits67: Chart on Geographic comparison
- Exhibits68: Data Table on Geographic comparison
- Exhibits69: Chart on Europe - Market size and forecast 2023-2028 ($ million)
- Exhibits70: Data Table on Europe - Market size and forecast 2023-2028 ($ million)
- Exhibits71: Chart on Europe - Year-over-year growth 2023-2028 (%)
- Exhibits72: Data Table on Europe - Year-over-year growth 2023-2028 (%)
- Exhibits73: Chart on North America - Market size and forecast 2023-2028 ($ million)
- Exhibits74: Data Table on North America - Market size and forecast 2023-2028 ($ million)
- Exhibits75: Chart on North America - Year-over-year growth 2023-2028 (%)
- Exhibits76: Data Table on North America - Year-over-year growth 2023-2028 (%)
- Exhibits77: Chart on APAC - Market size and forecast 2023-2028 ($ million)
- Exhibits78: Data Table on APAC - Market size and forecast 2023-2028 ($ million)
- Exhibits79: Chart on APAC - Year-over-year growth 2023-2028 (%)
- Exhibits80: Data Table on APAC - Year-over-year growth 2023-2028 (%)
- Exhibits81: Chart on Middle East and Africa - Market size and forecast 2023-2028 ($ million)
- Exhibits82: Data Table on Middle East and Africa - Market size and forecast 2023-2028 ($ million)
- Exhibits83: Chart on Middle East and Africa - Year-over-year growth 2023-2028 (%)
- Exhibits84: Data Table on Middle East and Africa - Year-over-year growth 2023-2028 (%)
- Exhibits85: Chart on South America - Market size and forecast 2023-2028 ($ million)
- Exhibits86: Data Table on South America - Market size and forecast 2023-2028 ($ million)
- Exhibits87: Chart on South America - Year-over-year growth 2023-2028 (%)
- Exhibits88: Data Table on South America - Year-over-year growth 2023-2028 (%)
- Exhibits89: Chart on US - Market size and forecast 2023-2028 ($ million)
- Exhibits90: Data Table on US - Market size and forecast 2023-2028 ($ million)
- Exhibits91: Chart on US - Year-over-year growth 2023-2028 (%)
- Exhibits92: Data Table on US - Year-over-year growth 2023-2028 (%)
- Exhibits93: Chart on Germany - Market size and forecast 2023-2028 ($ million)
- Exhibits94: Data Table on Germany - Market size and forecast 2023-2028 ($ million)
- Exhibits95: Chart on Germany - Year-over-year growth 2023-2028 (%)
- Exhibits96: Data Table on Germany - Year-over-year growth 2023-2028 (%)
- Exhibits97: Chart on China - Market size and forecast 2023-2028 ($ million)
- Exhibits98: Data Table on China - Market size and forecast 2023-2028 ($ million)
- Exhibits99: Chart on China - Year-over-year growth 2023-2028 (%)
- Exhibits100: Data Table on China - Year-over-year growth 2023-2028 (%)
- Exhibits101: Chart on France - Market size and forecast 2023-2028 ($ million)
- Exhibits102: Data Table on France - Market size and forecast 2023-2028 ($ million)
- Exhibits103: Chart on France - Year-over-year growth 2023-2028 (%)
- Exhibits104: Data Table on France - Year-over-year growth 2023-2028 (%)
- Exhibits105: Chart on Japan - Market size and forecast 2023-2028 ($ million)
- Exhibits106: Data Table on Japan - Market size and forecast 2023-2028 ($ million)
- Exhibits107: Chart on Japan - Year-over-year growth 2023-2028 (%)
- Exhibits108: Data Table on Japan - Year-over-year growth 2023-2028 (%)
- Exhibits109: Market opportunity By Geographical Landscape($ million)
- Exhibits110: Data Tables on Market opportunity By Geographical Landscape($ million)
- Exhibits111: Impact of drivers and challenges in 2023 and 2028
- Exhibits112: Overview on criticality of inputs and factors of differentiation
- Exhibits113: Overview on factors of disruption
- Exhibits114: Impact of key risks on business
- Exhibits115: Companies covered
- Exhibits116: Matrix on companies position and classification
- Exhibits117: Australian Gold. - Overview
- Exhibits118: Australian Gold. - Product / Service
- Exhibits119: Australian Gold. - Key offerings
- Exhibits120: Bare Republic LLC - Overview
- Exhibits121: Bare Republic LLC - Product / Service
- Exhibits122: Bare Republic LLC - Key offerings
- Exhibits123: Boiron SA - Overview
- Exhibits124: Boiron SA - Business segments
- Exhibits125: Boiron SA - Key offerings
- Exhibits126: Boiron SA - Segment focus
- Exhibits127: CAREN - Overview
- Exhibits128: CAREN - Product / Service
- Exhibits129: CAREN - Key offerings
- Exhibits130: Clarins USA Inc. - Overview
- Exhibits131: Clarins USA Inc. - Product / Service
- Exhibits132: Clarins USA Inc. - Key offerings
- Exhibits133: Conde Nast - Overview
- Exhibits134: Conde Nast - Product / Service
- Exhibits135: Conde Nast - Key offerings
- Exhibits136: Edgewell Personal Care Co. - Overview
- Exhibits137: Edgewell Personal Care Co. - Business segments
- Exhibits138: Edgewell Personal Care Co. - Key news
- Exhibits139: Edgewell Personal Care Co. - Key offerings
- Exhibits140: Edgewell Personal Care Co. - Segment focus
- Exhibits141: Fruit of the Earth - Overview
- Exhibits142: Fruit of the Earth - Product / Service
- Exhibits143: Fruit of the Earth - Key offerings
- Exhibits144: Green Leaf - Overview
- Exhibits145: Green Leaf - Product / Service
- Exhibits146: Green Leaf - Key offerings
- Exhibits147: InstaNatural - Overview
- Exhibits148: InstaNatural - Product / Service
- Exhibits149: InstaNatural - Key offerings
- Exhibits150: maxingvest AG - Overview
- Exhibits151: maxingvest AG - Product / Service
- Exhibits152: maxingvest AG - Key offerings
- Exhibits153: MOROCCANOIL - Overview
- Exhibits154: MOROCCANOIL - Product / Service
- Exhibits155: MOROCCANOIL - Key offerings
- Exhibits156: Pierre Fabre SA - Overview
- Exhibits157: Pierre Fabre SA - Product / Service
- Exhibits158: Pierre Fabre SA - Key offerings
- Exhibits159: Sun Bum LLC - Overview
- Exhibits160: Sun Bum LLC - Product / Service
- Exhibits161: Sun Bum LLC - Key offerings
- Exhibits162: The Estee Lauder Companies Inc. - Overview
- Exhibits163: The Estee Lauder Companies Inc. - Product / Service
- Exhibits164: The Estee Lauder Companies Inc. - Key news
- Exhibits165: The Estee Lauder Companies Inc. - Key offerings
- Exhibits166: Inclusions checklist
- Exhibits167: Exclusions checklist
- Exhibits168: Currency conversion rates for US$
- Exhibits169: Research methodology
- Exhibits170: Information sources
- Exhibits171: Data validation
- Exhibits172: Validation techniques employed for market sizing
- Exhibits173: Data synthesis
- Exhibits174: 360 degree market analysis
- Exhibits175: List of abbreviations
Technavio has been monitoring the after sunburn care products market and is forecast to grow by USD 530.2 mn during 2023-2028, accelerating at a CAGR of 6.34% during the forecast period. Our report on the after sunburn care products market provides a holistic analysis, market size and forecast, trends, growth drivers, and challenges, as well as vendor analysis covering around 25 vendors.
The report offers an up-to-date analysis regarding the current market scenario, the latest trends and drivers, and the overall market environment. The market is driven by adverse effects of exposure to uv radiation caused by global warming, harmful sun and heat effects due to certain medications, and growing adoption of multifunctional after sunburn care products.
Technavio's after sunburn care products market is segmented as below:
| Market Scope | |
|---|---|
| Base Year | 2024 |
| End Year | 2028 |
| Series Year | 2024-2028 |
| Growth Momentum | Accelerate |
| YOY 2024 | 5.86% |
| CAGR | 6.34% |
| Incremental Value | $530.2mn |
By Product
- Lotion
- Gel
- Spray
By Distribution Channel
- Offline
- Online
By Geography
- Europe
- North America
- APAC
- Middle East and Africa
- South America
This study identifies the growing prominence of natural and organic products as one of the prime reasons driving the after sunburn care products market growth during the next few years. Also, increased application of medicinal ingredients in after sunburn care products and improvements in labeling and packaging developments will lead to sizable demand in the market.
Technavio presents a detailed picture of the market by the way of study, synthesis, and summation of data from multiple sources by an analysis of key parameters. Our report on the after sunburn care products market covers the following areas:
- After sunburn care products market sizing
- After sunburn care products market forecast
- After sunburn care products market industry analysis
Technavio's robust vendor analysis is designed to help clients improve their market position, and in line with this, this report provides a detailed analysis of several leading after sunburn care products market vendors that include Australian Gold., Bare Republic LLC, Body Cupid, Boiron SA, CAREN, Clarins USA Inc., Conde Nast, Edgewell Personal Care Co., Fruit of the Earth, Green Leaf, InstaNatural, maxingvest AG, MOROCCANOIL, Pierre Fabre SA, plum, Quest Products LLC, Seven Minerals, Shiseido Co. Ltd., Sun Bum LLC, and The Estee Lauder Companies Inc.. Also, the after sunburn care products market analysis report includes information on upcoming trends and challenges that will influence market growth. This is to help companies strategize and leverage all forthcoming growth opportunities.
The study was conducted using an objective combination of primary and secondary information including inputs from key participants in the industry. The report contains a comprehensive market and vendor landscape in addition to an analysis of the key vendors.
Technavio presents a detailed picture of the market by the way of study, synthesis, and summation of data from multiple sources by an analysis of key parameters such as profit, pricing, competition, and promotions. It presents various market facets by identifying the key industry influencers. The data presented is comprehensive, reliable, and a result of extensive research - both primary and secondary. Technavio's market research reports provide a complete competitive landscape and an in-depth vendor selection methodology and analysis using qualitative and quantitative research to forecast accurate market growth.
Table of Contents
1 Executive Summary
- 1.1 Market overview
- Executive Summary - Chart on Market Overview
- Executive Summary - Data Table on Market Overview
- Executive Summary - Chart on Global Market Characteristics
- Executive Summary - Chart on Market by Geography
- Executive Summary - Chart on Market Segmentation by Product
- Executive Summary - Chart on Market Segmentation by Distribution Channel
- Executive Summary - Chart on Incremental Growth
- Executive Summary - Data Table on Incremental Growth
- Executive Summary - Chart on Company Market Positioning
2 Market Landscape
- 2.1 Market ecosystem
- Parent Market
- Data Table on - Parent Market
- 2.2 Market characteristics
- Market characteristics analysis
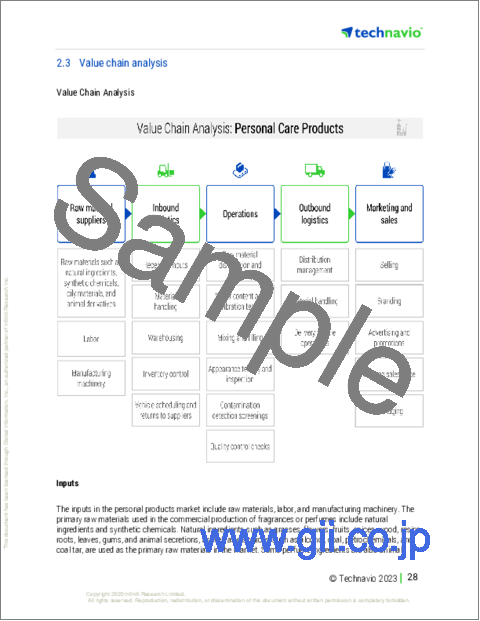
- 2.3 Value chain analysis
- Value Chain Analysis
3 Market Sizing
- 3.1 Market definition
- Offerings of companies included in the market definition
- 3.2 Market segment analysis
- Market segments
- 3.3 Market size 2023
- 3.4 Market outlook: Forecast for 2023-2028
- Chart on Global - Market size and forecast 2023-2028 ($ million)
- Data Table on Global - Market size and forecast 2023-2028 ($ million)
- Chart on Global Market: Year-over-year growth 2023-2028 (%)
- Data Table on Global Market: Year-over-year growth 2023-2028 (%)
4 Historic Market Size
- 4.1 Global After Sunburn Care Products Market 2018 - 2022
- Historic Market Size - Data Table on Global After Sunburn Care Products Market 2018 - 2022 ($ million)
- 4.2 Product segment analysis 2018 - 2022
- Historic Market Size - Product Segment 2018 - 2022 ($ million)
- 4.3 Distribution Channel segment analysis 2018 - 2022
- Historic Market Size - Distribution Channel Segment 2018 - 2022 ($ million)
- 4.4 Geography segment analysis 2018 - 2022
- Historic Market Size - Geography Segment 2018 - 2022 ($ million)
- 4.5 Country segment analysis 2018 - 2022
- Historic Market Size - Country Segment 2018 - 2022 ($ million)
5 Five Forces Analysis
- 5.1 Five forces summary
- Five forces analysis - Comparison between 2023 and 2028
- 5.2 Bargaining power of buyers
- Bargaining power of buyers - Impact of key factors 2023 and 2028
- 5.3 Bargaining power of suppliers
- Bargaining power of suppliers - Impact of key factors in 2023 and 2028
- 5.4 Threat of new entrants
- Threat of new entrants - Impact of key factors in 2023 and 2028
- 5.5 Threat of substitutes
- Threat of substitutes - Impact of key factors in 2023 and 2028
- 5.6 Threat of rivalry
- Threat of rivalry - Impact of key factors in 2023 and 2028
- 5.7 Market condition
- Chart on Market condition - Five forces 2023 and 2028
6 Market Segmentation by Product
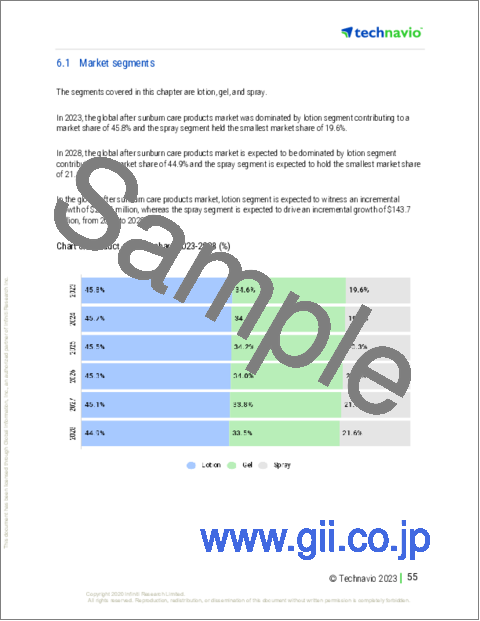
- 6.1 Market segments
- Chart on Product - Market share 2023-2028 (%)
- Data Table on Product - Market share 2023-2028 (%)
- 6.2 Comparison by Product
- Chart on Comparison by Product
- Data Table on Comparison by Product
- 6.3 Lotion - Market size and forecast 2023-2028
- Chart on Lotion - Market size and forecast 2023-2028 ($ million)
- Data Table on Lotion - Market size and forecast 2023-2028 ($ million)
- Chart on Lotion - Year-over-year growth 2023-2028 (%)
- Data Table on Lotion - Year-over-year growth 2023-2028 (%)
- 6.4 Gel - Market size and forecast 2023-2028
- Chart on Gel - Market size and forecast 2023-2028 ($ million)
- Data Table on Gel - Market size and forecast 2023-2028 ($ million)
- Chart on Gel - Year-over-year growth 2023-2028 (%)
- Data Table on Gel - Year-over-year growth 2023-2028 (%)
- 6.5 Spray - Market size and forecast 2023-2028
- Chart on Spray - Market size and forecast 2023-2028 ($ million)
- Data Table on Spray - Market size and forecast 2023-2028 ($ million)
- Chart on Spray - Year-over-year growth 2023-2028 (%)
- Data Table on Spray - Year-over-year growth 2023-2028 (%)
- 6.6 Market opportunity by Product
- Market opportunity by Product ($ million)
- Data Table on Market opportunity by Product ($ million)
7 Market Segmentation by Distribution Channel
- 7.1 Market segments
- Chart on Distribution Channel - Market share 2023-2028 (%)
- Data Table on Distribution Channel - Market share 2023-2028 (%)
- 7.2 Comparison by Distribution Channel
- Chart on Comparison by Distribution Channel
- Data Table on Comparison by Distribution Channel
- 7.3 Offline - Market size and forecast 2023-2028
- Chart on Offline - Market size and forecast 2023-2028 ($ million)
- Data Table on Offline - Market size and forecast 2023-2028 ($ million)
- Chart on Offline - Year-over-year growth 2023-2028 (%)
- Data Table on Offline - Year-over-year growth 2023-2028 (%)
- 7.4 Online - Market size and forecast 2023-2028
- Chart on Online - Market size and forecast 2023-2028 ($ million)
- Data Table on Online - Market size and forecast 2023-2028 ($ million)
- Chart on Online - Year-over-year growth 2023-2028 (%)
- Data Table on Online - Year-over-year growth 2023-2028 (%)
- 7.5 Market opportunity by Distribution Channel
- Market opportunity by Distribution Channel ($ million)
- Data Table on Market opportunity by Distribution Channel ($ million)
8 Customer Landscape
- 8.1 Customer landscape overview
- Analysis of price sensitivity, lifecycle, customer purchase basket, adoption rates, and purchase criteria
9 Geographic Landscape
- 9.1 Geographic segmentation
- Chart on Market share By Geographical Landscape2023-2028 (%)
- Data Table on Market share By Geographical Landscape2023-2028 (%)
- 9.2 Geographic comparison
- Chart on Geographic comparison
- Data Table on Geographic comparison
- 9.3 Europe - Market size and forecast 2023-2028
- Chart on Europe - Market size and forecast 2023-2028 ($ million)
- Data Table on Europe - Market size and forecast 2023-2028 ($ million)
- Chart on Europe - Year-over-year growth 2023-2028 (%)
- Data Table on Europe - Year-over-year growth 2023-2028 (%)
- 9.4 North America - Market size and forecast 2023-2028
- Chart on North America - Market size and forecast 2023-2028 ($ million)
- Data Table on North America - Market size and forecast 2023-2028 ($ million)
- Chart on North America - Year-over-year growth 2023-2028 (%)
- Data Table on North America - Year-over-year growth 2023-2028 (%)
- 9.5 APAC - Market size and forecast 2023-2028
- Chart on APAC - Market size and forecast 2023-2028 ($ million)
- Data Table on APAC - Market size and forecast 2023-2028 ($ million)
- Chart on APAC - Year-over-year growth 2023-2028 (%)
- Data Table on APAC - Year-over-year growth 2023-2028 (%)
- 9.6 Middle East and Africa - Market size and forecast 2023-2028
- Chart on Middle East and Africa - Market size and forecast 2023-2028 ($ million)
- Data Table on Middle East and Africa - Market size and forecast 2023-2028 ($ million)
- Chart on Middle East and Africa - Year-over-year growth 2023-2028 (%)
- Data Table on Middle East and Africa - Year-over-year growth 2023-2028 (%)
- 9.7 South America - Market size and forecast 2023-2028
- Chart on South America - Market size and forecast 2023-2028 ($ million)
- Data Table on South America - Market size and forecast 2023-2028 ($ million)
- Chart on South America - Year-over-year growth 2023-2028 (%)
- Data Table on South America - Year-over-year growth 2023-2028 (%)
- 9.8 US - Market size and forecast 2023-2028
- Chart on US - Market size and forecast 2023-2028 ($ million)
- Data Table on US - Market size and forecast 2023-2028 ($ million)
- Chart on US - Year-over-year growth 2023-2028 (%)
- Data Table on US - Year-over-year growth 2023-2028 (%)
- 9.9 Germany - Market size and forecast 2023-2028
- Chart on Germany - Market size and forecast 2023-2028 ($ million)
- Data Table on Germany - Market size and forecast 2023-2028 ($ million)
- Chart on Germany - Year-over-year growth 2023-2028 (%)
- Data Table on Germany - Year-over-year growth 2023-2028 (%)
- 9.10 China - Market size and forecast 2023-2028
- Chart on China - Market size and forecast 2023-2028 ($ million)
- Data Table on China - Market size and forecast 2023-2028 ($ million)
- Chart on China - Year-over-year growth 2023-2028 (%)
- Data Table on China - Year-over-year growth 2023-2028 (%)
- 9.11 France - Market size and forecast 2023-2028
- Chart on France - Market size and forecast 2023-2028 ($ million)
- Data Table on France - Market size and forecast 2023-2028 ($ million)
- Chart on France - Year-over-year growth 2023-2028 (%)
- Data Table on France - Year-over-year growth 2023-2028 (%)
- 9.12 Japan - Market size and forecast 2023-2028
- Chart on Japan - Market size and forecast 2023-2028 ($ million)
- Data Table on Japan - Market size and forecast 2023-2028 ($ million)
- Chart on Japan - Year-over-year growth 2023-2028 (%)
- Data Table on Japan - Year-over-year growth 2023-2028 (%)
- 9.13 Market opportunity by geography
- Market opportunity By Geographical Landscape($ million)
- Data Tables on Market opportunity By Geographical Landscape($ million)
10 Drivers, Challenges, and Opportunity/Restraints
- 10.1 Market drivers
- 10.2 Market challenges
- 10.3 Impact of drivers and challenges
- Impact of drivers and challenges in 2023 and 2028
- 10.4 Market opportunities/restraints
11 Competitive Landscape
- 11.1 Overview
- 11.2 Competitive Landscape
- Overview on criticality of inputs and factors of differentiation
- 11.3 Landscape disruption
- Overview on factors of disruption
- 11.4 Industry risks
- Impact of key risks on business
12 Competitive Analysis
- 12.1 Companies profiled
- Companies covered
- 12.2 Market positioning of companies
- Matrix on companies position and classification
- 12.3 Australian Gold.
- Australian Gold. - Overview
- Australian Gold. - Product / Service
- Australian Gold. - Key offerings
- 12.4 Bare Republic LLC
- Bare Republic LLC - Overview
- Bare Republic LLC - Product / Service
- Bare Republic LLC - Key offerings
- 12.5 Boiron SA
- Boiron SA - Overview
- Boiron SA - Business segments
- Boiron SA - Key offerings
- Boiron SA - Segment focus
- 12.6 CAREN
- CAREN - Overview
- CAREN - Product / Service
- CAREN - Key offerings
- 12.7 Clarins USA Inc.
- Clarins USA Inc. - Overview
- Clarins USA Inc. - Product / Service
- Clarins USA Inc. - Key offerings
- 12.8 Conde Nast
- Conde Nast - Overview
- Conde Nast - Product / Service
- Conde Nast - Key offerings
- 12.9 Edgewell Personal Care Co.
- Edgewell Personal Care Co. - Overview
- Edgewell Personal Care Co. - Business segments
- Edgewell Personal Care Co. - Key news
- Edgewell Personal Care Co. - Key offerings
- Edgewell Personal Care Co. - Segment focus
- 12.10 Fruit of the Earth
- Fruit of the Earth - Overview
- Fruit of the Earth - Product / Service
- Fruit of the Earth - Key offerings
- 12.11 Green Leaf
- Green Leaf - Overview
- Green Leaf - Product / Service
- Green Leaf - Key offerings
- 12.12 InstaNatural
- InstaNatural - Overview
- InstaNatural - Product / Service
- InstaNatural - Key offerings
- 12.13 maxingvest AG
- maxingvest AG - Overview
- maxingvest AG - Product / Service
- maxingvest AG - Key offerings
- 12.14 MOROCCANOIL
- MOROCCANOIL - Overview
- MOROCCANOIL - Product / Service
- MOROCCANOIL - Key offerings
- 12.15 Pierre Fabre SA
- Pierre Fabre SA - Overview
- Pierre Fabre SA - Product / Service
- Pierre Fabre SA - Key offerings
- 12.16 Sun Bum LLC
- Sun Bum LLC - Overview
- Sun Bum LLC - Product / Service
- Sun Bum LLC - Key offerings
- 12.17 The Estee Lauder Companies Inc.
- The Estee Lauder Companies Inc. - Overview
- The Estee Lauder Companies Inc. - Product / Service
- The Estee Lauder Companies Inc. - Key news
- The Estee Lauder Companies Inc. - Key offerings
13 Appendix
- 13.1 Scope of the report
- 13.2 Inclusions and exclusions checklist
- Inclusions checklist
- Exclusions checklist
- 13.3 Currency conversion rates for US$
- Currency conversion rates for US$
- 13.4 Research methodology
- Research methodology
- 13.5 Data procurement
- Information sources
- 13.6 Data validation
- Data validation
- 13.7 Validation techniques employed for market sizing
- Validation techniques employed for market sizing
- 13.8 Data synthesis
- Data synthesis
- 13.9 360 degree market analysis
- 360 degree market analysis
- 13.10 List of abbreviations
- List of abbreviations
