|
|
市場調査レポート
商品コード
1714139
水耕栽培技術の世界市場 2025-2029Global Hydroponics Technologies Market 2025-2029 |
||||||

|
|||||||
カスタマイズ可能
|
|||||||


| 水耕栽培技術の世界市場 2025-2029 |
|
出版日: 2025年04月15日
発行: TechNavio
ページ情報: 英文 234 Pages
納期: 即納可能
|

全表示
- 概要
- 図表
- 目次
水耕栽培技術市場は2024-2029年に8億7,050万米ドル、予測期間中のCAGRは17.9%で成長すると予測されます。
当レポートでは、水耕栽培技術市場の全体的な分析、市場規模・予測、動向、成長促進要因、課題、約25のベンダーを網羅したベンダー分析などを掲載しています。
現在の市場シナリオ、最新動向と促進要因、市場環境全体に関する最新分析を提供しています。市場は、省土壌・省スペースの促進、土壌・水質汚染削減のニーズ、認証製品の提供増加によって牽引されています。
| 市場範囲 | |
|---|---|
| 基準年 | 2025 |
| 終了年 | 2029 |
| 予測期間 | 2025-2029 |
| 成長モメンタム | 加速 |
| 前年比2025年 | 14.7% |
| CAGR | 17.9% |
| 増分額 | 8億7,050万米ドル |
本調査は、業界の主要参加者からのインプットを含め、一次情報と二次情報を客観的に組み合わせて実施しました。レポートには、主要企業の分析に加え、包括的な市場規模データ、地域分析によるセグメント、ベンダー情勢が含まれています。レポートには過去データと予測データがあります。
本調査では、今後数年間の水耕栽培技術市場の成長を促進する主な理由の一つとして、高度な水耕栽培システムの提供増加を挙げています。また、水耕栽培技術では、エネルギー効率の高いLED栽培ライトの発売や自動化の利用が増加しており、市場の大きな需要につながると考えられます。
目次
第1章 エグゼクティブサマリー
- 市場概要
第2章 Technavio分析
- 価格・ライフサイクル・顧客購入バスケット・採用率・購入基準の分析
- インプットの重要性と差別化の要因
- 混乱の要因
- 促進要因と課題の影響
第3章 市場情勢
- 市場エコシステム
- 市場の特徴
- バリューチェーン分析
第4章 市場規模
- 市場の定義
- 市場セグメント分析
- 市場規模 2024
- 市場の見通し 2024-2029
第5章 市場規模実績
- 水耕栽培技術の世界市場 2019-2023
- 技術セグメント分析 2019-2023
- タイプセグメント分析 2019-2023
- 方法セグメント分析 2019-2023
- 作物タイプセグメント分析 2019-2023
- 地域別セグメント分析 2019-2023
- 国別セグメント分析 2019-2023
第6章 定性分析
- AIの影響:水耕栽培技術の世界市場
第7章 ファイブフォース分析
- ファイブフォースの要約
- 買い手の交渉力
- 供給企業の交渉力
- 新規参入業者の脅威
- 代替品の脅威
- 競争の脅威
- 市況
第8章 市場セグメンテーション:技術別
- 市場セグメント
- 比較:技術別
- 環境および気候制御システム:市場規模と予測 2024-2029
- 栽培用ライト:市場規模と予測 2024-2029
- 農場管理システム:市場規模と予測 2024-2029
- マテリアルハンドリングシステム:市場規模と予測 2024-2029
- 市場機会:技術別
第9章 市場セグメンテーション:タイプ別
- 市場セグメント
- 比較:タイプ別
- 集約システム:市場規模と予測 2024-2029
- 液体システム:市場規模と予測 2024-2029
- 市場機会:タイプ別
第10章 市場セグメンテーション:方法別
- 市場セグメント
- 比較:方法別
- 屋内:市場規模と予測 2024-2029
- 屋外:市場規模と予測 2024-2029
- 市場機会:方法別
第11章 市場セグメンテーション:作物タイプ別
- 市場セグメント
- 比較:作物タイプ別
- 野菜:市場規模と予測 2024-2029
- 果物:市場規模と予測 2024-2029
- 花:市場規模と予測 2024-2029
- 市場機会:作物タイプ別
第12章 顧客情勢
- 顧客情勢の概要
第13章 地域別情勢
- 地域別セグメンテーション
- 地域別比較
- 欧州:市場規模と予測 2024-2029
- アジア太平洋:市場規模と予測 2024-2029
- 北米:市場規模と予測 2024-2029
- 南米:市場規模と予測 2024-2029
- 中東・アフリカ:市場規模と予測 2024-2029
- 米国:市場規模と予測 2024-2029
- オランダ:市場規模と予測 2024-2029
- 日本:市場規模と予測 2024-2029
- 中国:市場規模と予測 2024-2029
- スペイン:市場規模と予測 2024-2029
- インド:市場規模と予測 2024-2029
- カナダ:市場規模と予測 2024-2029
- イタリア:市場規模と予測 2024-2029
- ドイツ:市場規模と予測 2024-2029
- 韓国:市場規模と予測 2024-2029
- 市場機会:地域情勢別
第14章 促進要因・課題・機会・抑制要因
- 市場促進要因
- 市場の課題
- 促進要因と課題の影響
- 市場の機会・抑制要因
第15章 競合情勢
- 概要
- 競合情勢
- 混乱の状況
- 業界のリスク
第16章 競合分析
- 企業プロファイル
- 企業ランキング指数
- 企業の市場ポジショニング
- AmHydro
- Argus Control Systems Ltd.
- BrightFarms Inc.
- Fork Farms
- Greentech Organic Hydroponics Systems
- GrowLife Inc.
- Hawthorne Gardening Co.
- Hortisystems UK Ltd.
- Hydrodynamics International Inc.
- Koninklijke Philips NV
- KUBO TUINBOUWPROJECTEN BV
- LOGIQS B.V.
- TERRATECH
- Thanet Earth Ltd.
- Village Farms International Inc.
第17章 付録
Exhibits:
- Exhibits1: Executive Summary - Chart on Market Overview
- Exhibits2: Executive Summary - Data Table on Market Overview
- Exhibits3: Executive Summary - Chart on Global Market Characteristics
- Exhibits4: Executive Summary - Chart on Market By Geographical Landscape
- Exhibits5: Executive Summary - Chart on Market Segmentation by Technology
- Exhibits6: Executive Summary - Chart on Market Segmentation by Type
- Exhibits7: Executive Summary - Chart on Market Segmentation by Method
- Exhibits8: Executive Summary - Chart on Market Segmentation by Crop Type
- Exhibits9: Executive Summary - Chart on Incremental Growth
- Exhibits10: Executive Summary - Data Table on Incremental Growth
- Exhibits11: Executive Summary - Chart on Company Market Positioning
- Exhibits12: Analysis of price sensitivity, lifecycle, customer purchase basket, adoption rates, and purchase criteria
- Exhibits13: Overview on criticality of inputs and factors of differentiation
- Exhibits14: Overview on factors of disruption
- Exhibits15: Impact of drivers and challenges in 2024 and 2029
- Exhibits16: Parent Market
- Exhibits17: Data Table on - Parent Market
- Exhibits18: Market characteristics analysis
- Exhibits19: Value chain analysis
- Exhibits20: Offerings of companies included in the market definition
- Exhibits21: Market segments
- Exhibits22: Chart on Global - Market size and forecast 2024-2029 ($ million)
- Exhibits23: Data Table on Global - Market size and forecast 2024-2029 ($ million)
- Exhibits24: Chart on Global Market: Year-over-year growth 2024-2029 (%)
- Exhibits25: Data Table on Global Market: Year-over-year growth 2024-2029 (%)
- Exhibits26: Historic Market Size - Data Table on Global Hydroponics Technologies Market 2019 - 2023 ($ million)
- Exhibits27: Historic Market Size - Technology Segment 2019 - 2023 ($ million)
- Exhibits28: Historic Market Size - Type Segment 2019 - 2023 ($ million)
- Exhibits29: Historic Market Size - Method Segment 2019 - 2023 ($ million)
- Exhibits30: Historic Market Size - Crop Type Segment 2019 - 2023 ($ million)
- Exhibits31: Historic Market Size - Geography Segment 2019 - 2023 ($ million)
- Exhibits32: Historic Market Size - Country Segment 2019 - 2023 ($ million)
- Exhibits33: Five forces analysis - Comparison between 2024 and 2029
- Exhibits34: Bargaining power of buyers - Impact of key factors 2024 and 2029
- Exhibits35: Bargaining power of suppliers - Impact of key factors in 2024 and 2029
- Exhibits36: Threat of new entrants - Impact of key factors in 2024 and 2029
- Exhibits37: Threat of substitutes - Impact of key factors in 2024 and 2029
- Exhibits38: Threat of rivalry - Impact of key factors in 2024 and 2029
- Exhibits39: Chart on Market condition - Five forces 2024 and 2029
- Exhibits40: Chart on Technology - Market share 2024-2029 (%)
- Exhibits41: Data Table on Technology - Market share 2024-2029 (%)
- Exhibits42: Chart on Comparison by Technology
- Exhibits43: Data Table on Comparison by Technology
- Exhibits44: Chart on Environment and climate control systems - Market size and forecast 2024-2029 ($ million)
- Exhibits45: Data Table on Environment and climate control systems - Market size and forecast 2024-2029 ($ million)
- Exhibits46: Chart on Environment and climate control systems - Year-over-year growth 2024-2029 (%)
- Exhibits47: Data Table on Environment and climate control systems - Year-over-year growth 2024-2029 (%)
- Exhibits48: Chart on Grow lights - Market size and forecast 2024-2029 ($ million)
- Exhibits49: Data Table on Grow lights - Market size and forecast 2024-2029 ($ million)
- Exhibits50: Chart on Grow lights - Year-over-year growth 2024-2029 (%)
- Exhibits51: Data Table on Grow lights - Year-over-year growth 2024-2029 (%)
- Exhibits52: Chart on Farm management systems - Market size and forecast 2024-2029 ($ million)
- Exhibits53: Data Table on Farm management systems - Market size and forecast 2024-2029 ($ million)
- Exhibits54: Chart on Farm management systems - Year-over-year growth 2024-2029 (%)
- Exhibits55: Data Table on Farm management systems - Year-over-year growth 2024-2029 (%)
- Exhibits56: Chart on Material handling systems - Market size and forecast 2024-2029 ($ million)
- Exhibits57: Data Table on Material handling systems - Market size and forecast 2024-2029 ($ million)
- Exhibits58: Chart on Material handling systems - Year-over-year growth 2024-2029 (%)
- Exhibits59: Data Table on Material handling systems - Year-over-year growth 2024-2029 (%)
- Exhibits60: Market opportunity by Technology ($ million)
- Exhibits61: Data Table on Market opportunity by Technology ($ million)
- Exhibits62: Chart on Type - Market share 2024-2029 (%)
- Exhibits63: Data Table on Type - Market share 2024-2029 (%)
- Exhibits64: Chart on Comparison by Type
- Exhibits65: Data Table on Comparison by Type
- Exhibits66: Chart on Aggregate system - Market size and forecast 2024-2029 ($ million)
- Exhibits67: Data Table on Aggregate system - Market size and forecast 2024-2029 ($ million)
- Exhibits68: Chart on Aggregate system - Year-over-year growth 2024-2029 (%)
- Exhibits69: Data Table on Aggregate system - Year-over-year growth 2024-2029 (%)
- Exhibits70: Chart on Liquid system - Market size and forecast 2024-2029 ($ million)
- Exhibits71: Data Table on Liquid system - Market size and forecast 2024-2029 ($ million)
- Exhibits72: Chart on Liquid system - Year-over-year growth 2024-2029 (%)
- Exhibits73: Data Table on Liquid system - Year-over-year growth 2024-2029 (%)
- Exhibits74: Market opportunity by Type ($ million)
- Exhibits75: Data Table on Market opportunity by Type ($ million)
- Exhibits76: Chart on Method - Market share 2024-2029 (%)
- Exhibits77: Data Table on Method - Market share 2024-2029 (%)
- Exhibits78: Chart on Comparison by Method
- Exhibits79: Data Table on Comparison by Method
- Exhibits80: Chart on Indoor - Market size and forecast 2024-2029 ($ million)
- Exhibits81: Data Table on Indoor - Market size and forecast 2024-2029 ($ million)
- Exhibits82: Chart on Indoor - Year-over-year growth 2024-2029 (%)
- Exhibits83: Data Table on Indoor - Year-over-year growth 2024-2029 (%)
- Exhibits84: Chart on Outdoor - Market size and forecast 2024-2029 ($ million)
- Exhibits85: Data Table on Outdoor - Market size and forecast 2024-2029 ($ million)
- Exhibits86: Chart on Outdoor - Year-over-year growth 2024-2029 (%)
- Exhibits87: Data Table on Outdoor - Year-over-year growth 2024-2029 (%)
- Exhibits88: Market opportunity by Method ($ million)
- Exhibits89: Data Table on Market opportunity by Method ($ million)
- Exhibits90: Chart on Crop Type - Market share 2024-2029 (%)
- Exhibits91: Data Table on Crop Type - Market share 2024-2029 (%)
- Exhibits92: Chart on Comparison by Crop Type
- Exhibits93: Data Table on Comparison by Crop Type
- Exhibits94: Chart on Vegetables - Market size and forecast 2024-2029 ($ million)
- Exhibits95: Data Table on Vegetables - Market size and forecast 2024-2029 ($ million)
- Exhibits96: Chart on Vegetables - Year-over-year growth 2024-2029 (%)
- Exhibits97: Data Table on Vegetables - Year-over-year growth 2024-2029 (%)
- Exhibits98: Chart on Fruits - Market size and forecast 2024-2029 ($ million)
- Exhibits99: Data Table on Fruits - Market size and forecast 2024-2029 ($ million)
- Exhibits100: Chart on Fruits - Year-over-year growth 2024-2029 (%)
- Exhibits101: Data Table on Fruits - Year-over-year growth 2024-2029 (%)
- Exhibits102: Chart on Flowers - Market size and forecast 2024-2029 ($ million)
- Exhibits103: Data Table on Flowers - Market size and forecast 2024-2029 ($ million)
- Exhibits104: Chart on Flowers - Year-over-year growth 2024-2029 (%)
- Exhibits105: Data Table on Flowers - Year-over-year growth 2024-2029 (%)
- Exhibits106: Market opportunity by Crop Type ($ million)
- Exhibits107: Data Table on Market opportunity by Crop Type ($ million)
- Exhibits108: Analysis of price sensitivity, lifecycle, customer purchase basket, adoption rates, and purchase criteria
- Exhibits109: Chart on Market share By Geographical Landscape 2024-2029 (%)
- Exhibits110: Data Table on Market share By Geographical Landscape 2024-2029 (%)
- Exhibits111: Chart on Geographic comparison
- Exhibits112: Data Table on Geographic comparison
- Exhibits113: Chart on Europe - Market size and forecast 2024-2029 ($ million)
- Exhibits114: Data Table on Europe - Market size and forecast 2024-2029 ($ million)
- Exhibits115: Chart on Europe - Year-over-year growth 2024-2029 (%)
- Exhibits116: Data Table on Europe - Year-over-year growth 2024-2029 (%)
- Exhibits117: Chart on APAC - Market size and forecast 2024-2029 ($ million)
- Exhibits118: Data Table on APAC - Market size and forecast 2024-2029 ($ million)
- Exhibits119: Chart on APAC - Year-over-year growth 2024-2029 (%)
- Exhibits120: Data Table on APAC - Year-over-year growth 2024-2029 (%)
- Exhibits121: Chart on North America - Market size and forecast 2024-2029 ($ million)
- Exhibits122: Data Table on North America - Market size and forecast 2024-2029 ($ million)
- Exhibits123: Chart on North America - Year-over-year growth 2024-2029 (%)
- Exhibits124: Data Table on North America - Year-over-year growth 2024-2029 (%)
- Exhibits125: Chart on South America - Market size and forecast 2024-2029 ($ million)
- Exhibits126: Data Table on South America - Market size and forecast 2024-2029 ($ million)
- Exhibits127: Chart on South America - Year-over-year growth 2024-2029 (%)
- Exhibits128: Data Table on South America - Year-over-year growth 2024-2029 (%)
- Exhibits129: Chart on Middle East and Africa - Market size and forecast 2024-2029 ($ million)
- Exhibits130: Data Table on Middle East and Africa - Market size and forecast 2024-2029 ($ million)
- Exhibits131: Chart on Middle East and Africa - Year-over-year growth 2024-2029 (%)
- Exhibits132: Data Table on Middle East and Africa - Year-over-year growth 2024-2029 (%)
- Exhibits133: Chart on US - Market size and forecast 2024-2029 ($ million)
- Exhibits134: Data Table on US - Market size and forecast 2024-2029 ($ million)
- Exhibits135: Chart on US - Year-over-year growth 2024-2029 (%)
- Exhibits136: Data Table on US - Year-over-year growth 2024-2029 (%)
- Exhibits137: Chart on The Netherlands - Market size and forecast 2024-2029 ($ million)
- Exhibits138: Data Table on The Netherlands - Market size and forecast 2024-2029 ($ million)
- Exhibits139: Chart on The Netherlands - Year-over-year growth 2024-2029 (%)
- Exhibits140: Data Table on The Netherlands - Year-over-year growth 2024-2029 (%)
- Exhibits141: Chart on Japan - Market size and forecast 2024-2029 ($ million)
- Exhibits142: Data Table on Japan - Market size and forecast 2024-2029 ($ million)
- Exhibits143: Chart on Japan - Year-over-year growth 2024-2029 (%)
- Exhibits144: Data Table on Japan - Year-over-year growth 2024-2029 (%)
- Exhibits145: Chart on China - Market size and forecast 2024-2029 ($ million)
- Exhibits146: Data Table on China - Market size and forecast 2024-2029 ($ million)
- Exhibits147: Chart on China - Year-over-year growth 2024-2029 (%)
- Exhibits148: Data Table on China - Year-over-year growth 2024-2029 (%)
- Exhibits149: Chart on Spain - Market size and forecast 2024-2029 ($ million)
- Exhibits150: Data Table on Spain - Market size and forecast 2024-2029 ($ million)
- Exhibits151: Chart on Spain - Year-over-year growth 2024-2029 (%)
- Exhibits152: Data Table on Spain - Year-over-year growth 2024-2029 (%)
- Exhibits153: Chart on India - Market size and forecast 2024-2029 ($ million)
- Exhibits154: Data Table on India - Market size and forecast 2024-2029 ($ million)
- Exhibits155: Chart on India - Year-over-year growth 2024-2029 (%)
- Exhibits156: Data Table on India - Year-over-year growth 2024-2029 (%)
- Exhibits157: Chart on Canada - Market size and forecast 2024-2029 ($ million)
- Exhibits158: Data Table on Canada - Market size and forecast 2024-2029 ($ million)
- Exhibits159: Chart on Canada - Year-over-year growth 2024-2029 (%)
- Exhibits160: Data Table on Canada - Year-over-year growth 2024-2029 (%)
- Exhibits161: Chart on Italy - Market size and forecast 2024-2029 ($ million)
- Exhibits162: Data Table on Italy - Market size and forecast 2024-2029 ($ million)
- Exhibits163: Chart on Italy - Year-over-year growth 2024-2029 (%)
- Exhibits164: Data Table on Italy - Year-over-year growth 2024-2029 (%)
- Exhibits165: Chart on Germany - Market size and forecast 2024-2029 ($ million)
- Exhibits166: Data Table on Germany - Market size and forecast 2024-2029 ($ million)
- Exhibits167: Chart on Germany - Year-over-year growth 2024-2029 (%)
- Exhibits168: Data Table on Germany - Year-over-year growth 2024-2029 (%)
- Exhibits169: Chart on South Korea - Market size and forecast 2024-2029 ($ million)
- Exhibits170: Data Table on South Korea - Market size and forecast 2024-2029 ($ million)
- Exhibits171: Chart on South Korea - Year-over-year growth 2024-2029 (%)
- Exhibits172: Data Table on South Korea - Year-over-year growth 2024-2029 (%)
- Exhibits173: Market opportunity By Geographical Landscape ($ million)
- Exhibits174: Data Tables on Market opportunity By Geographical Landscape ($ million)
- Exhibits175: Impact of drivers and challenges in 2024 and 2029
- Exhibits176: Overview on criticality of inputs and factors of differentiation
- Exhibits177: Overview on factors of disruption
- Exhibits178: Impact of key risks on business
- Exhibits179: Companies covered
- Exhibits180: Company ranking index
- Exhibits181: Matrix on companies position and classification
- Exhibits182: AmHydro - Overview
- Exhibits183: AmHydro - Product / Service
- Exhibits184: AmHydro - Key offerings
- Exhibits185: SWOT
- Exhibits186: Argus Control Systems Ltd. - Overview
- Exhibits187: Argus Control Systems Ltd. - Product / Service
- Exhibits188: Argus Control Systems Ltd. - Key offerings
- Exhibits189: SWOT
- Exhibits190: BrightFarms Inc. - Overview
- Exhibits191: BrightFarms Inc. - Product / Service
- Exhibits192: BrightFarms Inc. - Key offerings
- Exhibits193: SWOT
- Exhibits194: Fork Farms - Overview
- Exhibits195: Fork Farms - Product / Service
- Exhibits196: Fork Farms - Key offerings
- Exhibits197: SWOT
- Exhibits198: Greentech Organic Hydroponics Systems - Overview
- Exhibits199: Greentech Organic Hydroponics Systems - Product / Service
- Exhibits200: Greentech Organic Hydroponics Systems - Key offerings
- Exhibits201: SWOT
- Exhibits202: GrowLife Inc. - Overview
- Exhibits203: GrowLife Inc. - Product / Service
- Exhibits204: GrowLife Inc. - Key offerings
- Exhibits205: SWOT
- Exhibits206: Hawthorne Gardening Co. - Overview
- Exhibits207: Hawthorne Gardening Co. - Product / Service
- Exhibits208: Hawthorne Gardening Co. - Key offerings
- Exhibits209: SWOT
- Exhibits210: Hortisystems UK Ltd. - Overview
- Exhibits211: Hortisystems UK Ltd. - Product / Service
- Exhibits212: Hortisystems UK Ltd. - Key offerings
- Exhibits213: SWOT
- Exhibits214: Hydrodynamics International Inc. - Overview
- Exhibits215: Hydrodynamics International Inc. - Product / Service
- Exhibits216: Hydrodynamics International Inc. - Key offerings
- Exhibits217: SWOT
- Exhibits218: Koninklijke Philips NV - Overview
- Exhibits219: Koninklijke Philips NV - Business segments
- Exhibits220: Koninklijke Philips NV - Key news
- Exhibits221: Koninklijke Philips NV - Key offerings
- Exhibits222: Koninklijke Philips NV - Segment focus
- Exhibits223: SWOT
- Exhibits224: KUBO TUINBOUWPROJECTEN BV - Overview
- Exhibits225: KUBO TUINBOUWPROJECTEN BV - Product / Service
- Exhibits226: KUBO TUINBOUWPROJECTEN BV - Key offerings
- Exhibits227: SWOT
- Exhibits228: LOGIQS B.V. - Overview
- Exhibits229: LOGIQS B.V. - Product / Service
- Exhibits230: LOGIQS B.V. - Key offerings
- Exhibits231: SWOT
- Exhibits232: TERRATECH - Overview
- Exhibits233: TERRATECH - Product / Service
- Exhibits234: TERRATECH - Key offerings
- Exhibits235: SWOT
- Exhibits236: Thanet Earth Ltd. - Overview
- Exhibits237: Thanet Earth Ltd. - Product / Service
- Exhibits238: Thanet Earth Ltd. - Key offerings
- Exhibits239: SWOT
- Exhibits240: Village Farms International Inc. - Overview
- Exhibits241: Village Farms International Inc. - Business segments
- Exhibits242: Village Farms International Inc. - Key offerings
- Exhibits243: Village Farms International Inc. - Segment focus
- Exhibits244: SWOT
- Exhibits245: Inclusions checklist
- Exhibits246: Exclusions checklist
- Exhibits247: Currency conversion rates for US$
- Exhibits248: Research methodology
- Exhibits249: Information sources
- Exhibits250: Data validation
- Exhibits251: Validation techniques employed for market sizing
- Exhibits252: Data synthesis
- Exhibits253: 360 degree market analysis
- Exhibits254: List of abbreviations
The hydroponics technologies market is forecasted to grow by USD 870.5 mn during 2024-2029, accelerating at a CAGR of 17.9% during the forecast period. The report on the hydroponics technologies market provides a holistic analysis, market size and forecast, trends, growth drivers, and challenges, as well as vendor analysis covering around 25 vendors.
The report offers an up-to-date analysis regarding the current market scenario, the latest trends and drivers, and the overall market environment. The market is driven by facilitation in soil and space-saving, need for reduction in soil and water pollution, and increase in offering of certified products.
| Market Scope | |
|---|---|
| Base Year | 2025 |
| End Year | 2029 |
| Series Year | 2025-2029 |
| Growth Momentum | Accelerate |
| YOY 2025 | 14.7% |
| CAGR | 17.9% |
| Incremental Value | $870.5 mn |
The study was conducted using an objective combination of primary and secondary information including inputs from key participants in the industry. The report contains a comprehensive market size data, segment with regional analysis and vendor landscape in addition to an analysis of the key companies. Reports have historic and forecast data.
Technavio's hydroponics technologies market is segmented as below:
By Technology
- Environment and climate control systems
- Grow lights
- Farm management systems
- Material handling systems
By Type
- Aggregate system
- Liquid system
By Method
- Indoor
- Outdoor
By Crop Type
- Vegetables
- Fruits
- Flowers
By Geographical Landscape
- Europe
- APAC
- North America
- South America
- Middle East and Africa
This study identifies the increase in offering of advanced hydroponic growing systems as one of the prime reasons driving the hydroponics technologies market growth during the next few years. Also, launch of energy-efficient led grow lights and increasing use of automation in hydroponics technologies will lead to sizable demand in the market.
The report on the hydroponics technologies market covers the following areas:
- Hydroponics Technologies Market sizing
- Hydroponics Technologies Market forecast
- Hydroponics Technologies Market industry analysis
The robust vendor analysis is designed to help clients improve their market position, and in line with this, this report provides a detailed analysis of several leading hydroponics technologies market vendors that include AmHydro, Argus Control Systems Ltd., BrightFarms Inc., Brio Agri Producer Co. Ltd., Fork Farms, Greentech Organic Hydroponics Systems, GrowLife Inc., Hawthorne Gardening Co., Heliospectra AB, Hortisystems UK Ltd., Hydrodynamics International Inc., Koninklijke Philips NV, KUBO TUINBOUWPROJECTEN BV, LOGIQS B.V., Nutrifresh Farm Tech India Pvt. Ltd., Rise Hydroponics, TERRATECH, Thanet Earth Ltd., Valoya Oy, and Village Farms International Inc.. Also, the hydroponics technologies market analysis report includes information on upcoming trends and challenges that will influence market growth. This is to help companies strategize and leverage all forthcoming growth opportunities.
The publisher presents a detailed picture of the market by the way of study, synthesis, and summation of data from multiple sources by an analysis of key parameters such as profit, pricing, competition, and promotions. It presents various market facets by identifying the key industry influencers. The data presented is comprehensive, reliable, and a result of extensive primary and secondary research. The market research reports provide a complete competitive landscape and an in-depth vendor selection methodology and analysis using qualitative and quantitative research to forecast accurate market growth.
Table of Contents
1 Executive Summary
- 1.1 Market overview
- Executive Summary - Chart on Market Overview
- Executive Summary - Data Table on Market Overview
- Executive Summary - Chart on Global Market Characteristics
- Executive Summary - Chart on Market By Geographical Landscape
- Executive Summary - Chart on Market Segmentation by Technology
- Executive Summary - Chart on Market Segmentation by Type
- Executive Summary - Chart on Market Segmentation by Method
- Executive Summary - Chart on Market Segmentation by Crop Type
- Executive Summary - Chart on Incremental Growth
- Executive Summary - Data Table on Incremental Growth
- Executive Summary - Chart on Company Market Positioning
2 Technavio Analysis
- 2.1 Analysis of price sensitivity, lifecycle, customer purchase basket, adoption rates, and purchase criteria
- Analysis of price sensitivity, lifecycle, customer purchase basket, adoption rates, and purchase criteria
- 2.2 Criticality of inputs and Factors of differentiation
- Overview on criticality of inputs and factors of differentiation
- 2.3 Factors of disruption
- Overview on factors of disruption
- 2.4 Impact of drivers and challenges
- Impact of drivers and challenges in 2024 and 2029
3 Market Landscape
- 3.1 Market ecosystem
- Parent Market
- Data Table on - Parent Market
- 3.2 Market characteristics
- Market characteristics analysis
- 3.3 Value chain analysis
- Value chain analysis
4 Market Sizing
- 4.1 Market definition
- Offerings of companies included in the market definition
- 4.2 Market segment analysis
- Market segments
- 4.3 Market size 2024
- 4.4 Market outlook: Forecast for 2024-2029
- Chart on Global - Market size and forecast 2024-2029 ($ million)
- Data Table on Global - Market size and forecast 2024-2029 ($ million)
- Chart on Global Market: Year-over-year growth 2024-2029 (%)
- Data Table on Global Market: Year-over-year growth 2024-2029 (%)
5 Historic Market Size
- 5.1 Global Hydroponics Technologies Market 2019 - 2023
- Historic Market Size - Data Table on Global Hydroponics Technologies Market 2019 - 2023 ($ million)
- 5.2 Technology segment analysis 2019 - 2023
- Historic Market Size - Technology Segment 2019 - 2023 ($ million)
- 5.3 Type segment analysis 2019 - 2023
- Historic Market Size - Type Segment 2019 - 2023 ($ million)
- 5.4 Method segment analysis 2019 - 2023
- Historic Market Size - Method Segment 2019 - 2023 ($ million)
- 5.5 Crop Type segment analysis 2019 - 2023
- Historic Market Size - Crop Type Segment 2019 - 2023 ($ million)
- 5.6 Geography segment analysis 2019 - 2023
- Historic Market Size - Geography Segment 2019 - 2023 ($ million)
- 5.7 Country segment analysis 2019 - 2023
- Historic Market Size - Country Segment 2019 - 2023 ($ million)
6 Qualitative Analysis
- 6.1 The AI impact on Global Hydroponics Technologies Market
7 Five Forces Analysis
- 7.1 Five forces summary
- Five forces analysis - Comparison between 2024 and 2029
- 7.2 Bargaining power of buyers
- Bargaining power of buyers - Impact of key factors 2024 and 2029
- 7.3 Bargaining power of suppliers
- Bargaining power of suppliers - Impact of key factors in 2024 and 2029
- 7.4 Threat of new entrants
- Threat of new entrants - Impact of key factors in 2024 and 2029
- 7.5 Threat of substitutes
- Threat of substitutes - Impact of key factors in 2024 and 2029
- 7.6 Threat of rivalry
- Threat of rivalry - Impact of key factors in 2024 and 2029
- 7.7 Market condition
- Chart on Market condition - Five forces 2024 and 2029
8 Market Segmentation by Technology
- 8.1 Market segments
- Chart on Technology - Market share 2024-2029 (%)
- Data Table on Technology - Market share 2024-2029 (%)
- 8.2 Comparison by Technology
- Chart on Comparison by Technology
- Data Table on Comparison by Technology
- 8.3 Environment and climate control systems - Market size and forecast 2024-2029
- Chart on Environment and climate control systems - Market size and forecast 2024-2029 ($ million)
- Data Table on Environment and climate control systems - Market size and forecast 2024-2029 ($ million)
- Chart on Environment and climate control systems - Year-over-year growth 2024-2029 (%)
- Data Table on Environment and climate control systems - Year-over-year growth 2024-2029 (%)
- 8.4 Grow lights - Market size and forecast 2024-2029
- Chart on Grow lights - Market size and forecast 2024-2029 ($ million)
- Data Table on Grow lights - Market size and forecast 2024-2029 ($ million)
- Chart on Grow lights - Year-over-year growth 2024-2029 (%)
- Data Table on Grow lights - Year-over-year growth 2024-2029 (%)
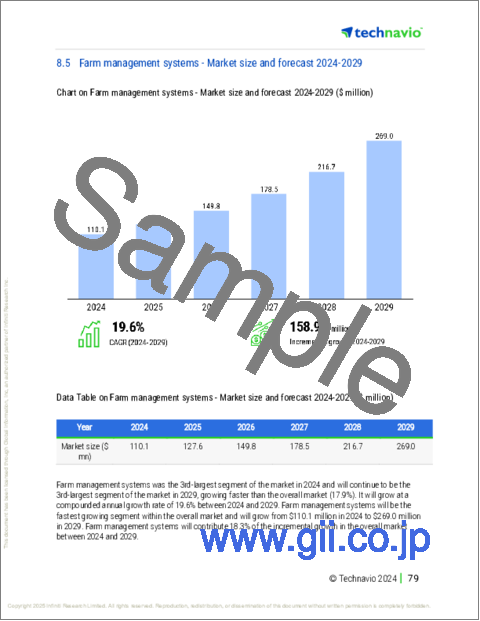
- 8.5 Farm management systems - Market size and forecast 2024-2029
- Chart on Farm management systems - Market size and forecast 2024-2029 ($ million)
- Data Table on Farm management systems - Market size and forecast 2024-2029 ($ million)
- Chart on Farm management systems - Year-over-year growth 2024-2029 (%)
- Data Table on Farm management systems - Year-over-year growth 2024-2029 (%)
- 8.6 Material handling systems - Market size and forecast 2024-2029
- Chart on Material handling systems - Market size and forecast 2024-2029 ($ million)
- Data Table on Material handling systems - Market size and forecast 2024-2029 ($ million)
- Chart on Material handling systems - Year-over-year growth 2024-2029 (%)
- Data Table on Material handling systems - Year-over-year growth 2024-2029 (%)
- 8.7 Market opportunity by Technology
- Market opportunity by Technology ($ million)
- Data Table on Market opportunity by Technology ($ million)
9 Market Segmentation by Type
- 9.1 Market segments
- Chart on Type - Market share 2024-2029 (%)
- Data Table on Type - Market share 2024-2029 (%)
- 9.2 Comparison by Type
- Chart on Comparison by Type
- Data Table on Comparison by Type
- 9.3 Aggregate system - Market size and forecast 2024-2029
- Chart on Aggregate system - Market size and forecast 2024-2029 ($ million)
- Data Table on Aggregate system - Market size and forecast 2024-2029 ($ million)
- Chart on Aggregate system - Year-over-year growth 2024-2029 (%)
- Data Table on Aggregate system - Year-over-year growth 2024-2029 (%)
- 9.4 Liquid system - Market size and forecast 2024-2029
- Chart on Liquid system - Market size and forecast 2024-2029 ($ million)
- Data Table on Liquid system - Market size and forecast 2024-2029 ($ million)
- Chart on Liquid system - Year-over-year growth 2024-2029 (%)
- Data Table on Liquid system - Year-over-year growth 2024-2029 (%)
- 9.5 Market opportunity by Type
- Market opportunity by Type ($ million)
- Data Table on Market opportunity by Type ($ million)
10 Market Segmentation by Method
- 10.1 Market segments
- Chart on Method - Market share 2024-2029 (%)
- Data Table on Method - Market share 2024-2029 (%)
- 10.2 Comparison by Method
- Chart on Comparison by Method
- Data Table on Comparison by Method
- 10.3 Indoor - Market size and forecast 2024-2029
- Chart on Indoor - Market size and forecast 2024-2029 ($ million)
- Data Table on Indoor - Market size and forecast 2024-2029 ($ million)
- Chart on Indoor - Year-over-year growth 2024-2029 (%)
- Data Table on Indoor - Year-over-year growth 2024-2029 (%)
- 10.4 Outdoor - Market size and forecast 2024-2029
- Chart on Outdoor - Market size and forecast 2024-2029 ($ million)
- Data Table on Outdoor - Market size and forecast 2024-2029 ($ million)
- Chart on Outdoor - Year-over-year growth 2024-2029 (%)
- Data Table on Outdoor - Year-over-year growth 2024-2029 (%)
- 10.5 Market opportunity by Method
- Market opportunity by Method ($ million)
- Data Table on Market opportunity by Method ($ million)
11 Market Segmentation by Crop Type
- 11.1 Market segments
- Chart on Crop Type - Market share 2024-2029 (%)
- Data Table on Crop Type - Market share 2024-2029 (%)
- 11.2 Comparison by Crop Type
- Chart on Comparison by Crop Type
- Data Table on Comparison by Crop Type
- 11.3 Vegetables - Market size and forecast 2024-2029
- Chart on Vegetables - Market size and forecast 2024-2029 ($ million)
- Data Table on Vegetables - Market size and forecast 2024-2029 ($ million)
- Chart on Vegetables - Year-over-year growth 2024-2029 (%)
- Data Table on Vegetables - Year-over-year growth 2024-2029 (%)
- 11.4 Fruits - Market size and forecast 2024-2029
- Chart on Fruits - Market size and forecast 2024-2029 ($ million)
- Data Table on Fruits - Market size and forecast 2024-2029 ($ million)
- Chart on Fruits - Year-over-year growth 2024-2029 (%)
- Data Table on Fruits - Year-over-year growth 2024-2029 (%)
- 11.5 Flowers - Market size and forecast 2024-2029
- Chart on Flowers - Market size and forecast 2024-2029 ($ million)
- Data Table on Flowers - Market size and forecast 2024-2029 ($ million)
- Chart on Flowers - Year-over-year growth 2024-2029 (%)
- Data Table on Flowers - Year-over-year growth 2024-2029 (%)
- 11.6 Market opportunity by Crop Type
- Market opportunity by Crop Type ($ million)
- Data Table on Market opportunity by Crop Type ($ million)
12 Customer Landscape
- 12.1 Customer landscape overview
- Analysis of price sensitivity, lifecycle, customer purchase basket, adoption rates, and purchase criteria
13 Geographic Landscape
- 13.1 Geographic segmentation
- Chart on Market share By Geographical Landscape 2024-2029 (%)
- Data Table on Market share By Geographical Landscape 2024-2029 (%)
- 13.2 Geographic comparison
- Chart on Geographic comparison
- Data Table on Geographic comparison
- 13.3 Europe - Market size and forecast 2024-2029
- Chart on Europe - Market size and forecast 2024-2029 ($ million)
- Data Table on Europe - Market size and forecast 2024-2029 ($ million)
- Chart on Europe - Year-over-year growth 2024-2029 (%)
- Data Table on Europe - Year-over-year growth 2024-2029 (%)
- 13.4 APAC - Market size and forecast 2024-2029
- Chart on APAC - Market size and forecast 2024-2029 ($ million)
- Data Table on APAC - Market size and forecast 2024-2029 ($ million)
- Chart on APAC - Year-over-year growth 2024-2029 (%)
- Data Table on APAC - Year-over-year growth 2024-2029 (%)
- 13.5 North America - Market size and forecast 2024-2029
- Chart on North America - Market size and forecast 2024-2029 ($ million)
- Data Table on North America - Market size and forecast 2024-2029 ($ million)
- Chart on North America - Year-over-year growth 2024-2029 (%)
- Data Table on North America - Year-over-year growth 2024-2029 (%)
- 13.6 South America - Market size and forecast 2024-2029
- Chart on South America - Market size and forecast 2024-2029 ($ million)
- Data Table on South America - Market size and forecast 2024-2029 ($ million)
- Chart on South America - Year-over-year growth 2024-2029 (%)
- Data Table on South America - Year-over-year growth 2024-2029 (%)
- 13.7 Middle East and Africa - Market size and forecast 2024-2029
- Chart on Middle East and Africa - Market size and forecast 2024-2029 ($ million)
- Data Table on Middle East and Africa - Market size and forecast 2024-2029 ($ million)
- Chart on Middle East and Africa - Year-over-year growth 2024-2029 (%)
- Data Table on Middle East and Africa - Year-over-year growth 2024-2029 (%)
- 13.8 US - Market size and forecast 2024-2029
- Chart on US - Market size and forecast 2024-2029 ($ million)
- Data Table on US - Market size and forecast 2024-2029 ($ million)
- Chart on US - Year-over-year growth 2024-2029 (%)
- Data Table on US - Year-over-year growth 2024-2029 (%)
- 13.9 The Netherlands - Market size and forecast 2024-2029
- Chart on The Netherlands - Market size and forecast 2024-2029 ($ million)
- Data Table on The Netherlands - Market size and forecast 2024-2029 ($ million)
- Chart on The Netherlands - Year-over-year growth 2024-2029 (%)
- Data Table on The Netherlands - Year-over-year growth 2024-2029 (%)
- 13.10 Japan - Market size and forecast 2024-2029
- Chart on Japan - Market size and forecast 2024-2029 ($ million)
- Data Table on Japan - Market size and forecast 2024-2029 ($ million)
- Chart on Japan - Year-over-year growth 2024-2029 (%)
- Data Table on Japan - Year-over-year growth 2024-2029 (%)
- 13.11 China - Market size and forecast 2024-2029
- Chart on China - Market size and forecast 2024-2029 ($ million)
- Data Table on China - Market size and forecast 2024-2029 ($ million)
- Chart on China - Year-over-year growth 2024-2029 (%)
- Data Table on China - Year-over-year growth 2024-2029 (%)
- 13.12 Spain - Market size and forecast 2024-2029
- Chart on Spain - Market size and forecast 2024-2029 ($ million)
- Data Table on Spain - Market size and forecast 2024-2029 ($ million)
- Chart on Spain - Year-over-year growth 2024-2029 (%)
- Data Table on Spain - Year-over-year growth 2024-2029 (%)
- 13.13 India - Market size and forecast 2024-2029
- Chart on India - Market size and forecast 2024-2029 ($ million)
- Data Table on India - Market size and forecast 2024-2029 ($ million)
- Chart on India - Year-over-year growth 2024-2029 (%)
- Data Table on India - Year-over-year growth 2024-2029 (%)
- 13.14 Canada - Market size and forecast 2024-2029
- Chart on Canada - Market size and forecast 2024-2029 ($ million)
- Data Table on Canada - Market size and forecast 2024-2029 ($ million)
- Chart on Canada - Year-over-year growth 2024-2029 (%)
- Data Table on Canada - Year-over-year growth 2024-2029 (%)
- 13.15 Italy - Market size and forecast 2024-2029
- Chart on Italy - Market size and forecast 2024-2029 ($ million)
- Data Table on Italy - Market size and forecast 2024-2029 ($ million)
- Chart on Italy - Year-over-year growth 2024-2029 (%)
- Data Table on Italy - Year-over-year growth 2024-2029 (%)
- 13.16 Germany - Market size and forecast 2024-2029
- Chart on Germany - Market size and forecast 2024-2029 ($ million)
- Data Table on Germany - Market size and forecast 2024-2029 ($ million)
- Chart on Germany - Year-over-year growth 2024-2029 (%)
- Data Table on Germany - Year-over-year growth 2024-2029 (%)
- 13.17 South Korea - Market size and forecast 2024-2029
- Chart on South Korea - Market size and forecast 2024-2029 ($ million)
- Data Table on South Korea - Market size and forecast 2024-2029 ($ million)
- Chart on South Korea - Year-over-year growth 2024-2029 (%)
- Data Table on South Korea - Year-over-year growth 2024-2029 (%)
- 13.18 Market opportunity By Geographical Landscape
- Market opportunity By Geographical Landscape ($ million)
- Data Tables on Market opportunity By Geographical Landscape ($ million)
14 Drivers, Challenges, and Opportunity/Restraints
- 14.1 Market drivers
- 14.2 Market challenges
- 14.3 Impact of drivers and challenges
- Impact of drivers and challenges in 2024 and 2029
- 14.4 Market opportunities/restraints
15 Competitive Landscape
- 15.1 Overview
- 15.2 Competitive Landscape
- Overview on criticality of inputs and factors of differentiation
- 15.3 Landscape disruption
- Overview on factors of disruption
- 15.4 Industry risks
- Impact of key risks on business
16 Competitive Analysis
- 16.1 Companies profiled
- Companies covered
- 16.2 Company ranking index
- Company ranking index
- 16.3 Market positioning of companies
- Matrix on companies position and classification
- 16.4 AmHydro
- AmHydro - Overview
- AmHydro - Product / Service
- AmHydro - Key offerings
- SWOT
- 16.5 Argus Control Systems Ltd.
- Argus Control Systems Ltd. - Overview
- Argus Control Systems Ltd. - Product / Service
- Argus Control Systems Ltd. - Key offerings
- SWOT
- 16.6 BrightFarms Inc.
- BrightFarms Inc. - Overview
- BrightFarms Inc. - Product / Service
- BrightFarms Inc. - Key offerings
- SWOT
- 16.7 Fork Farms
- Fork Farms - Overview
- Fork Farms - Product / Service
- Fork Farms - Key offerings
- SWOT
- 16.8 Greentech Organic Hydroponics Systems
- Greentech Organic Hydroponics Systems - Overview
- Greentech Organic Hydroponics Systems - Product / Service
- Greentech Organic Hydroponics Systems - Key offerings
- SWOT
- 16.9 GrowLife Inc.
- GrowLife Inc. - Overview
- GrowLife Inc. - Product / Service
- GrowLife Inc. - Key offerings
- SWOT
- 16.10 Hawthorne Gardening Co.
- Hawthorne Gardening Co. - Overview
- Hawthorne Gardening Co. - Product / Service
- Hawthorne Gardening Co. - Key offerings
- SWOT
- 16.11 Hortisystems UK Ltd.
- Hortisystems UK Ltd. - Overview
- Hortisystems UK Ltd. - Product / Service
- Hortisystems UK Ltd. - Key offerings
- SWOT
- 16.12 Hydrodynamics International Inc.
- Hydrodynamics International Inc. - Overview
- Hydrodynamics International Inc. - Product / Service
- Hydrodynamics International Inc. - Key offerings
- SWOT
- 16.13 Koninklijke Philips NV
- Koninklijke Philips NV - Overview
- Koninklijke Philips NV - Business segments
- Koninklijke Philips NV - Key news
- Koninklijke Philips NV - Key offerings
- Koninklijke Philips NV - Segment focus
- SWOT
- 16.14 KUBO TUINBOUWPROJECTEN BV
- KUBO TUINBOUWPROJECTEN BV - Overview
- KUBO TUINBOUWPROJECTEN BV - Product / Service
- KUBO TUINBOUWPROJECTEN BV - Key offerings
- SWOT
- 16.15 LOGIQS B.V.
- LOGIQS B.V. - Overview
- LOGIQS B.V. - Product / Service
- LOGIQS B.V. - Key offerings
- SWOT
- 16.16 TERRATECH
- TERRATECH - Overview
- TERRATECH - Product / Service
- TERRATECH - Key offerings
- SWOT
- 16.17 Thanet Earth Ltd.
- Thanet Earth Ltd. - Overview
- Thanet Earth Ltd. - Product / Service
- Thanet Earth Ltd. - Key offerings
- SWOT
- 16.18 Village Farms International Inc.
- Village Farms International Inc. - Overview
- Village Farms International Inc. - Business segments
- Village Farms International Inc. - Key offerings
- Village Farms International Inc. - Segment focus
- SWOT
17 Appendix
- 17.1 Scope of the report
- 17.2 Inclusions and exclusions checklist
- Inclusions checklist
- Exclusions checklist
- 17.3 Currency conversion rates for US$
- Currency conversion rates for US$
- 17.4 Research methodology
- Research methodology
- 17.5 Data procurement
- Information sources
- 17.6 Data validation
- Data validation
- 17.7 Validation techniques employed for market sizing
- Validation techniques employed for market sizing
- 17.8 Data synthesis
- Data synthesis
- 17.9 360 degree market analysis
- 360 degree market analysis
- 17.10 List of abbreviations
- List of abbreviations
