|
|
市場調査レポート
商品コード
1490725
染み抜き剤の世界市場 2024年~2028年Global stain remover market 2024-2028 |
||||||

|
|||||||
カスタマイズ可能
|
|||||||

| 染み抜き剤の世界市場 2024年~2028年 |
|
出版日: 2024年05月17日
発行: TechNavio
ページ情報: 英文 175 Pages
納期: 即納可能
|

全表示
- 概要
- 図表
- 目次
染み抜き剤市場は2023年から2028年にかけて72億5,000万米ドル成長し、予測期間中にCAGR6.01%で拡大すると予測されています。
当レポートでは、染み抜き剤市場の全体的な分析、市場規模・予測、動向、成長促進要因、課題、約25のベンダーを網羅したベンダー分析などを掲載しています。
現在の市場シナリオ、最新動向と促進要因、市場環境全体に関する最新分析を提供しています。市場は、利用可能な染み抜き剤の種類の増加、洗濯衛生の重要性に対する意識の高まり、革新的なパッケージオプションへの注目の高まりによって牽引されています。
| 市場範囲 | |
|---|---|
| 基準年 | 2024年 |
| 終了年 | 2028年 |
| 予測期間 | 2024年~2028年 |
| 成長モメンタム | 加速 |
| 前年比2024年 | 5.31% |
| CAGR | 6.01% |
| 増分額 | 72億5,000万米ドル |
本調査では、環境に優しいランドリーケア製品の登場が、今後数年間の染み抜き剤市場の成長を牽引する主要因の1つであるとしています。また、顧客の魅力を引き出し、製品の認知度を高めるための様々なマーケティングイニシアティブのイントロダクションや、新興国市場の有望な需要は、市場の大きな需要につながると思われます。
目次
第1章 エグゼクティブサマリー
- 市場概要
第2章 市場情勢
- 市場エコシステム
- 市場の特徴
- バリューチェーン分析
第3章 市場規模の評価
- 市場の定義
- 市場セグメント分析
- 市場規模(2023年)
- 市場の見通し(2023年~2028年)
第4章 市場規模実績
- 世界の染み抜き剤市場(2018年~2022年)
- 製品別セグメント分析(2018年~2022年)
- エンドユーザー別セグメント分析(2018年~2022年)
- 地域別セグメント分析(2018年~2022年)
- 国別セグメント分析(2018年~2022年)
第5章 ファイブフォース分析
- ファイブフォースの要約
- 買い手の交渉力
- 供給企業の交渉力
- 新規参入業者の脅威
- 代替品の脅威
- 競争の脅威
- 市況
第6章 市場セグメンテーション:製品別
- 市場セグメンテーション
- 比較:製品別
- 粉末:市場規模と予測(2023年~2028年)
- 液体:市場規模と予測(2023年~2028年)
- 固形:市場規模と予測(2023年~2028年)
- その他:市場規模と予測(2023年~2028年)
- 市場機会:製品別
第7章 市場セグメンテーション:エンドユーザー別
- 市場セグメンテーション
- 比較:エンドユーザー別
- 住宅用:市場規模と予測(2023年~2028年)
- 商業用:市場規模と予測(2023年~2028年)
- 市場機会:エンドユーザー別
第8章 顧客情勢
- 顧客情勢の概要
第9章 地域別情勢
- 地域別セグメンテーション
- 地域別比較
- 北米:市場規模と予測(2023年~2028年)
- アジア太平洋:市場規模と予測(2023年~2028年)
- 欧州:市場規模と予測(2023年~2028年)
- 南米:市場規模と予測(2023年~2028年)
- 中東・アフリカ:市場規模と予測(2023年~2028年)
- 米国:市場規模と予測(2023年~2028年)
- 中国:市場規模と予測(2023年~2028年)
- ドイツ:市場規模と予測(2023年~2028年)
- 英国:市場規模と予測(2023年~2028年)
- ブラジル:市場規模と予測(2023年~2028年)
- 市場機会:地域情勢別
第10章 促進要因・課題・機会・抑制要因
- 市場促進要因
- 市場の課題
- 促進要因と課題の影響
- 市場の機会・抑制要因
第11章 競合情勢
- 概要
- 競合情勢
- 混乱の状況
- 業界のリスク
第12章 競合分析
- 企業プロファイル
- 企業の市場ポジショニング
- Agar Cleaning Systems Pty Ltd.
- Amtech UK
- Amway Corp.
- Church and Dwight Co. Inc.
- Godrej Consumer Products Ltd.
- Greenology Products Inc.
- Henkel AG and Co. KGaA
- Kao Corp.
- Quality Chemicals S.L
- Reckitt Benckiser Group Plc
- S.C. Johnson and Son Inc.
- Sarex
- The Clorox Co.
- The Procter and Gamble Co.
- Unilever PLC
第13章 付録
Exhibits:
- Exhibits1: Executive Summary - Chart on Market Overview
- Exhibits2: Executive Summary - Data Table on Market Overview
- Exhibits3: Executive Summary - Chart on Global Market Characteristics
- Exhibits4: Executive Summary - Chart on Market By Geographical Landscape
- Exhibits5: Executive Summary - Chart on Market Segmentation by Product
- Exhibits6: Executive Summary - Chart on Market Segmentation by End-user
- Exhibits7: Executive Summary - Chart on Incremental Growth
- Exhibits8: Executive Summary - Data Table on Incremental Growth
- Exhibits9: Executive Summary - Chart on Company Market Positioning
- Exhibits10: Parent Market
- Exhibits11: Data Table on - Parent Market
- Exhibits12: Market characteristics analysis
- Exhibits13: Value Chain Analysis
- Exhibits14: Offerings of companies included in the market definition
- Exhibits15: Market segments
- Exhibits16: Chart on Global - Market size and forecast 2023-2028 ($ million)
- Exhibits17: Data Table on Global - Market size and forecast 2023-2028 ($ million)
- Exhibits18: Chart on Global Market: Year-over-year growth 2023-2028 (%)
- Exhibits19: Data Table on Global Market: Year-over-year growth 2023-2028 (%)
- Exhibits20: Historic Market Size - Data Table on Global Stain Remover Market 2018 - 2022 ($ million)
- Exhibits21: Historic Market Size - Product Segment 2018 - 2022 ($ million)
- Exhibits22: Historic Market Size - End-user Segment 2018 - 2022 ($ million)
- Exhibits23: Historic Market Size - Geography Segment 2018 - 2022 ($ million)
- Exhibits24: Historic Market Size - Country Segment 2018 - 2022 ($ million)
- Exhibits25: Five forces analysis - Comparison between 2023 and 2028
- Exhibits26: Bargaining power of buyers - Impact of key factors 2023 and 2028
- Exhibits27: Bargaining power of suppliers - Impact of key factors in 2023 and 2028
- Exhibits28: Threat of new entrants - Impact of key factors in 2023 and 2028
- Exhibits29: Threat of substitutes - Impact of key factors in 2023 and 2028
- Exhibits30: Threat of rivalry - Impact of key factors in 2023 and 2028
- Exhibits31: Chart on Market condition - Five forces 2023 and 2028
- Exhibits32: Chart on Product - Market share 2023-2028 (%)
- Exhibits33: Data Table on Product - Market share 2023-2028 (%)
- Exhibits34: Chart on Comparison by Product
- Exhibits35: Data Table on Comparison by Product
- Exhibits36: Chart on Powder - Market size and forecast 2023-2028 ($ million)
- Exhibits37: Data Table on Powder - Market size and forecast 2023-2028 ($ million)
- Exhibits38: Chart on Powder - Year-over-year growth 2023-2028 (%)
- Exhibits39: Data Table on Powder - Year-over-year growth 2023-2028 (%)
- Exhibits40: Chart on Liquid - Market size and forecast 2023-2028 ($ million)
- Exhibits41: Data Table on Liquid - Market size and forecast 2023-2028 ($ million)
- Exhibits42: Chart on Liquid - Year-over-year growth 2023-2028 (%)
- Exhibits43: Data Table on Liquid - Year-over-year growth 2023-2028 (%)
- Exhibits44: Chart on Bar - Market size and forecast 2023-2028 ($ million)
- Exhibits45: Data Table on Bar - Market size and forecast 2023-2028 ($ million)
- Exhibits46: Chart on Bar - Year-over-year growth 2023-2028 (%)
- Exhibits47: Data Table on Bar - Year-over-year growth 2023-2028 (%)
- Exhibits48: Chart on Others - Market size and forecast 2023-2028 ($ million)
- Exhibits49: Data Table on Others - Market size and forecast 2023-2028 ($ million)
- Exhibits50: Chart on Others - Year-over-year growth 2023-2028 (%)
- Exhibits51: Data Table on Others - Year-over-year growth 2023-2028 (%)
- Exhibits52: Market opportunity by Product ($ million)
- Exhibits53: Data Table on Market opportunity by Product ($ million)
- Exhibits54: Chart on End-user - Market share 2023-2028 (%)
- Exhibits55: Data Table on End-user - Market share 2023-2028 (%)
- Exhibits56: Chart on Comparison by End-user
- Exhibits57: Data Table on Comparison by End-user
- Exhibits58: Chart on Residential - Market size and forecast 2023-2028 ($ million)
- Exhibits59: Data Table on Residential - Market size and forecast 2023-2028 ($ million)
- Exhibits60: Chart on Residential - Year-over-year growth 2023-2028 (%)
- Exhibits61: Data Table on Residential - Year-over-year growth 2023-2028 (%)
- Exhibits62: Chart on Commercial - Market size and forecast 2023-2028 ($ million)
- Exhibits63: Data Table on Commercial - Market size and forecast 2023-2028 ($ million)
- Exhibits64: Chart on Commercial - Year-over-year growth 2023-2028 (%)
- Exhibits65: Data Table on Commercial - Year-over-year growth 2023-2028 (%)
- Exhibits66: Market opportunity by End-user ($ million)
- Exhibits67: Data Table on Market opportunity by End-user ($ million)
- Exhibits68: Analysis of price sensitivity, lifecycle, customer purchase basket, adoption rates, and purchase criteria
- Exhibits69: Chart on Market share By Geographical Landscape 2023-2028 (%)
- Exhibits70: Data Table on Market share By Geographical Landscape 2023-2028 (%)
- Exhibits71: Chart on Geographic comparison
- Exhibits72: Data Table on Geographic comparison
- Exhibits73: Chart on North America - Market size and forecast 2023-2028 ($ million)
- Exhibits74: Data Table on North America - Market size and forecast 2023-2028 ($ million)
- Exhibits75: Chart on North America - Year-over-year growth 2023-2028 (%)
- Exhibits76: Data Table on North America - Year-over-year growth 2023-2028 (%)
- Exhibits77: Chart on APAC - Market size and forecast 2023-2028 ($ million)
- Exhibits78: Data Table on APAC - Market size and forecast 2023-2028 ($ million)
- Exhibits79: Chart on APAC - Year-over-year growth 2023-2028 (%)
- Exhibits80: Data Table on APAC - Year-over-year growth 2023-2028 (%)
- Exhibits81: Chart on Europe - Market size and forecast 2023-2028 ($ million)
- Exhibits82: Data Table on Europe - Market size and forecast 2023-2028 ($ million)
- Exhibits83: Chart on Europe - Year-over-year growth 2023-2028 (%)
- Exhibits84: Data Table on Europe - Year-over-year growth 2023-2028 (%)
- Exhibits85: Chart on South America - Market size and forecast 2023-2028 ($ million)
- Exhibits86: Data Table on South America - Market size and forecast 2023-2028 ($ million)
- Exhibits87: Chart on South America - Year-over-year growth 2023-2028 (%)
- Exhibits88: Data Table on South America - Year-over-year growth 2023-2028 (%)
- Exhibits89: Chart on Middle East and Africa - Market size and forecast 2023-2028 ($ million)
- Exhibits90: Data Table on Middle East and Africa - Market size and forecast 2023-2028 ($ million)
- Exhibits91: Chart on Middle East and Africa - Year-over-year growth 2023-2028 (%)
- Exhibits92: Data Table on Middle East and Africa - Year-over-year growth 2023-2028 (%)
- Exhibits93: Chart on US - Market size and forecast 2023-2028 ($ million)
- Exhibits94: Data Table on US - Market size and forecast 2023-2028 ($ million)
- Exhibits95: Chart on US - Year-over-year growth 2023-2028 (%)
- Exhibits96: Data Table on US - Year-over-year growth 2023-2028 (%)
- Exhibits97: Chart on China - Market size and forecast 2023-2028 ($ million)
- Exhibits98: Data Table on China - Market size and forecast 2023-2028 ($ million)
- Exhibits99: Chart on China - Year-over-year growth 2023-2028 (%)
- Exhibits100: Data Table on China - Year-over-year growth 2023-2028 (%)
- Exhibits101: Chart on Germany - Market size and forecast 2023-2028 ($ million)
- Exhibits102: Data Table on Germany - Market size and forecast 2023-2028 ($ million)
- Exhibits103: Chart on Germany - Year-over-year growth 2023-2028 (%)
- Exhibits104: Data Table on Germany - Year-over-year growth 2023-2028 (%)
- Exhibits105: Chart on UK - Market size and forecast 2023-2028 ($ million)
- Exhibits106: Data Table on UK - Market size and forecast 2023-2028 ($ million)
- Exhibits107: Chart on UK - Year-over-year growth 2023-2028 (%)
- Exhibits108: Data Table on UK - Year-over-year growth 2023-2028 (%)
- Exhibits109: Chart on Brazil - Market size and forecast 2023-2028 ($ million)
- Exhibits110: Data Table on Brazil - Market size and forecast 2023-2028 ($ million)
- Exhibits111: Chart on Brazil - Year-over-year growth 2023-2028 (%)
- Exhibits112: Data Table on Brazil - Year-over-year growth 2023-2028 (%)
- Exhibits113: Market opportunity By Geographical Landscape ($ million)
- Exhibits114: Data Tables on Market opportunity By Geographical Landscape ($ million)
- Exhibits115: Impact of drivers and challenges in 2023 and 2028
- Exhibits116: Overview on criticality of inputs and factors of differentiation
- Exhibits117: Overview on factors of disruption
- Exhibits118: Impact of key risks on business
- Exhibits119: Companies covered
- Exhibits120: Matrix on companies position and classification
- Exhibits121: Agar Cleaning Systems Pty Ltd. - Overview
- Exhibits122: Agar Cleaning Systems Pty Ltd. - Product / Service
- Exhibits123: Agar Cleaning Systems Pty Ltd. - Key offerings
- Exhibits124: Amtech UK - Overview
- Exhibits125: Amtech UK - Product / Service
- Exhibits126: Amtech UK - Key offerings
- Exhibits127: Amway Corp. - Overview
- Exhibits128: Amway Corp. - Product / Service
- Exhibits129: Amway Corp. - Key news
- Exhibits130: Amway Corp. - Key offerings
- Exhibits131: Church and Dwight Co. Inc. - Overview
- Exhibits132: Church and Dwight Co. Inc. - Business segments
- Exhibits133: Church and Dwight Co. Inc. - Key offerings
- Exhibits134: Church and Dwight Co. Inc. - Segment focus
- Exhibits135: Godrej Consumer Products Ltd. - Overview
- Exhibits136: Godrej Consumer Products Ltd. - Business segments
- Exhibits137: Godrej Consumer Products Ltd. - Key news
- Exhibits138: Godrej Consumer Products Ltd. - Key offerings
- Exhibits139: Godrej Consumer Products Ltd. - Segment focus
- Exhibits140: Greenology Products Inc. - Overview
- Exhibits141: Greenology Products Inc. - Product / Service
- Exhibits142: Greenology Products Inc. - Key offerings
- Exhibits143: Henkel AG and Co. KGaA - Overview
- Exhibits144: Henkel AG and Co. KGaA - Business segments
- Exhibits145: Henkel AG and Co. KGaA - Key news
- Exhibits146: Henkel AG and Co. KGaA - Key offerings
- Exhibits147: Henkel AG and Co. KGaA - Segment focus
- Exhibits148: Kao Corp. - Overview
- Exhibits149: Kao Corp. - Business segments
- Exhibits150: Kao Corp. - Key news
- Exhibits151: Kao Corp. - Key offerings
- Exhibits152: Kao Corp. - Segment focus
- Exhibits153: Quality Chemicals S.L - Overview
- Exhibits154: Quality Chemicals S.L - Product / Service
- Exhibits155: Quality Chemicals S.L - Key offerings
- Exhibits156: Reckitt Benckiser Group Plc - Overview
- Exhibits157: Reckitt Benckiser Group Plc - Business segments
- Exhibits158: Reckitt Benckiser Group Plc - Key news
- Exhibits159: Reckitt Benckiser Group Plc - Key offerings
- Exhibits160: Reckitt Benckiser Group Plc - Segment focus
- Exhibits161: S.C. Johnson and Son Inc. - Overview
- Exhibits162: S.C. Johnson and Son Inc. - Product / Service
- Exhibits163: S.C. Johnson and Son Inc. - Key offerings
- Exhibits164: Sarex - Overview
- Exhibits165: Sarex - Product / Service
- Exhibits166: Sarex - Key offerings
- Exhibits167: The Clorox Co. - Overview
- Exhibits168: The Clorox Co. - Business segments
- Exhibits169: The Clorox Co. - Key news
- Exhibits170: The Clorox Co. - Key offerings
- Exhibits171: The Clorox Co. - Segment focus
- Exhibits172: The Procter and Gamble Co. - Overview
- Exhibits173: The Procter and Gamble Co. - Business segments
- Exhibits174: The Procter and Gamble Co. - Key news
- Exhibits175: The Procter and Gamble Co. - Key offerings
- Exhibits176: The Procter and Gamble Co. - Segment focus
- Exhibits177: Unilever PLC - Overview
- Exhibits178: Unilever PLC - Business segments
- Exhibits179: Unilever PLC - Key news
- Exhibits180: Unilever PLC - Key offerings
- Exhibits181: Unilever PLC - Segment focus
- Exhibits182: Inclusions checklist
- Exhibits183: Exclusions checklist
- Exhibits184: Currency conversion rates for US$
- Exhibits185: Research methodology
- Exhibits186: Information sources
- Exhibits187: Data validation
- Exhibits188: Validation techniques employed for market sizing
- Exhibits189: Data synthesis
- Exhibits190: 360 degree market analysis
- Exhibits191: List of abbreviations
The stain remover market is forecasted to grow by USD 7250 million during 2023-2028, accelerating at a CAGR of 6.01% during the forecast period. The report on the stain remover market provides a holistic analysis, market size and forecast, trends, growth drivers, and challenges, as well as vendor analysis covering around 25 vendors.
The report offers an up-to-date analysis regarding the current market scenario, the latest trends and drivers, and the overall market environment. The market is driven by growth in the varieties of stain removers available, growing awareness of the importance of laundry hygiene, and increasing focus on innovative packaging options.
Technavio's stain remover market is segmented as below:
| Market Scope | |
|---|---|
| Base Year | 2024 |
| End Year | 2028 |
| Series Year | 2024-2028 |
| Growth Momentum | Accelerate |
| YOY 2024 | 5.31% |
| CAGR | 6.01% |
| Incremental Value | $7250mn |
By Product
- Powder
- Liquid
- Bar
- Others
By End-user
- Residential
- Commercial
By Geographical Landscape
- North America
- APAC
- Europe
- South America
- Middle East and Africa
This study identifies the advent of eco-friendly laundry care products as one of the prime reasons driving the stain remover market growth during the next few years. Also, the introduction of different marketing initiatives to attract customers and boost product awareness and promising demand from developing countries will lead to sizable demand in the market.
The report on the stain remover market covers the following areas:
- Stain remover market sizing
- Stain remover market forecast
- Stain remover market industry analysis
The robust vendor analysis is designed to help clients improve their market position, and in line with this, this report provides a detailed analysis of several leading stain remover market vendors that include Agar Cleaning Systems Pty Ltd., Amtech UK, Amway Corp., CC Holdings Inc., Church and Dwight Co. Inc., Dove Technologies, Future Developments Man Ltd., Godrej Consumer Products Ltd., Greenology Products Inc., Guardsman Industries Ltd., Henkel AG and Co. KGaA, Kao Corp., Mega Electronics Ltd., Quality Chemicals S.L, Reckitt Benckiser Group Plc, S.C. Johnson and Son Inc., Sarex, The Clorox Co., The Procter and Gamble Co., and Unilever PLC. Also, the stain remover market analysis report includes information on upcoming trends and challenges that will influence market growth. This is to help companies strategize and leverage all forthcoming growth opportunities.
The study was conducted using an objective combination of primary and secondary information including inputs from key participants in the industry. The report contains a comprehensive market and vendor landscape in addition to an analysis of the key vendors.
The publisher presents a detailed picture of the market by way of study, synthesis, and summation of data from multiple sources through an analysis of key parameters such as profit, pricing, competition, and promotions. It presents various market facets by identifying the key industry influencers. The data presented is comprehensive, reliable, and a result of extensive research - both primary and secondary. The market research reports provide a complete competitive landscape and an in-depth vendor selection methodology and analysis using qualitative and quantitative research to forecast accurate market growth.
Table of Contents
1 Executive Summary
- 1.1 Market overview
- Executive Summary - Chart on Market Overview
- Executive Summary - Data Table on Market Overview
- Executive Summary - Chart on Global Market Characteristics
- Executive Summary - Chart on Market By Geographical Landscape
- Executive Summary - Chart on Market Segmentation by Product
- Executive Summary - Chart on Market Segmentation by End-user
- Executive Summary - Chart on Incremental Growth
- Executive Summary - Data Table on Incremental Growth
- Executive Summary - Chart on Company Market Positioning
2 Market Landscape
- 2.1 Market ecosystem
- Parent Market
- Data Table on - Parent Market
- 2.2 Market characteristics
- Market characteristics analysis
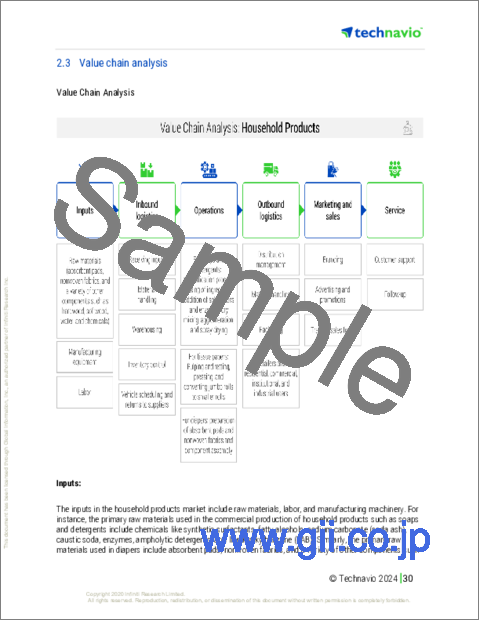
- 2.3 Value chain analysis
- Value Chain Analysis
3 Market Sizing
- 3.1 Market definition
- Offerings of companies included in the market definition
- 3.2 Market segment analysis
- Market segments
- 3.3 Market size 2023
- 3.4 Market outlook: Forecast for 2023-2028
- Chart on Global - Market size and forecast 2023-2028 ($ million)
- Data Table on Global - Market size and forecast 2023-2028 ($ million)
- Chart on Global Market: Year-over-year growth 2023-2028 (%)
- Data Table on Global Market: Year-over-year growth 2023-2028 (%)
4 Historic Market Size
- 4.1 Global Stain Remover Market 2018 - 2022
- Historic Market Size - Data Table on Global Stain Remover Market 2018 - 2022 ($ million)
- 4.2 Product segment analysis 2018 - 2022
- Historic Market Size - Product Segment 2018 - 2022 ($ million)
- 4.3 End-user segment analysis 2018 - 2022
- Historic Market Size - End-user Segment 2018 - 2022 ($ million)
- 4.4 Geography segment analysis 2018 - 2022
- Historic Market Size - Geography Segment 2018 - 2022 ($ million)
- 4.5 Country segment analysis 2018 - 2022
- Historic Market Size - Country Segment 2018 - 2022 ($ million)
5 Five Forces Analysis
- 5.1 Five forces summary
- Five forces analysis - Comparison between 2023 and 2028
- 5.2 Bargaining power of buyers
- Bargaining power of buyers - Impact of key factors 2023 and 2028
- 5.3 Bargaining power of suppliers
- Bargaining power of suppliers - Impact of key factors in 2023 and 2028
- 5.4 Threat of new entrants
- Threat of new entrants - Impact of key factors in 2023 and 2028
- 5.5 Threat of substitutes
- Threat of substitutes - Impact of key factors in 2023 and 2028
- 5.6 Threat of rivalry
- Threat of rivalry - Impact of key factors in 2023 and 2028
- 5.7 Market condition
- Chart on Market condition - Five forces 2023 and 2028
6 Market Segmentation by Product
- 6.1 Market segments
- Chart on Product - Market share 2023-2028 (%)
- Data Table on Product - Market share 2023-2028 (%)
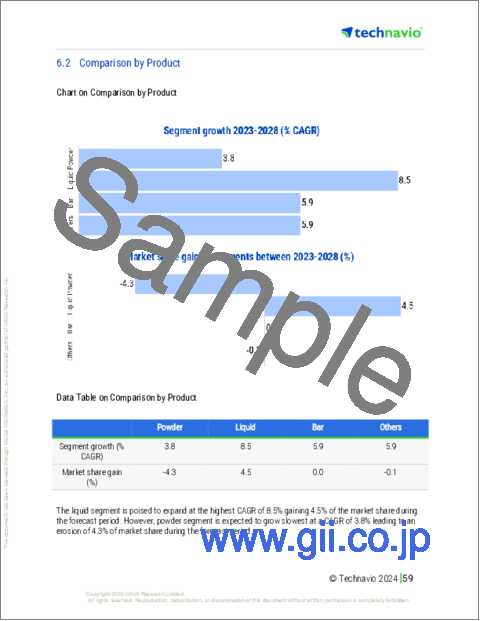
- 6.2 Comparison by Product
- Chart on Comparison by Product
- Data Table on Comparison by Product
- 6.3 Powder - Market size and forecast 2023-2028
- Chart on Powder - Market size and forecast 2023-2028 ($ million)
- Data Table on Powder - Market size and forecast 2023-2028 ($ million)
- Chart on Powder - Year-over-year growth 2023-2028 (%)
- Data Table on Powder - Year-over-year growth 2023-2028 (%)
- 6.4 Liquid - Market size and forecast 2023-2028
- Chart on Liquid - Market size and forecast 2023-2028 ($ million)
- Data Table on Liquid - Market size and forecast 2023-2028 ($ million)
- Chart on Liquid - Year-over-year growth 2023-2028 (%)
- Data Table on Liquid - Year-over-year growth 2023-2028 (%)
- 6.5 Bar - Market size and forecast 2023-2028
- Chart on Bar - Market size and forecast 2023-2028 ($ million)
- Data Table on Bar - Market size and forecast 2023-2028 ($ million)
- Chart on Bar - Year-over-year growth 2023-2028 (%)
- Data Table on Bar - Year-over-year growth 2023-2028 (%)
- 6.6 Others - Market size and forecast 2023-2028
- Chart on Others - Market size and forecast 2023-2028 ($ million)
- Data Table on Others - Market size and forecast 2023-2028 ($ million)
- Chart on Others - Year-over-year growth 2023-2028 (%)
- Data Table on Others - Year-over-year growth 2023-2028 (%)
- 6.7 Market opportunity by Product
- Market opportunity by Product ($ million)
- Data Table on Market opportunity by Product ($ million)
7 Market Segmentation by End-user
- 7.1 Market segments
- Chart on End-user - Market share 2023-2028 (%)
- Data Table on End-user - Market share 2023-2028 (%)
- 7.2 Comparison by End-user
- Chart on Comparison by End-user
- Data Table on Comparison by End-user
- 7.3 Residential - Market size and forecast 2023-2028
- Chart on Residential - Market size and forecast 2023-2028 ($ million)
- Data Table on Residential - Market size and forecast 2023-2028 ($ million)
- Chart on Residential - Year-over-year growth 2023-2028 (%)
- Data Table on Residential - Year-over-year growth 2023-2028 (%)
- 7.4 Commercial - Market size and forecast 2023-2028
- Chart on Commercial - Market size and forecast 2023-2028 ($ million)
- Data Table on Commercial - Market size and forecast 2023-2028 ($ million)
- Chart on Commercial - Year-over-year growth 2023-2028 (%)
- Data Table on Commercial - Year-over-year growth 2023-2028 (%)
- 7.5 Market opportunity by End-user
- Market opportunity by End-user ($ million)
- Data Table on Market opportunity by End-user ($ million)
8 Customer Landscape
- 8.1 Customer landscape overview
- Analysis of price sensitivity, lifecycle, customer purchase basket, adoption rates, and purchase criteria
9 Geographic Landscape
- 9.1 Geographic segmentation
- Chart on Market share By Geographical Landscape 2023-2028 (%)
- Data Table on Market share By Geographical Landscape 2023-2028 (%)
- 9.2 Geographic comparison
- Chart on Geographic comparison
- Data Table on Geographic comparison
- 9.3 North America - Market size and forecast 2023-2028
- Chart on North America - Market size and forecast 2023-2028 ($ million)
- Data Table on North America - Market size and forecast 2023-2028 ($ million)
- Chart on North America - Year-over-year growth 2023-2028 (%)
- Data Table on North America - Year-over-year growth 2023-2028 (%)
- 9.4 APAC - Market size and forecast 2023-2028
- Chart on APAC - Market size and forecast 2023-2028 ($ million)
- Data Table on APAC - Market size and forecast 2023-2028 ($ million)
- Chart on APAC - Year-over-year growth 2023-2028 (%)
- Data Table on APAC - Year-over-year growth 2023-2028 (%)
- 9.5 Europe - Market size and forecast 2023-2028
- Chart on Europe - Market size and forecast 2023-2028 ($ million)
- Data Table on Europe - Market size and forecast 2023-2028 ($ million)
- Chart on Europe - Year-over-year growth 2023-2028 (%)
- Data Table on Europe - Year-over-year growth 2023-2028 (%)
- 9.6 South America - Market size and forecast 2023-2028
- Chart on South America - Market size and forecast 2023-2028 ($ million)
- Data Table on South America - Market size and forecast 2023-2028 ($ million)
- Chart on South America - Year-over-year growth 2023-2028 (%)
- Data Table on South America - Year-over-year growth 2023-2028 (%)
- 9.7 Middle East and Africa - Market size and forecast 2023-2028
- Chart on Middle East and Africa - Market size and forecast 2023-2028 ($ million)
- Data Table on Middle East and Africa - Market size and forecast 2023-2028 ($ million)
- Chart on Middle East and Africa - Year-over-year growth 2023-2028 (%)
- Data Table on Middle East and Africa - Year-over-year growth 2023-2028 (%)
- 9.8 US - Market size and forecast 2023-2028
- Chart on US - Market size and forecast 2023-2028 ($ million)
- Data Table on US - Market size and forecast 2023-2028 ($ million)
- Chart on US - Year-over-year growth 2023-2028 (%)
- Data Table on US - Year-over-year growth 2023-2028 (%)
- 9.9 China - Market size and forecast 2023-2028
- Chart on China - Market size and forecast 2023-2028 ($ million)
- Data Table on China - Market size and forecast 2023-2028 ($ million)
- Chart on China - Year-over-year growth 2023-2028 (%)
- Data Table on China - Year-over-year growth 2023-2028 (%)
- 9.10 Germany - Market size and forecast 2023-2028
- Chart on Germany - Market size and forecast 2023-2028 ($ million)
- Data Table on Germany - Market size and forecast 2023-2028 ($ million)
- Chart on Germany - Year-over-year growth 2023-2028 (%)
- Data Table on Germany - Year-over-year growth 2023-2028 (%)
- 9.11 UK - Market size and forecast 2023-2028
- Chart on UK - Market size and forecast 2023-2028 ($ million)
- Data Table on UK - Market size and forecast 2023-2028 ($ million)
- Chart on UK - Year-over-year growth 2023-2028 (%)
- Data Table on UK - Year-over-year growth 2023-2028 (%)
- 9.12 Brazil - Market size and forecast 2023-2028
- Chart on Brazil - Market size and forecast 2023-2028 ($ million)
- Data Table on Brazil - Market size and forecast 2023-2028 ($ million)
- Chart on Brazil - Year-over-year growth 2023-2028 (%)
- Data Table on Brazil - Year-over-year growth 2023-2028 (%)
- 9.13 Market opportunity By Geographical Landscape
- Market opportunity By Geographical Landscape ($ million)
- Data Tables on Market opportunity By Geographical Landscape ($ million)
10 Drivers, Challenges, and Opportunity/Restraints
- 10.1 Market drivers
- 10.2 Market challenges
- 10.3 Impact of drivers and challenges
- Impact of drivers and challenges in 2023 and 2028
- 10.4 Market opportunities/restraints
11 Competitive Landscape
- 11.1 Overview
- 11.2 Competitive Landscape
- Overview on criticality of inputs and factors of differentiation
- 11.3 Landscape disruption
- Overview on factors of disruption
- 11.4 Industry risks
- Impact of key risks on business
12 Competitive Analysis
- 12.1 Companies profiled
- Companies covered
- 12.2 Market positioning of companies
- Matrix on companies position and classification
- 12.3 Agar Cleaning Systems Pty Ltd.
- Agar Cleaning Systems Pty Ltd. - Overview
- Agar Cleaning Systems Pty Ltd. - Product / Service
- Agar Cleaning Systems Pty Ltd. - Key offerings
- 12.4 Amtech UK
- Amtech UK - Overview
- Amtech UK - Product / Service
- Amtech UK - Key offerings
- 12.5 Amway Corp.
- Amway Corp. - Overview
- Amway Corp. - Product / Service
- Amway Corp. - Key news
- Amway Corp. - Key offerings
- 12.6 Church and Dwight Co. Inc.
- Church and Dwight Co. Inc. - Overview
- Church and Dwight Co. Inc. - Business segments
- Church and Dwight Co. Inc. - Key offerings
- Church and Dwight Co. Inc. - Segment focus
- 12.7 Godrej Consumer Products Ltd.
- Godrej Consumer Products Ltd. - Overview
- Godrej Consumer Products Ltd. - Business segments
- Godrej Consumer Products Ltd. - Key news
- Godrej Consumer Products Ltd. - Key offerings
- Godrej Consumer Products Ltd. - Segment focus
- 12.8 Greenology Products Inc.
- Greenology Products Inc. - Overview
- Greenology Products Inc. - Product / Service
- Greenology Products Inc. - Key offerings
- 12.9 Henkel AG and Co. KGaA
- Henkel AG and Co. KGaA - Overview
- Henkel AG and Co. KGaA - Business segments
- Henkel AG and Co. KGaA - Key news
- Henkel AG and Co. KGaA - Key offerings
- Henkel AG and Co. KGaA - Segment focus
- 12.10 Kao Corp.
- Kao Corp. - Overview
- Kao Corp. - Business segments
- Kao Corp. - Key news
- Kao Corp. - Key offerings
- Kao Corp. - Segment focus
- 12.11 Quality Chemicals S.L
- Quality Chemicals S.L - Overview
- Quality Chemicals S.L - Product / Service
- Quality Chemicals S.L - Key offerings
- 12.12 Reckitt Benckiser Group Plc
- Reckitt Benckiser Group Plc - Overview
- Reckitt Benckiser Group Plc - Business segments
- Reckitt Benckiser Group Plc - Key news
- Reckitt Benckiser Group Plc - Key offerings
- Reckitt Benckiser Group Plc - Segment focus
- 12.13 S.C. Johnson and Son Inc.
- S.C. Johnson and Son Inc. - Overview
- S.C. Johnson and Son Inc. - Product / Service
- S.C. Johnson and Son Inc. - Key offerings
- 12.14 Sarex
- Sarex - Overview
- Sarex - Product / Service
- Sarex - Key offerings
- 12.15 The Clorox Co.
- The Clorox Co. - Overview
- The Clorox Co. - Business segments
- The Clorox Co. - Key news
- The Clorox Co. - Key offerings
- The Clorox Co. - Segment focus
- 12.16 The Procter and Gamble Co.
- The Procter and Gamble Co. - Overview
- The Procter and Gamble Co. - Business segments
- The Procter and Gamble Co. - Key news
- The Procter and Gamble Co. - Key offerings
- The Procter and Gamble Co. - Segment focus
- 12.17 Unilever PLC
- Unilever PLC - Overview
- Unilever PLC - Business segments
- Unilever PLC - Key news
- Unilever PLC - Key offerings
- Unilever PLC - Segment focus
13 Appendix
- 13.1 Scope of the report
- 13.2 Inclusions and exclusions checklist
- Inclusions checklist
- Exclusions checklist
- 13.3 Currency conversion rates for US$
- Currency conversion rates for US$
- 13.4 Research methodology
- Research methodology
- 13.5 Data procurement
- Information sources
- 13.6 Data validation
- Data validation
- 13.7 Validation techniques employed for market sizing
- Validation techniques employed for market sizing
- 13.8 Data synthesis
- Data synthesis
- 360 degree market analysis
- 360 degree market analysis
- 13.10 List of abbreviations
- List of abbreviations

