|
|
市場調査レポート
商品コード
1462486
酪酸の世界市場 2024-2028Global Butyric Acid Market 2024-2028 |
||||||
|
|||||||
カスタマイズ可能
|
|||||||


| 酪酸の世界市場 2024-2028 |
|
出版日: 2024年03月28日
発行: TechNavio
ページ情報: 英文 169 Pages
納期: 即納可能
|

全表示
- 概要
- 図表
- 目次
酪酸市場は2023-2028年に2億2,159万米ドル、予測期間中のCAGRは9.7%で成長すると予測されます。
当レポートでは、酪酸市場の全体的な分析、市場規模・予測、動向、成長促進要因、課題、約25のベンダーを網羅したベンダー分析などを掲載しています。
現在の市場シナリオ、最新動向と促進要因、市場環境全体に関する最新分析を提供しています。市場は、胃腸疾患の罹患率の増加、動物飼料用途の酪酸の需要拡大、加工食品における食品風味物質の需要増加によって牽引されています。
| 市場範囲 | |
|---|---|
| 基準年 | 2024 |
| 終了年 | 2028 |
| 予測期間 | 2024-2028 |
| 成長モメンタム | 加速 |
| 前年比2024年 | 8.8% |
| CAGR | 9.7% |
| 増分額 | 2億2,159万米ドル |
本調査では、今後数年間の酪酸市場の成長を促進する主な要因の一つとして、バイオ由来のバイオ燃料における酪酸の新たな使用を挙げています。また、市場ベンダーによる新製品発売の増加や、市場ベンダー間のM&Aの増加も、市場の大きな需要につながると思われます。
目次
第1章 エグゼクティブサマリー
- 市場概要
第2章 市場情勢
- 市場エコシステム
第3章 市場規模の評価
- 市場の定義
- 市場セグメント分析
- 市場規模 2023
- 市場の見通し 2023-2028
第4章 市場規模実績
- 酪酸の世界市場 2018-2022
- 用途別セグメント分析 2018-2022
- タイプセグメント分析 2018-2022
- 地域別セグメント分析 2018-2022
- 国別セグメント分析 2018-2022
第5章 ファイブフォース分析
- ファイブフォースの要約
- 買い手の交渉力
- 供給企業の交渉力
- 新規参入業者の脅威
- 代替品の脅威
- 競争の脅威
- 市況
第6章 市場セグメンテーション:用途別
- 市場セグメント
- 比較:用途別
- 動物飼料:市場規模と予測 2023-2028
- 食品とフレーバー:市場規模と予測 2023-2028
- 医薬品:市場規模と予測 2023-2028
- 化学中間体:市場規模と予測 2023-2028
- その他:市場規模と予測 2023-2028
- 市場機会:用途別
第7章 市場セグメンテーション:タイプ別
- 市場セグメント
- 比較:タイプ別
- 合成:市場規模と予測 2023-2028
- 再生可能:市場規模と予測 2023-2028
- 市場機会:タイプ別
第8章 顧客情勢
- 顧客情勢の概要
第9章 地域別情勢
- 地域別セグメンテーション
- 地域別比較
- アジア太平洋:市場規模と予測 2023-2028
- 北米:市場規模と予測 2023-2028
- 欧州:市場規模と予測 2023-2028
- 南米:市場規模と予測 2023-2028
- 中東・アフリカ:市場規模と予測 2023-2028
- 米国:市場規模と予測 2023-2028
- 中国:市場規模と予測 2023-2028
- ドイツ:市場規模と予測 2023-2028
- インド:市場規模と予測 2023-2028
- ブラジル:市場規模と予測 2023-2028
- 市場機会:地域情勢別
第10章 促進要因、課題、および動向
- 市場促進要因
- 市場の課題
- 促進要因と課題の影響
- 市場動向
第11章 ベンダー情勢
- 概要
- ベンダー情勢
- 混乱の状況
- 業界のリスク
第12章 ベンダー分析
- 対象ベンダー
- ベンダーの市場ポジショニング
- AFYREN
- ARVESTA BV
- Central Drug House
- Eastman Chemical Co.
- Ennore India Chemical International
- Hefei TNJ Chemical Industry Co. Ltd.
- Kemin Industries Inc.
- KUNSHAN ODOWELL CO. LTD.
- Merck KGaA
- METabolic EXplorer SA
- OQ SAOC
- PETRONAS Chemicals Group Berhad
- Shri Rajaram Chemicals and Engg
- Tokyo Chemical Industry Co. Ltd.
- Yufeng International Group Co. Ltd.
第13章 付録
Exhibits:
- Exhibits1: Executive Summary - Chart on Market Overview
- Exhibits2: Executive Summary - Data Table on Market Overview
- Exhibits3: Executive Summary - Chart on Global Market Characteristics
- Exhibits4: Executive Summary - Chart on Market By Geographical Landscape
- Exhibits5: Executive Summary - Chart on Market Segmentation by Application
- Exhibits6: Executive Summary - Chart on Market Segmentation by Type
- Exhibits7: Executive Summary - Chart on Incremental Growth
- Exhibits8: Executive Summary - Data Table on Incremental Growth
- Exhibits9: Executive Summary - Chart on Vendor Market Positioning
- Exhibits10: Parent market
- Exhibits11: Market Characteristics
- Exhibits12: Offerings of vendors included in the market definition
- Exhibits13: Market segments
- Exhibits14: Chart on Global - Market size and forecast 2023-2028 ($ million)
- Exhibits15: Data Table on Global - Market size and forecast 2023-2028 ($ million)
- Exhibits16: Chart on Global Market: Year-over-year growth 2023-2028 (%)
- Exhibits17: Data Table on Global Market: Year-over-year growth 2023-2028 (%)
- Exhibits18: Historic Market Size - Data Table on global butyric acid market 2018 - 2022 ($ million)
- Exhibits19: Historic Market Size - Application Segment 2018 - 2022 ($ million)
- Exhibits20: Historic Market Size - Type Segment 2018 - 2022 ($ million)
- Exhibits21: Historic Market Size - Geography Segment 2018 - 2022 ($ million)
- Exhibits22: Historic Market Size - Country Segment 2018 - 2022 ($ million)
- Exhibits23: Five forces analysis - Comparison between 2023 and 2028
- Exhibits24: Chart on Bargaining power of buyers - Impact of key factors 2023 and 2028
- Exhibits25: Bargaining power of suppliers - Impact of key factors in 2023 and 2028
- Exhibits26: Threat of new entrants - Impact of key factors in 2023 and 2028
- Exhibits27: Threat of substitutes - Impact of key factors in 2023 and 2028
- Exhibits28: Threat of rivalry - Impact of key factors in 2023 and 2028
- Exhibits29: Chart on Market condition - Five forces 2023 and 2028
- Exhibits30: Chart on Application - Market share 2023-2028 (%)
- Exhibits31: Data Table on Application - Market share 2023-2028 (%)
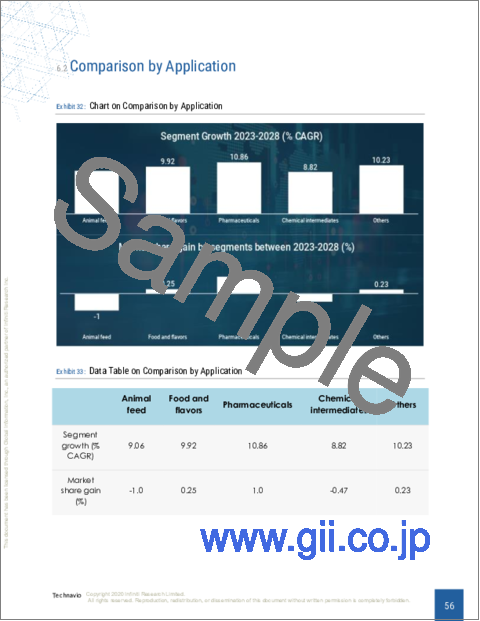
- Exhibits32: Chart on Comparison by Application
- Exhibits33: Data Table on Comparison by Application
- Exhibits34: Chart on Animal feed - Market size and forecast 2023-2028 ($ million)
- Exhibits35: Data Table on Animal feed - Market size and forecast 2023-2028 ($ million)
- Exhibits36: Chart on Animal feed - Year-over-year growth 2023-2028 (%)
- Exhibits37: Data Table on Animal feed - Year-over-year growth 2023-2028 (%)
- Exhibits38: Chart on Food and flavors - Market size and forecast 2023-2028 ($ million)
- Exhibits39: Data Table on Food and flavors - Market size and forecast 2023-2028 ($ million)
- Exhibits40: Chart on Food and flavors - Year-over-year growth 2023-2028 (%)
- Exhibits41: Data Table on Food and flavors - Year-over-year growth 2023-2028 (%)
- Exhibits42: Chart on Pharmaceuticals - Market size and forecast 2023-2028 ($ million)
- Exhibits43: Data Table on Pharmaceuticals - Market size and forecast 2023-2028 ($ million)
- Exhibits44: Chart on Pharmaceuticals - Year-over-year growth 2023-2028 (%)
- Exhibits45: Data Table on Pharmaceuticals - Year-over-year growth 2023-2028 (%)
- Exhibits46: Chart on Chemical intermediates - Market size and forecast 2023-2028 ($ million)
- Exhibits47: Data Table on Chemical intermediates - Market size and forecast 2023-2028 ($ million)
- Exhibits48: Chart on Chemical intermediates - Year-over-year growth 2023-2028 (%)
- Exhibits49: Data Table on Chemical intermediates - Year-over-year growth 2023-2028 (%)
- Exhibits50: Chart on Others - Market size and forecast 2023-2028 ($ million)
- Exhibits51: Data Table on Others - Market size and forecast 2023-2028 ($ million)
- Exhibits52: Chart on Others - Year-over-year growth 2023-2028 (%)
- Exhibits53: Data Table on Others - Year-over-year growth 2023-2028 (%)
- Exhibits54: Market opportunity by Application ($ million)
- Exhibits55: Data Table on Market opportunity by Application ($ million)
- Exhibits56: Chart on Type - Market share 2023-2028 (%)
- Exhibits57: Data Table on Type - Market share 2023-2028 (%)
- Exhibits58: Chart on Comparison by Type
- Exhibits59: Data Table on Comparison by Type
- Exhibits60: Chart on Synthetic - Market size and forecast 2023-2028 ($ million)
- Exhibits61: Data Table on Synthetic - Market size and forecast 2023-2028 ($ million)
- Exhibits62: Chart on Synthetic - Year-over-year growth 2023-2028 (%)
- Exhibits63: Data Table on Synthetic - Year-over-year growth 2023-2028 (%)
- Exhibits64: Chart on Renewable - Market size and forecast 2023-2028 ($ million)
- Exhibits65: Data Table on Renewable - Market size and forecast 2023-2028 ($ million)
- Exhibits66: Chart on Renewable - Year-over-year growth 2023-2028 (%)
- Exhibits67: Data Table on Renewable - Year-over-year growth 2023-2028 (%)
- Exhibits68: Market opportunity by Type ($ million)
- Exhibits69: Data Table on Market opportunity by Type ($ million)
- Exhibits70: Analysis of price sensitivity, lifecycle, customer purchase basket, adoption rates, and purchase criteria
- Exhibits71: Chart on Market share By Geographical Landscape 2023-2028 (%)
- Exhibits72: Data Table on Market share By Geographical Landscape 2023-2028 (%)
- Exhibits73: Chart on Geographic comparison
- Exhibits74: Data Table on Geographic comparison
- Exhibits75: Chart on APAC - Market size and forecast 2023-2028 ($ million)
- Exhibits76: Data Table on APAC - Market size and forecast 2023-2028 ($ million)
- Exhibits77: Chart on APAC - Year-over-year growth 2023-2028 (%)
- Exhibits78: Data Table on APAC - Year-over-year growth 2023-2028 (%)
- Exhibits79: Chart on North America - Market size and forecast 2023-2028 ($ million)
- Exhibits80: Data Table on North America - Market size and forecast 2023-2028 ($ million)
- Exhibits81: Chart on North America - Year-over-year growth 2023-2028 (%)
- Exhibits82: Data Table on North America - Year-over-year growth 2023-2028 (%)
- Exhibits83: Chart on Europe - Market size and forecast 2023-2028 ($ million)
- Exhibits84: Data Table on Europe - Market size and forecast 2023-2028 ($ million)
- Exhibits85: Chart on Europe - Year-over-year growth 2023-2028 (%)
- Exhibits86: Data Table on Europe - Year-over-year growth 2023-2028 (%)
- Exhibits87: Chart on South America - Market size and forecast 2023-2028 ($ million)
- Exhibits88: Data Table on South America - Market size and forecast 2023-2028 ($ million)
- Exhibits89: Chart on South America - Year-over-year growth 2023-2028 (%)
- Exhibits90: Data Table on South America - Year-over-year growth 2023-2028 (%)
- Exhibits91: Chart on Middle East and Africa - Market size and forecast 2023-2028 ($ million)
- Exhibits92: Data Table on Middle East and Africa - Market size and forecast 2023-2028 ($ million)
- Exhibits93: Chart on Middle East and Africa - Year-over-year growth 2023-2028 (%)
- Exhibits94: Data Table on Middle East and Africa - Year-over-year growth 2023-2028 (%)
- Exhibits95: Chart on US - Market size and forecast 2023-2028 ($ million)
- Exhibits96: Data Table on US - Market size and forecast 2023-2028 ($ million)
- Exhibits97: Chart on US - Year-over-year growth 2023-2028 (%)
- Exhibits98: Data Table on US - Year-over-year growth 2023-2028 (%)
- Exhibits99: Chart on China - Market size and forecast 2023-2028 ($ million)
- Exhibits100: Data Table on China - Market size and forecast 2023-2028 ($ million)
- Exhibits101: Chart on China - Year-over-year growth 2023-2028 (%)
- Exhibits102: Data Table on China - Year-over-year growth 2023-2028 (%)
- Exhibits103: Chart on Germany - Market size and forecast 2023-2028 ($ million)
- Exhibits104: Data Table on Germany - Market size and forecast 2023-2028 ($ million)
- Exhibits105: Chart on Germany - Year-over-year growth 2023-2028 (%)
- Exhibits106: Data Table on Germany - Year-over-year growth 2023-2028 (%)
- Exhibits107: Chart on India - Market size and forecast 2023-2028 ($ million)
- Exhibits108: Data Table on India - Market size and forecast 2023-2028 ($ million)
- Exhibits109: Chart on India - Year-over-year growth 2023-2028 (%)
- Exhibits110: Data Table on India - Year-over-year growth 2023-2028 (%)
- Exhibits111: Chart on Brazil - Market size and forecast 2023-2028 ($ million)
- Exhibits112: Data Table on Brazil - Market size and forecast 2023-2028 ($ million)
- Exhibits113: Chart on Brazil - Year-over-year growth 2023-2028 (%)
- Exhibits114: Data Table on Brazil - Year-over-year growth 2023-2028 (%)
- Exhibits115: Market opportunity By Geographical Landscape ($ million)
- Exhibits116: Data Tables on Market opportunity By Geographical Landscape ($ million)
- Exhibits117: Impact of drivers and challenges in 2023 and 2028
- Exhibits118: Overview on Criticality of inputs and Factors of differentiation
- Exhibits119: Overview on factors of disruption
- Exhibits120: Impact of key risks on business
- Exhibits121: Vendors covered
- Exhibits122: Matrix on vendor position and classification
- Exhibits123: AFYREN - Overview
- Exhibits124: AFYREN - Product / Service
- Exhibits125: AFYREN - Key offerings
- Exhibits126: ARVESTA BV - Overview
- Exhibits127: ARVESTA BV - Product / Service
- Exhibits128: ARVESTA BV - Key offerings
- Exhibits129: Central Drug House - Overview
- Exhibits130: Central Drug House - Product / Service
- Exhibits131: Central Drug House - Key offerings
- Exhibits132: Eastman Chemical Co. - Overview
- Exhibits133: Eastman Chemical Co. - Business segments
- Exhibits134: Eastman Chemical Co. - Key news
- Exhibits135: Eastman Chemical Co. - Key offerings
- Exhibits136: Eastman Chemical Co. - Segment focus
- Exhibits137: Ennore India Chemical International - Overview
- Exhibits138: Ennore India Chemical International - Product / Service
- Exhibits139: Ennore India Chemical International - Key offerings
- Exhibits140: Hefei TNJ Chemical Industry Co. Ltd. - Overview
- Exhibits141: Hefei TNJ Chemical Industry Co. Ltd. - Product / Service
- Exhibits142: Hefei TNJ Chemical Industry Co. Ltd. - Key offerings
- Exhibits143: Kemin Industries Inc. - Overview
- Exhibits144: Kemin Industries Inc. - Product / Service
- Exhibits145: Kemin Industries Inc. - Key offerings
- Exhibits146: KUNSHAN ODOWELL CO. LTD. - Overview
- Exhibits147: KUNSHAN ODOWELL CO. LTD. - Product / Service
- Exhibits148: KUNSHAN ODOWELL CO. LTD. - Key offerings
- Exhibits149: Merck KGaA - Overview
- Exhibits150: Merck KGaA - Business segments
- Exhibits151: Merck KGaA - Key news
- Exhibits152: Merck KGaA - Key offerings
- Exhibits153: Merck KGaA - Segment focus
- Exhibits154: METabolic EXplorer SA - Overview
- Exhibits155: METabolic EXplorer SA - Product / Service
- Exhibits156: METabolic EXplorer SA - Key offerings
- Exhibits157: OQ SAOC - Overview
- Exhibits158: OQ SAOC - Product / Service
- Exhibits159: OQ SAOC - Key offerings
- Exhibits160: PETRONAS Chemicals Group Berhad - Overview
- Exhibits161: PETRONAS Chemicals Group Berhad - Business segments
- Exhibits162: PETRONAS Chemicals Group Berhad - Key news
- Exhibits163: PETRONAS Chemicals Group Berhad - Key offerings
- Exhibits164: PETRONAS Chemicals Group Berhad - Segment focus
- Exhibits165: Shri Rajaram Chemicals and Engg - Overview
- Exhibits166: Shri Rajaram Chemicals and Engg - Product / Service
- Exhibits167: Shri Rajaram Chemicals and Engg - Key offerings
- Exhibits168: Tokyo Chemical Industry Co. Ltd. - Overview
- Exhibits169: Tokyo Chemical Industry Co. Ltd. - Product / Service
- Exhibits170: Tokyo Chemical Industry Co. Ltd. - Key offerings
- Exhibits171: Yufeng International Group Co. Ltd. - Overview
- Exhibits172: Yufeng International Group Co. Ltd. - Product / Service
- Exhibits173: Yufeng International Group Co. Ltd. - Key offerings
- Exhibits174: Inclusions checklist
- Exhibits175: Exclusions checklist
- Exhibits176: Currency conversion rates for US$
- Exhibits177: Research methodology
- Exhibits178: Validation techniques employed for market sizing
- Exhibits179: Information sources
- Exhibits180: List of abbreviations
The butyric acid market is forecasted to grow by USD 221.59 mn during 2023-2028, accelerating at a CAGR of 9.7% during the forecast period. The report on the butyric acid market provides a holistic analysis, market size and forecast, trends, growth drivers, and challenges, as well as vendor analysis covering around 25 vendors.
The report offers an up-to-date analysis regarding the current market scenario, the latest trends and drivers, and the overall market environment. The market is driven by increasing incidence of gastrointestinal diseases, growing demand for butyric acid for animal feed applications, and increasing demand for food flavoring substances in processed foods.
Technavio's butyric acid market is segmented as below:
| Market Scope | |
|---|---|
| Base Year | 2024 |
| End Year | 2028 |
| Series Year | 2024-2028 |
| Growth Momentum | Accelerate |
| YOY 2024 | 8.8% |
| CAGR | 9.7% |
| Incremental Value | $221.59mn |
By Application
- Animal feed
- Food and flavors
- Pharmaceuticals
- Chemical intermediates
- Others
By Type
- Synthetic
- Renewable
By Geographical Landscape
- APAC
- North America
- Europe
- South America
- Middle East and Africa
This study identifies the emerging use of butyric acid in bio-derived biofuels as one of the prime reasons driving the butyric acid market growth during the next few years. Also, rise in number of new product launches by market vendors and increasing number of M and A among market vendors will lead to sizable demand in the market.
The report on the butyric acid market covers the following areas:
- Butyric acid market sizing
- Butyric acid market forecast
- Butyric acid market industry analysis
The robust vendor analysis is designed to help clients improve their market position, and in line with this, this report provides a detailed analysis of several leading butyric acid market vendors that include AFYREN, ARVESTA BV, Central Drug House, Eastman Chemical Co., Ennore India Chemical International, Hefei TNJ Chemical Industry Co. Ltd., Kemin Industries Inc., KUNSHAN ODOWELL CO. LTD., Merck KGaA, METabolic EXplorer SA, Muby Chemicals, National Analytical Corp., OQ SAOC, Payal Impex, PEEKAY AGENCIES PVT. LTD., PETRONAS Chemicals Group Berhad, Shri Rajaram Chemicals and Engg, Tokyo Chemical Industry Co. Ltd., Vizag Chemical International, and Yufeng International Group Co. Ltd.. Also, the butyric acid market analysis report includes information on upcoming trends and challenges that will influence market growth. This is to help companies strategize and leverage all forthcoming growth opportunities.
The study was conducted using an objective combination of primary and secondary information including inputs from key participants in the industry. The report contains a comprehensive market and vendor landscape in addition to an analysis of the key vendors.
The publisher presents a detailed picture of the market by the way of study, synthesis, and summation of data from multiple sources by an analysis of key parameters such as profit, pricing, competition, and promotions. It presents various market facets by identifying the key industry influencers. The data presented is comprehensive, reliable, and a result of extensive research - both primary and secondary. The market research reports provide a complete competitive landscape and an in-depth vendor selection methodology and analysis using qualitative and quantitative research to forecast the accurate market growth.
Table of Contents
1 Executive Summary
- 1.1 Market overview
2 Market Landscape
- 2.1 Market ecosystem
3 Market Sizing
- 3.1 Market definition
- 3.2 Market segment analysis
- 3.3 Market size 2023
- 3.4 Market outlook: Forecast for 2023-2028
4 Historic Market Size
- 4.1 Global butyric acid market 2018 - 2022
- 4.2 Application Segment Analysis 2018 - 2022
- 4.3 Type Segment Analysis 2018 - 2022
- 4.4 Geography Segment Analysis 2018 - 2022
- 4.5 Country Segment Analysis 2018 - 2022
5 Five Forces Analysis
- 5.1 Five forces summary
- 5.2 Bargaining power of buyers
- 5.3 Bargaining power of suppliers
- 5.4 Threat of new entrants
- 5.5 Threat of substitutes
- 5.6 Threat of rivalry
- 5.7 Market condition
6 Market Segmentation by Application
- 6.1 Market segments
- 6.2 Comparison by Application
- 6.3 Animal feed - Market size and forecast 2023-2028
- 6.4 Food and flavors - Market size and forecast 2023-2028
- 6.5 Pharmaceuticals - Market size and forecast 2023-2028
- 6.6 Chemical intermediates - Market size and forecast 2023-2028
- 6.7 Others - Market size and forecast 2023-2028
- 6.8 Market opportunity by Application
7 Market Segmentation by Type
- 7.1 Market segments
- 7.2 Comparison by Type
- 7.3 Synthetic - Market size and forecast 2023-2028
- 7.4 Renewable - Market size and forecast 2023-2028
- 7.5 Market opportunity by Type
8 Customer Landscape
- 8.1 Customer landscape overview
9 Geographic Landscape
- 9.1 Geographic segmentation
- 9.2 Geographic comparison
- 9.3 APAC - Market size and forecast 2023-2028
- 9.4 North America - Market size and forecast 2023-2028
- 9.5 Europe - Market size and forecast 2023-2028
- 9.6 South America - Market size and forecast 2023-2028
- 9.7 Middle East and Africa - Market size and forecast 2023-2028
- 9.8 US - Market size and forecast 2023-2028
- 9.9 China - Market size and forecast 2023-2028
- 9.10 Germany - Market size and forecast 2023-2028
- 9.11 India - Market size and forecast 2023-2028
- 9.12 Brazil - Market size and forecast 2023-2028
- 9.13 Market opportunity By Geographical Landscape
10 Drivers, Challenges, and Trends
- 10.1 Market drivers
- 10.2 Market challenges
- 10.3 Impact of drivers and challenges
- 10.4 Market trends
11 Vendor Landscape
- 11.1 Overview
- 11.2 Vendor landscape
- 11.3 Landscape disruption
- 11.4 Industry risks
12 Vendor Analysis
- 12.1 Vendors covered
- 12.2 Market positioning of vendors
- 12.3 AFYREN
- 12.4 ARVESTA BV
- 12.5 Central Drug House
- 12.6 Eastman Chemical Co.
- 12.7 Ennore India Chemical International
- 12.8 Hefei TNJ Chemical Industry Co. Ltd.
- 12.9 Kemin Industries Inc.
- 12.10 KUNSHAN ODOWELL CO. LTD.
- 12.11 Merck KGaA
- 12.12 METabolic EXplorer SA
- 12.13 OQ SAOC
- 12.14 PETRONAS Chemicals Group Berhad
- 12.15 Shri Rajaram Chemicals and Engg
- 12.16 Tokyo Chemical Industry Co. Ltd.
- 12.17 Yufeng International Group Co. Ltd.
13 Appendix
- 13.1 Scope of the report
- 13.2 Inclusions and exclusions checklist
- 13.3 Currency conversion rates for US$
- 13.4 Research methodology
- 13.5 List of abbreviations
