|
|
市場調査レポート
商品コード
1732667
日本のスマートフォン市場 2025~2029年Smartphone Market in Japan 2025-2029 |
||||||
|
|||||||
カスタマイズ可能
|
|||||||


| 日本のスマートフォン市場 2025~2029年 |
|
出版日: 2025年05月15日
発行: TechNavio
ページ情報: 英文 162 Pages
納期: 即納可能
|

全表示
- 概要
- 図表
- 目次
日本のスマートフォン市場は2024-2029年に27億1,770万米ドル、予測期間中のCAGRは3.3%で成長すると予測されます。
当レポートでは、日本のスマートフォン市場について、市場規模・予測、動向、成長促進要因、25社前後のベンダーを網羅した総合的な分析を掲載しています。
現在の市場シナリオ、最新動向と促進要因、市場環境全体に関する最新分析を提供しています。同市場は、ネットワークインフラの絶え間ない拡大、モバイルゲームの普及率上昇、スマートフォンのカメラ技術の絶え間ない革新に伴う企業間の熾烈な競争によって牽引されています。
本調査は、業界の主要参加者からのインプットを含め、一次情報と二次情報を客観的に組み合わせて実施しました。本レポートには、主要企業の分析に加え、包括的な市場規模データ、地域分析によるセグメント、ベンダー情勢が含まれています。レポートには過去データと予測データを掲載しています。
| 市場範囲 | |
|---|---|
| 基準年 | 2025 |
| 終了年 | 2029 |
| 予測期間 | 2025-2029 |
| 成長モメンタム | 加速 |
| 前年比 | 3.2% |
| CAGR | 3.3% |
| 増分額 | 27億1,770万米ドル |
本調査では、今後数年間における日本のスマートフォン市場の成長を牽引する主な要因の1つとして、折りたたみ式スマートフォンへの関心の高まりを挙げています。また、国内スマートフォンブランドのポートフォリオの拡大や、スマートフォンのオペレーティングシステムへの人工知能の統合は、市場の大きな需要につながります。
目次
第1章 エグゼクティブサマリー
- 市場概要
第2章 Technavio分析
- 価格・ライフサイクル・顧客購入バスケット・採用率・購入基準の分析
- インプットの重要性と差別化の要因
- 混乱の要因
- 促進要因と課題の影響
第3章 市場情勢
- 市場エコシステム
- 市場の特徴
- バリューチェーン分析
第4章 市場規模
- 市場の定義
- 市場セグメント分析
- 市場規模 2024
- 市場の見通し 2024-2029
第5章 市場規模実績
- 日本のスマートフォン市場 2019-2023
- 技術別セグメント分析 2019-2023
- 価格帯別セグメント分析 2019-2023
- 流通チャネル別セグメント分析 2019-2023
第6章 定性分析
- AIの影響:日本のスマートフォン市場
第7章 ファイブフォース分析
- ファイブフォースの要約
- 買い手の交渉力
- 供給企業の交渉力
- 新規参入業者の脅威
- 代替品の脅威
- 競争の脅威
- 市況
第8章 市場セグメンテーション:技術別
- 市場セグメント
- 比較:技術別
- iOS:市場規模と予測 2024-2029
- アンドロイド:市場規模と予測 2024-2029
- その他:市場規模と予測 2024-2029
- 市場機会:技術別
第9章 市場セグメンテーション:価格帯別
- 市場セグメント
- 比較:価格帯別
- 150ドルから800ドルの間:市場規模と予測 2024-2029
- 150ドル未満:市場規模と予測 2024-2029
- 800ドル以上:市場規模と予測 2024-2029
- 市場機会:価格帯別
第10章 市場セグメンテーション:流通チャネル別
- 市場セグメント
- 比較:流通チャネル別
- オフライン:市場規模と予測 2024-2029
- オンライン:市場規模と予測 2024-2029
- 市場機会:流通チャネル別
第11章 顧客情勢
- 顧客情勢の概要
第12章 促進要因・課題・機会・抑制要因
- 市場促進要因
- 市場の課題
- 促進要因と課題の影響
- 市場の機会・抑制要因
第13章 競合情勢
- 概要
- 競合情勢
- 混乱の状況
- 業界のリスク
第14章 競合分析
- 企業プロファイル
- 企業ランキング指数
- 企業の市場ポジショニング
- Apple Inc.
- ASUSTeK Computer Inc.
- Fujitsu Ltd.
- Google LLC
- Guangdong OPPO Mobile Telecommunications Corp. Ltd.
- Huawei Technologies Co. Ltd.
- KYOCERA Corp.
- Motorola Mobility LLC
- Nokia Corp.
- Samsung Electronics Co. Ltd.
- Sharp Corp.
- Sony Group Corp.
- vivo Mobile Communication Co. Ltd.
- Xiaomi Inc.
- ZTE Corp.
第15章 付録
Exhibits:
- Exhibits1: Executive Summary - Chart on Market Overview
- Exhibits2: Executive Summary - Data Table on Market Overview
- Exhibits3: Executive Summary - Chart on Country Market Characteristics
- Exhibits4: Executive Summary - Chart on Market Segmentation by Technology
- Exhibits5: Executive Summary - Chart on Market Segmentation by Price Range
- Exhibits6: Executive Summary - Chart on Market Segmentation by Distribution Channel
- Exhibits7: Executive Summary - Chart on Company Market Positioning
- Exhibits8: Analysis of price sensitivity, lifecycle, customer purchase basket, adoption rates, and purchase criteria
- Exhibits9: Overview on criticality of inputs and factors of differentiation
- Exhibits10: Overview on factors of disruption
- Exhibits11: Impact of drivers and challenges in 2024 and 2029
- Exhibits12: Parent Market
- Exhibits13: Data Table on - Parent Market
- Exhibits14: Market characteristics analysis
- Exhibits15: Value chain analysis
- Exhibits16: Offerings of companies included in the market definition
- Exhibits17: Market segments
- Exhibits18: Chart on Japan - Market size and forecast 2024-2029 ($ million)
- Exhibits19: Data Table on Japan - Market size and forecast 2024-2029 ($ million)
- Exhibits20: Chart on Japan: Year-over-year growth 2024-2029 (%)
- Exhibits21: Data Table on Japan: Year-over-year growth 2024-2029 (%)
- Exhibits22: Historic Market Size - Data Table on Smartphone Market in Japan 2019 - 2023 ($ million)
- Exhibits23: Historic Market Size - Technology Segment 2019 - 2023 ($ million)
- Exhibits24: Historic Market Size - Price Range Segment 2019 - 2023 ($ million)
- Exhibits25: Historic Market Size - Distribution Channel Segment 2019 - 2023 ($ million)
- Exhibits26: Five forces analysis - Comparison between 2024 and 2029
- Exhibits27: Bargaining power of buyers - Impact of key factors 2024 and 2029
- Exhibits28: Bargaining power of suppliers - Impact of key factors in 2024 and 2029
- Exhibits29: Threat of new entrants - Impact of key factors in 2024 and 2029
- Exhibits30: Threat of substitutes - Impact of key factors in 2024 and 2029
- Exhibits31: Threat of rivalry - Impact of key factors in 2024 and 2029
- Exhibits32: Chart on Market condition - Five forces 2024 and 2029
- Exhibits33: Chart on Technology - Market share 2024-2029 (%)
- Exhibits34: Data Table on Technology - Market share 2024-2029 (%)
- Exhibits35: Chart on Comparison by Technology
- Exhibits36: Data Table on Comparison by Technology
- Exhibits37: Chart on iOS - Market size and forecast 2024-2029 ($ million)
- Exhibits38: Data Table on iOS - Market size and forecast 2024-2029 ($ million)
- Exhibits39: Chart on iOS - Year-over-year growth 2024-2029 (%)
- Exhibits40: Data Table on iOS - Year-over-year growth 2024-2029 (%)
- Exhibits41: Chart on Android - Market size and forecast 2024-2029 ($ million)
- Exhibits42: Data Table on Android - Market size and forecast 2024-2029 ($ million)
- Exhibits43: Chart on Android - Year-over-year growth 2024-2029 (%)
- Exhibits44: Data Table on Android - Year-over-year growth 2024-2029 (%)
- Exhibits45: Chart on Others - Market size and forecast 2024-2029 ($ million)
- Exhibits46: Data Table on Others - Market size and forecast 2024-2029 ($ million)
- Exhibits47: Chart on Others - Year-over-year growth 2024-2029 (%)
- Exhibits48: Data Table on Others - Year-over-year growth 2024-2029 (%)
- Exhibits49: Market opportunity by Technology ($ million)
- Exhibits50: Data Table on Market opportunity by Technology ($ million)
- Exhibits51: Chart on Price Range - Market share 2024-2029 (%)
- Exhibits52: Data Table on Price Range - Market share 2024-2029 (%)
- Exhibits53: Chart on Comparison by Price Range
- Exhibits54: Data Table on Comparison by Price Range
- Exhibits55: Chart on Between $150-$800 - Market size and forecast 2024-2029 ($ million)
- Exhibits56: Data Table on Between $150-$800 - Market size and forecast 2024-2029 ($ million)
- Exhibits57: Chart on Between $150-$800 - Year-over-year growth 2024-2029 (%)
- Exhibits58: Data Table on Between $150-$800 - Year-over-year growth 2024-2029 (%)
- Exhibits59: Chart on Less than $150 - Market size and forecast 2024-2029 ($ million)
- Exhibits60: Data Table on Less than $150 - Market size and forecast 2024-2029 ($ million)
- Exhibits61: Chart on Less than $150 - Year-over-year growth 2024-2029 (%)
- Exhibits62: Data Table on Less than $150 - Year-over-year growth 2024-2029 (%)
- Exhibits63: Chart on Greater than $800 - Market size and forecast 2024-2029 ($ million)
- Exhibits64: Data Table on Greater than $800 - Market size and forecast 2024-2029 ($ million)
- Exhibits65: Chart on Greater than $800 - Year-over-year growth 2024-2029 (%)
- Exhibits66: Data Table on Greater than $800 - Year-over-year growth 2024-2029 (%)
- Exhibits67: Market opportunity by Price Range ($ million)
- Exhibits68: Data Table on Market opportunity by Price Range ($ million)
- Exhibits69: Chart on Distribution Channel - Market share 2024-2029 (%)
- Exhibits70: Data Table on Distribution Channel - Market share 2024-2029 (%)
- Exhibits71: Chart on Comparison by Distribution Channel
- Exhibits72: Data Table on Comparison by Distribution Channel
- Exhibits73: Chart on Offline - Market size and forecast 2024-2029 ($ million)
- Exhibits74: Data Table on Offline - Market size and forecast 2024-2029 ($ million)
- Exhibits75: Chart on Offline - Year-over-year growth 2024-2029 (%)
- Exhibits76: Data Table on Offline - Year-over-year growth 2024-2029 (%)
- Exhibits77: Chart on Online - Market size and forecast 2024-2029 ($ million)
- Exhibits78: Data Table on Online - Market size and forecast 2024-2029 ($ million)
- Exhibits79: Chart on Online - Year-over-year growth 2024-2029 (%)
- Exhibits80: Data Table on Online - Year-over-year growth 2024-2029 (%)
- Exhibits81: Market opportunity by Distribution Channel ($ million)
- Exhibits82: Data Table on Market opportunity by Distribution Channel ($ million)
- Exhibits83: Analysis of price sensitivity, lifecycle, customer purchase basket, adoption rates, and purchase criteria
- Exhibits84: Impact of drivers and challenges in 2024 and 2029
- Exhibits85: Overview on criticality of inputs and factors of differentiation
- Exhibits86: Overview on factors of disruption
- Exhibits87: Impact of key risks on business
- Exhibits88: Companies covered
- Exhibits89: Company ranking index
- Exhibits90: Matrix on companies position and classification
- Exhibits91: Apple Inc. - Overview
- Exhibits92: Apple Inc. - Business segments
- Exhibits93: Apple Inc. - Key news
- Exhibits94: Apple Inc. - Key offerings
- Exhibits95: Apple Inc. - Segment focus
- Exhibits96: SWOT
- Exhibits97: ASUSTeK Computer Inc. - Overview
- Exhibits98: ASUSTeK Computer Inc. - Product / Service
- Exhibits99: ASUSTeK Computer Inc. - Key news
- Exhibits100: ASUSTeK Computer Inc. - Key offerings
- Exhibits101: SWOT
- Exhibits102: Fujitsu Ltd. - Overview
- Exhibits103: Fujitsu Ltd. - Business segments
- Exhibits104: Fujitsu Ltd. - Key news
- Exhibits105: Fujitsu Ltd. - Key offerings
- Exhibits106: Fujitsu Ltd. - Segment focus
- Exhibits107: SWOT
- Exhibits108: Google LLC - Overview
- Exhibits109: Google LLC - Product / Service
- Exhibits110: Google LLC - Key news
- Exhibits111: Google LLC - Key offerings
- Exhibits112: SWOT
- Exhibits113: Guangdong OPPO Mobile Telecommunications Corp. Ltd. - Overview
- Exhibits114: Guangdong OPPO Mobile Telecommunications Corp. Ltd. - Product / Service
- Exhibits115: Guangdong OPPO Mobile Telecommunications Corp. Ltd. - Key offerings
- Exhibits116: SWOT
- Exhibits117: Huawei Technologies Co. Ltd. - Overview
- Exhibits118: Huawei Technologies Co. Ltd. - Product / Service
- Exhibits119: Huawei Technologies Co. Ltd. - Key news
- Exhibits120: Huawei Technologies Co. Ltd. - Key offerings
- Exhibits121: SWOT
- Exhibits122: KYOCERA Corp. - Overview
- Exhibits123: KYOCERA Corp. - Business segments
- Exhibits124: KYOCERA Corp. - Key news
- Exhibits125: KYOCERA Corp. - Key offerings
- Exhibits126: KYOCERA Corp. - Segment focus
- Exhibits127: SWOT
- Exhibits128: Motorola Mobility LLC - Overview
- Exhibits129: Motorola Mobility LLC - Product / Service
- Exhibits130: Motorola Mobility LLC - Key offerings
- Exhibits131: SWOT
- Exhibits132: Nokia Corp. - Overview
- Exhibits133: Nokia Corp. - Business segments
- Exhibits134: Nokia Corp. - Key news
- Exhibits135: Nokia Corp. - Key offerings
- Exhibits136: Nokia Corp. - Segment focus
- Exhibits137: SWOT
- Exhibits138: Samsung Electronics Co. Ltd. - Overview
- Exhibits139: Samsung Electronics Co. Ltd. - Business segments
- Exhibits140: Samsung Electronics Co. Ltd. - Key news
- Exhibits141: Samsung Electronics Co. Ltd. - Key offerings
- Exhibits142: Samsung Electronics Co. Ltd. - Segment focus
- Exhibits143: SWOT
- Exhibits144: Sharp Corp. - Overview
- Exhibits145: Sharp Corp. - Business segments
- Exhibits146: Sharp Corp. - Key news
- Exhibits147: Sharp Corp. - Key offerings
- Exhibits148: Sharp Corp. - Segment focus
- Exhibits149: SWOT
- Exhibits150: Sony Group Corp. - Overview
- Exhibits151: Sony Group Corp. - Business segments
- Exhibits152: Sony Group Corp. - Key offerings
- Exhibits153: Sony Group Corp. - Segment focus
- Exhibits154: SWOT
- Exhibits155: vivo Mobile Communication Co. Ltd. - Overview
- Exhibits156: vivo Mobile Communication Co. Ltd. - Product / Service
- Exhibits157: vivo Mobile Communication Co. Ltd. - Key offerings
- Exhibits158: SWOT
- Exhibits159: Xiaomi Inc. - Overview
- Exhibits160: Xiaomi Inc. - Business segments
- Exhibits161: Xiaomi Inc. - Key news
- Exhibits162: Xiaomi Inc. - Key offerings
- Exhibits163: Xiaomi Inc. - Segment focus
- Exhibits164: SWOT
- Exhibits165: ZTE Corp. - Overview
- Exhibits166: ZTE Corp. - Business segments
- Exhibits167: ZTE Corp. - Key offerings
- Exhibits168: ZTE Corp. - Segment focus
- Exhibits169: SWOT
- Exhibits170: Inclusions checklist
- Exhibits171: Exclusions checklist
- Exhibits172: Currency conversion rates for US$
- Exhibits173: Research methodology
- Exhibits174: Information sources
- Exhibits175: Data validation
- Exhibits176: Validation techniques employed for market sizing
- Exhibits177: Data synthesis
- Exhibits178: 360 degree market analysis
- Exhibits179: List of abbreviations
The smartphone market in japan is forecasted to grow by USD 2,717.7 mn during 2024-2029, accelerating at a CAGR of 3.3% during the forecast period. The report on the smartphone market in japan provides a holistic analysis, market size and forecast, trends, growth drivers, and challenges, as well as vendor analysis covering around 25 vendors.
The report offers an up-to-date analysis regarding the current market scenario, the latest trends and drivers, and the overall market environment. The market is driven by constant expansion in network infrastructure, rising prevalence of mobile gaming practices, and intense rivalry among the companies with constant innovation in camera technology in smartphones.
The study was conducted using an objective combination of primary and secondary information including inputs from key participants in the industry. The report contains a comprehensive market size data, segment with regional analysis and vendor landscape in addition to an analysis of the key companies. Reports have historic and forecast data.
| Market Scope | |
|---|---|
| Base Year | 2025 |
| End Year | 2029 |
| Series Year | 2025-2029 |
| Growth Momentum | Accelerate |
| YOY 2025 | 3.2% |
| CAGR | 3.3% |
| Incremental Value | $2,717.7 mn |
Technavio's smartphone market in japan is segmented as below:
By Technology
- iOS
- Android
- Others
By Price Range
- Between USD150-USD800
- Less than USD150
- Greater than USD800
By Distribution Channel
- Offline
- Online
This study identifies the rising interest in foldable smartphones as one of the prime reasons driving the smartphone market in japan growth during the next few years. Also, expanding portfolio of domestic smartphone brands and integration of artificial intelligence in operating systems of smartphones will lead to sizable demand in the market.
The report on the smartphone market in japan covers the following areas:
- Smartphone Market in Japan sizing
- Smartphone Market in Japan forecast
- Smartphone Market in Japan industry analysis
The robust vendor analysis is designed to help clients improve their market position, and in line with this, this report provides a detailed analysis of several leading smartphone market in japan vendors that include Acer Inc., Apple Inc., ASUSTeK Computer Inc., Fujitsu Ltd., Google LLC, Guangdong OPPO Mobile Telecommunications Corp. Ltd., Huawei Technologies Co. Ltd., KYOCERA Corp., Motorola Mobility LLC, Nokia Corp., Nothing Technology Ltd., Samsung Electronics Co. Ltd., Sharp Corp., Sony Group Corp., TCL Industries Holdings Co. Ltd., vivo Mobile Communication Co. Ltd., Xiaomi Inc., and ZTE Corp.. Also, the smartphone market in japan analysis report includes information on upcoming trends and challenges that will influence market growth. This is to help companies strategize and leverage all forthcoming growth opportunities.
The publisher presents a detailed picture of the market by the way of study, synthesis, and summation of data from multiple sources by an analysis of key parameters such as profit, pricing, competition, and promotions. It presents various market facets by identifying the key industry influencers. The data presented is comprehensive, reliable, and a result of extensive primary and secondary research. The market research reports provide a complete competitive landscape and an in-depth vendor selection methodology and analysis using qualitative and quantitative research to forecast accurate market growth.
Table of Contents
1 Executive Summary
- 1.1 Market overview
- Executive Summary - Chart on Market Overview
- Executive Summary - Data Table on Market Overview
- Executive Summary - Chart on Country Market Characteristics
- Executive Summary - Chart on Market Segmentation by Technology
- Executive Summary - Chart on Market Segmentation by Price Range
- Executive Summary - Chart on Market Segmentation by Distribution Channel
- Executive Summary - Chart on Company Market Positioning
2 Technavio Analysis
- 2.1 Analysis of price sensitivity, lifecycle, customer purchase basket, adoption rates, and purchase criteria
- Analysis of price sensitivity, lifecycle, customer purchase basket, adoption rates, and purchase criteria
- 2.2 Criticality of inputs and Factors of differentiation
- Overview on criticality of inputs and factors of differentiation
- 2.3 Factors of disruption
- Overview on factors of disruption
- 2.4 Impact of drivers and challenges
- Impact of drivers and challenges in 2024 and 2029
3 Market Landscape
- 3.1 Market ecosystem
- Parent Market
- Data Table on - Parent Market
- 3.2 Market characteristics
- Market characteristics analysis
- 3.3 Value chain analysis
- Value chain analysis
4 Market Sizing
- 4.1 Market definition
- Offerings of companies included in the market definition
- 4.2 Market segment analysis
- Market segments
- 4.3 Market size 2024
- 4.4 Market outlook: Forecast for 2024-2029
- Chart on Japan - Market size and forecast 2024-2029 ($ million)
- Data Table on Japan - Market size and forecast 2024-2029 ($ million)
- Chart on Japan: Year-over-year growth 2024-2029 (%)
- Data Table on Japan: Year-over-year growth 2024-2029 (%)
5 Historic Market Size
- 5.1 Smartphone Market in Japan 2019 - 2023
- Historic Market Size - Data Table on Smartphone Market in Japan 2019 - 2023 ($ million)
- 5.2 Technology segment analysis 2019 - 2023
- Historic Market Size - Technology Segment 2019 - 2023 ($ million)
- 5.3 Price Range segment analysis 2019 - 2023
- Historic Market Size - Price Range Segment 2019 - 2023 ($ million)
- 5.4 Distribution Channel segment analysis 2019 - 2023
- Historic Market Size - Distribution Channel Segment 2019 - 2023 ($ million)
6 Qualitative Analysis
- 6.1 Impact of AI on Smartphone Market in Japan
7 Five Forces Analysis
- 7.1 Five forces summary
- Five forces analysis - Comparison between 2024 and 2029
- 7.2 Bargaining power of buyers
- Bargaining power of buyers - Impact of key factors 2024 and 2029
- 7.3 Bargaining power of suppliers
- Bargaining power of suppliers - Impact of key factors in 2024 and 2029
- 7.4 Threat of new entrants
- Threat of new entrants - Impact of key factors in 2024 and 2029
- 7.5 Threat of substitutes
- Threat of substitutes - Impact of key factors in 2024 and 2029
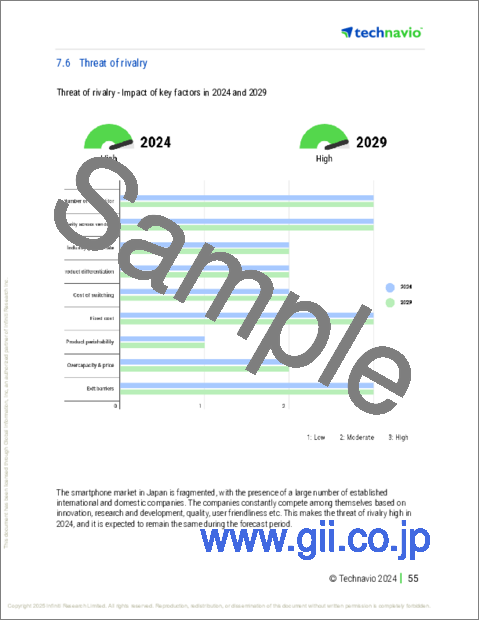
- 7.6 Threat of rivalry
- Threat of rivalry - Impact of key factors in 2024 and 2029
- 7.7 Market condition
- Chart on Market condition - Five forces 2024 and 2029
8 Market Segmentation by Technology
- 8.1 Market segments
- Chart on Technology - Market share 2024-2029 (%)
- Data Table on Technology - Market share 2024-2029 (%)
- 8.2 Comparison by Technology
- Chart on Comparison by Technology
- Data Table on Comparison by Technology
- 8.3 iOS - Market size and forecast 2024-2029
- Chart on iOS - Market size and forecast 2024-2029 ($ million)
- Data Table on iOS - Market size and forecast 2024-2029 ($ million)
- Chart on iOS - Year-over-year growth 2024-2029 (%)
- Data Table on iOS - Year-over-year growth 2024-2029 (%)
- 8.4 Android - Market size and forecast 2024-2029
- Chart on Android - Market size and forecast 2024-2029 ($ million)
- Data Table on Android - Market size and forecast 2024-2029 ($ million)
- Chart on Android - Year-over-year growth 2024-2029 (%)
- Data Table on Android - Year-over-year growth 2024-2029 (%)
- 8.5 Others - Market size and forecast 2024-2029
- Chart on Others - Market size and forecast 2024-2029 ($ million)
- Data Table on Others - Market size and forecast 2024-2029 ($ million)
- Chart on Others - Year-over-year growth 2024-2029 (%)
- Data Table on Others - Year-over-year growth 2024-2029 (%)
- 8.6 Market opportunity by Technology
- Market opportunity by Technology ($ million)
- Data Table on Market opportunity by Technology ($ million)
9 Market Segmentation by Price Range
- 9.1 Market segments
- Chart on Price Range - Market share 2024-2029 (%)
- Data Table on Price Range - Market share 2024-2029 (%)
- 9.2 Comparison by Price Range
- Chart on Comparison by Price Range
- Data Table on Comparison by Price Range
- 9.3 Between $150-$800 - Market size and forecast 2024-2029
- Chart on Between $150-$800 - Market size and forecast 2024-2029 ($ million)
- Data Table on Between $150-$800 - Market size and forecast 2024-2029 ($ million)
- Chart on Between $150-$800 - Year-over-year growth 2024-2029 (%)
- Data Table on Between $150-$800 - Year-over-year growth 2024-2029 (%)
- 9.4 Less than $150 - Market size and forecast 2024-2029
- Chart on Less than $150 - Market size and forecast 2024-2029 ($ million)
- Data Table on Less than $150 - Market size and forecast 2024-2029 ($ million)
- Chart on Less than $150 - Year-over-year growth 2024-2029 (%)
- Data Table on Less than $150 - Year-over-year growth 2024-2029 (%)
- 9.5 Greater than $800 - Market size and forecast 2024-2029
- Chart on Greater than $800 - Market size and forecast 2024-2029 ($ million)
- Data Table on Greater than $800 - Market size and forecast 2024-2029 ($ million)
- Chart on Greater than $800 - Year-over-year growth 2024-2029 (%)
- Data Table on Greater than $800 - Year-over-year growth 2024-2029 (%)
- 9.6 Market opportunity by Price Range
- Market opportunity by Price Range ($ million)
- Data Table on Market opportunity by Price Range ($ million)
10 Market Segmentation by Distribution Channel
- 10.1 Market segments
- Chart on Distribution Channel - Market share 2024-2029 (%)
- Data Table on Distribution Channel - Market share 2024-2029 (%)
- 10.2 Comparison by Distribution Channel
- Chart on Comparison by Distribution Channel
- Data Table on Comparison by Distribution Channel
- 10.3 Offline - Market size and forecast 2024-2029
- Chart on Offline - Market size and forecast 2024-2029 ($ million)
- Data Table on Offline - Market size and forecast 2024-2029 ($ million)
- Chart on Offline - Year-over-year growth 2024-2029 (%)
- Data Table on Offline - Year-over-year growth 2024-2029 (%)
- 10.4 Online - Market size and forecast 2024-2029
- Chart on Online - Market size and forecast 2024-2029 ($ million)
- Data Table on Online - Market size and forecast 2024-2029 ($ million)
- Chart on Online - Year-over-year growth 2024-2029 (%)
- Data Table on Online - Year-over-year growth 2024-2029 (%)
- 10.5 Market opportunity by Distribution Channel
- Market opportunity by Distribution Channel ($ million)
- Data Table on Market opportunity by Distribution Channel ($ million)
11 Customer Landscape
- 11.1 Customer landscape overview
- Analysis of price sensitivity, lifecycle, customer purchase basket, adoption rates, and purchase criteria
12 Drivers, Challenges, and Opportunity/Restraints
- 12.1 Market drivers
- 12.2 Market challenges
- 12.3 Impact of drivers and challenges
- Impact of drivers and challenges in 2024 and 2029
- 12.4 Market opportunities/restraints
13 Competitive Landscape
- 13.1 Overview
- 13.2 Competitive Landscape
- Overview on criticality of inputs and factors of differentiation
- 13.3 Landscape disruption
- Overview on factors of disruption
- 13.4 Industry risks
- Impact of key risks on business
14 Competitive Analysis
- 14.1 Companies profiled
- Companies covered
- 14.2 Company ranking index
- Company ranking index
- 14.3 Market positioning of companies
- Matrix on companies position and classification
- 14.4 Apple Inc.
- Apple Inc. - Overview
- Apple Inc. - Business segments
- Apple Inc. - Key news
- Apple Inc. - Key offerings
- Apple Inc. - Segment focus
- SWOT
- 14.5 ASUSTeK Computer Inc.
- ASUSTeK Computer Inc. - Overview
- ASUSTeK Computer Inc. - Product / Service
- ASUSTeK Computer Inc. - Key news
- ASUSTeK Computer Inc. - Key offerings
- SWOT
- 14.6 Fujitsu Ltd.
- Fujitsu Ltd. - Overview
- Fujitsu Ltd. - Business segments
- Fujitsu Ltd. - Key news
- Fujitsu Ltd. - Key offerings
- Fujitsu Ltd. - Segment focus
- SWOT
- 14.7 Google LLC
- Google LLC - Overview
- Google LLC - Product / Service
- Google LLC - Key news
- Google LLC - Key offerings
- SWOT
- 14.8 Guangdong OPPO Mobile Telecommunications Corp. Ltd.
- Guangdong OPPO Mobile Telecommunications Corp. Ltd. - Overview
- Guangdong OPPO Mobile Telecommunications Corp. Ltd. - Product / Service
- Guangdong OPPO Mobile Telecommunications Corp. Ltd. - Key offerings
- SWOT
- 14.9 Huawei Technologies Co. Ltd.
- Huawei Technologies Co. Ltd. - Overview
- Huawei Technologies Co. Ltd. - Product / Service
- Huawei Technologies Co. Ltd. - Key news
- Huawei Technologies Co. Ltd. - Key offerings
- SWOT
- 14.10 KYOCERA Corp.
- KYOCERA Corp. - Overview
- KYOCERA Corp. - Business segments
- KYOCERA Corp. - Key news
- KYOCERA Corp. - Key offerings
- KYOCERA Corp. - Segment focus
- SWOT
- 14.11 Motorola Mobility LLC
- Motorola Mobility LLC - Overview
- Motorola Mobility LLC - Product / Service
- Motorola Mobility LLC - Key offerings
- SWOT
- 14.12 Nokia Corp.
- Nokia Corp. - Overview
- Nokia Corp. - Business segments
- Nokia Corp. - Key news
- Nokia Corp. - Key offerings
- Nokia Corp. - Segment focus
- SWOT
- 14.13 Samsung Electronics Co. Ltd.
- Samsung Electronics Co. Ltd. - Overview
- Samsung Electronics Co. Ltd. - Business segments
- Samsung Electronics Co. Ltd. - Key news
- Samsung Electronics Co. Ltd. - Key offerings
- Samsung Electronics Co. Ltd. - Segment focus
- SWOT
- 14.14 Sharp Corp.
- Sharp Corp. - Overview
- Sharp Corp. - Business segments
- Sharp Corp. - Key news
- Sharp Corp. - Key offerings
- Sharp Corp. - Segment focus
- SWOT
- 14.15 Sony Group Corp.
- Sony Group Corp. - Overview
- Sony Group Corp. - Business segments
- Sony Group Corp. - Key offerings
- Sony Group Corp. - Segment focus
- SWOT
- 14.16 vivo Mobile Communication Co. Ltd.
- vivo Mobile Communication Co. Ltd. - Overview
- vivo Mobile Communication Co. Ltd. - Product / Service
- vivo Mobile Communication Co. Ltd. - Key offerings
- SWOT
- 14.17 Xiaomi Inc.
- Xiaomi Inc. - Overview
- Xiaomi Inc. - Business segments
- Xiaomi Inc. - Key news
- Xiaomi Inc. - Key offerings
- Xiaomi Inc. - Segment focus
- SWOT
- 14.18 ZTE Corp.
- ZTE Corp. - Overview
- ZTE Corp. - Business segments
- ZTE Corp. - Key offerings
- ZTE Corp. - Segment focus
- SWOT
15 Appendix
- 15.1 Scope of the report
- 15.2 Inclusions and exclusions checklist
- Inclusions checklist
- Exclusions checklist
- 15.3 Currency conversion rates for US$
- Currency conversion rates for US$
- 15.4 Research methodology
- Research methodology
- 15.5 Data procurement
- Information sources
- 15.6 Data validation
- Data validation
- 15.7 Validation techniques employed for market sizing
- Validation techniques employed for market sizing
- 15.8 Data synthesis
- Data synthesis
- 15.9 360 degree market analysis
- 360 degree market analysis
- 15.10 List of abbreviations
- List of abbreviations

