|
|
市場調査レポート
商品コード
1459549
半導体製造装置の世界市場 2024-2028Global Semiconductor Manufacturing Equipment Market 2024-2028 |
||||||
|
|||||||
カスタマイズ可能
|
|||||||


| 半導体製造装置の世界市場 2024-2028 |
|
出版日: 2024年03月20日
発行: TechNavio
ページ情報: 英文 157 Pages
納期: 即納可能
|

全表示
- 概要
- 図表
- 目次
半導体製造装置市場は2023-2028年に466億8,000万米ドル、予測期間中のCAGRは7.74%で成長すると予測されます。
当レポートでは、半導体製造装置市場の全体的な分析、市場規模・予測、動向、成長促進要因、課題、約25のベンダーを網羅したベンダー分析などを掲載しています。
現在の市場シナリオ、最新動向と促進要因、市場環境全体に関する最新分析を提供しています。市場は、半導体製造への投資の増加、高度な半導体製造能力を必要とする5Gネットワークの拡大、アジア太平洋における半導体組立テスト(OSAT)アウトソーシングベンダーの増加によって牽引されています。
| 市場範囲 | |
|---|---|
| 基準年 | 2024 |
| 終了年 | 2028 |
| 予測期間 | 2024-2028 |
| 成長モメンタム | 加速 |
| 前年比2024年 | 7.26% |
| CAGR | 7.74% |
| 増分額 | 466億8,000万米ドル |
本調査では、半導体製造装置業界の発展が、今後数年間の半導体製造装置市場成長を牽引する主要因の一つであると分析しています。また、より小さなノードサイズへの先進リソグラフィ技術の採用、ウエハーレベルパッケージングとヘテロジニアスインテグレーションへの注目の高まりは、市場の大きな需要につながります。
目次
第1章 エグゼクティブサマリー
- 市場概要
第2章 市場情勢
- 市場エコシステム
第3章 市場規模の評価
- 市場の定義
- 市場セグメント分析
- 市場規模 2023
- 市場の見通し 2023-2028
第4章 市場規模実績
- 半導体製造装置の世界市場 2018-2022
- 用途別セグメント分析 2018-2022
- タイプセグメント分析 2018-2022
- 地域別セグメント分析 2018-2022
- 国別セグメント分析 2018-2022
第5章 ファイブフォース分析
- ファイブフォースの要約
- 買い手の交渉力
- 供給企業の交渉力
- 新規参入業者の脅威
- 代替品の脅威
- 競争の脅威
- 市況
第6章 市場セグメンテーション:用途別
- 市場セグメント
- 比較:用途別
- 半導体製造工場とファウンドリ:市場規模と予測 2023-2028
- 試験と検査:市場規模と予測 2023-2028
- 半導体電子機器製造:市場規模と予測 2023-2028
- 市場機会:用途別
第7章 市場セグメンテーション:タイプ別
- 市場セグメント
- 比較:タイプ別
- フロントエンド:市場規模と予測 2023-2028
- バックエンド:市場規模と予測 2023-2028
- 市場機会:タイプ別
第8章 顧客情勢
- 顧客情勢の概要
第9章 地域別情勢
- 地域別セグメンテーション
- 地域別比較
- アジア太平洋:市場規模と予測 2023-2028
- 欧州:市場規模と予測 2023-2028
- 北米:市場規模と予測 2023-2028
- 中東・アフリカ:市場規模と予測 2023-2028
- 南米:市場規模と予測 2023-2028
- 中国:市場規模と予測 2023-2028
- インド:市場規模と予測 2023-2028
- 台湾:市場規模と予測 2023-2028
- ドイツ:市場規模と予測 2023-2028
- 米国:市場規模と予測 2023-2028
- 市場機会:地域別
第10章 促進要因、課題、および動向
- 市場促進要因
- 市場の課題
- 促進要因と課題の影響
- 市場動向
第11章 ベンダー情勢
- 概要
- ベンダー情勢
- 混乱の状況
- 業界のリスク
第12章 ベンダー分析
- 対象ベンダー
- ベンダーの市場ポジショニング
- Applied Materials Inc.
- ASM International NV
- ASML
- Axcelis Technologies Inc
- EV Group
- Hitachi Ltd.
- KLA Corp.
- Lam Research Corp.
- Nikon Corp.
- Nova Measuring Instruments Ltd.
- Onto Innovation Inc.
- PLASMA THERM
- Teradyne Inc.
- Tokyo Electron Ltd.
- Veeco Instruments Inc.
第13章 付録
Exhibits:
- Exhibits1: Executive Summary - Chart on Market Overview
- Exhibits2: Executive Summary - Data Table on Market Overview
- Exhibits3: Executive Summary - Chart on Global Market Characteristics
- Exhibits4: Executive Summary - Chart on Market by Geography
- Exhibits5: Executive Summary - Chart on Market Segmentation by Application
- Exhibits6: Executive Summary - Chart on Market Segmentation by Type
- Exhibits7: Executive Summary - Chart on Incremental Growth
- Exhibits8: Executive Summary - Data Table on Incremental Growth
- Exhibits9: Executive Summary - Chart on Vendor Market Positioning
- Exhibits10: Parent market
- Exhibits11: Market Characteristics
- Exhibits12: Offerings of vendors included in the market definition
- Exhibits13: Market segments
- Exhibits14: Chart on Global - Market size and forecast 2023-2028 ($ billion)
- Exhibits15: Data Table on Global - Market size and forecast 2023-2028 ($ billion)
- Exhibits16: Chart on Global Market: Year-over-year growth 2023-2028 (%)
- Exhibits17: Data Table on Global Market: Year-over-year growth 2023-2028 (%)
- Exhibits18: Historic Market Size - Data Table on global semiconductor manufacturing equipment market 2018 - 2022 ($ billion)
- Exhibits19: Historic Market Size - Application Segment 2018 - 2022 ($ billion)
- Exhibits20: Historic Market Size - Type Segment 2018 - 2022 ($ billion)
- Exhibits21: Historic Market Size - Geography Segment 2018 - 2022 ($ billion)
- Exhibits22: Historic Market Size - Country Segment 2018 - 2022 ($ billion)
- Exhibits23: Five forces analysis - Comparison between 2023 and 2028
- Exhibits24: Chart on Bargaining power of buyers - Impact of key factors 2023 and 2028
- Exhibits25: Bargaining power of suppliers - Impact of key factors in 2023 and 2028
- Exhibits26: Threat of new entrants - Impact of key factors in 2023 and 2028
- Exhibits27: Threat of substitutes - Impact of key factors in 2023 and 2028
- Exhibits28: Threat of rivalry - Impact of key factors in 2023 and 2028
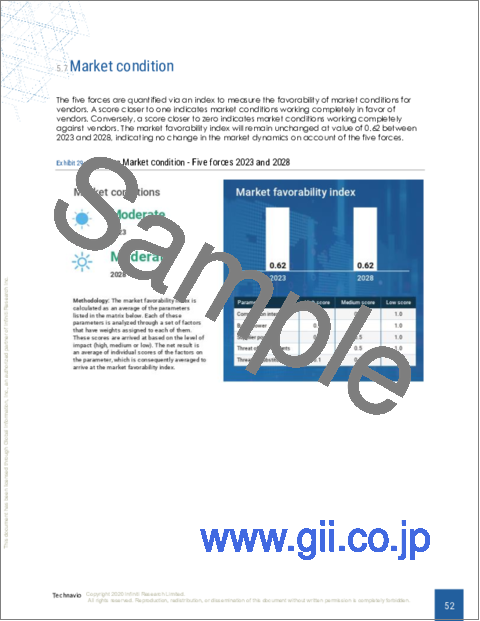
- Exhibits29: Chart on Market condition - Five forces 2023 and 2028
- Exhibits30: Chart on Application - Market share 2023-2028 (%)
- Exhibits31: Data Table on Application - Market share 2023-2028 (%)
- Exhibits32: Chart on Comparison by Application
- Exhibits33: Data Table on Comparison by Application
- Exhibits34: Chart on Semiconductor fabrication plant or foundry - Market size and forecast 2023-2028 ($ billion)
- Exhibits35: Data Table on Semiconductor fabrication plant or foundry - Market size and forecast 2023-2028 ($ billion)
- Exhibits36: Chart on Semiconductor fabrication plant or foundry - Year-over-year growth 2023-2028 (%)
- Exhibits37: Data Table on Semiconductor fabrication plant or foundry - Year-over-year growth 2023-2028 (%)
- Exhibits38: Chart on Testing and inspection - Market size and forecast 2023-2028 ($ billion)
- Exhibits39: Data Table on Testing and inspection - Market size and forecast 2023-2028 ($ billion)
- Exhibits40: Chart on Testing and inspection - Year-over-year growth 2023-2028 (%)
- Exhibits41: Data Table on Testing and inspection - Year-over-year growth 2023-2028 (%)
- Exhibits42: Chart on Semiconductor electronics manufacturing - Market size and forecast 2023-2028 ($ billion)
- Exhibits43: Data Table on Semiconductor electronics manufacturing - Market size and forecast 2023-2028 ($ billion)
- Exhibits44: Chart on Semiconductor electronics manufacturing - Year-over-year growth 2023-2028 (%)
- Exhibits45: Data Table on Semiconductor electronics manufacturing - Year-over-year growth 2023-2028 (%)
- Exhibits46: Market opportunity by Application ($ billion)
- Exhibits47: Data Table on Market opportunity by Application ($ billion)
- Exhibits48: Chart on Type - Market share 2023-2028 (%)
- Exhibits49: Data Table on Type - Market share 2023-2028 (%)
- Exhibits50: Chart on Comparison by Type
- Exhibits51: Data Table on Comparison by Type
- Exhibits52: Chart on Front end - Market size and forecast 2023-2028 ($ billion)
- Exhibits53: Data Table on Front end - Market size and forecast 2023-2028 ($ billion)
- Exhibits54: Chart on Front end - Year-over-year growth 2023-2028 (%)
- Exhibits55: Data Table on Front end - Year-over-year growth 2023-2028 (%)
- Exhibits56: Chart on Back end - Market size and forecast 2023-2028 ($ billion)
- Exhibits57: Data Table on Back end - Market size and forecast 2023-2028 ($ billion)
- Exhibits58: Chart on Back end - Year-over-year growth 2023-2028 (%)
- Exhibits59: Data Table on Back end - Year-over-year growth 2023-2028 (%)
- Exhibits60: Market opportunity by Type ($ billion)
- Exhibits61: Data Table on Market opportunity by Type ($ billion)
- Exhibits62: Analysis of price sensitivity, lifecycle, customer purchase basket, adoption rates, and purchase criteria
- Exhibits63: Chart on Market share by geography 2023-2028 (%)
- Exhibits64: Data Table on Market share by geography 2023-2028 (%)
- Exhibits65: Chart on Geographic comparison
- Exhibits66: Data Table on Geographic comparison
- Exhibits67: Chart on APAC - Market size and forecast 2023-2028 ($ billion)
- Exhibits68: Data Table on APAC - Market size and forecast 2023-2028 ($ billion)
- Exhibits69: Chart on APAC - Year-over-year growth 2023-2028 (%)
- Exhibits70: Data Table on APAC - Year-over-year growth 2023-2028 (%)
- Exhibits71: Chart on Europe - Market size and forecast 2023-2028 ($ billion)
- Exhibits72: Data Table on Europe - Market size and forecast 2023-2028 ($ billion)
- Exhibits73: Chart on Europe - Year-over-year growth 2023-2028 (%)
- Exhibits74: Data Table on Europe - Year-over-year growth 2023-2028 (%)
- Exhibits75: Chart on North America - Market size and forecast 2023-2028 ($ billion)
- Exhibits76: Data Table on North America - Market size and forecast 2023-2028 ($ billion)
- Exhibits77: Chart on North America - Year-over-year growth 2023-2028 (%)
- Exhibits78: Data Table on North America - Year-over-year growth 2023-2028 (%)
- Exhibits79: Chart on Middle East and Africa - Market size and forecast 2023-2028 ($ billion)
- Exhibits80: Data Table on Middle East and Africa - Market size and forecast 2023-2028 ($ billion)
- Exhibits81: Chart on Middle East and Africa - Year-over-year growth 2023-2028 (%)
- Exhibits82: Data Table on Middle East and Africa - Year-over-year growth 2023-2028 (%)
- Exhibits83: Chart on South America - Market size and forecast 2023-2028 ($ billion)
- Exhibits84: Data Table on South America - Market size and forecast 2023-2028 ($ billion)
- Exhibits85: Chart on South America - Year-over-year growth 2023-2028 (%)
- Exhibits86: Data Table on South America - Year-over-year growth 2023-2028 (%)
- Exhibits87: Chart on China - Market size and forecast 2023-2028 ($ billion)
- Exhibits88: Data Table on China - Market size and forecast 2023-2028 ($ billion)
- Exhibits89: Chart on China - Year-over-year growth 2023-2028 (%)
- Exhibits90: Data Table on China - Year-over-year growth 2023-2028 (%)
- Exhibits91: Chart on India - Market size and forecast 2023-2028 ($ billion)
- Exhibits92: Data Table on India - Market size and forecast 2023-2028 ($ billion)
- Exhibits93: Chart on India - Year-over-year growth 2023-2028 (%)
- Exhibits94: Data Table on India - Year-over-year growth 2023-2028 (%)
- Exhibits95: Chart on Taiwan - Market size and forecast 2023-2028 ($ billion)
- Exhibits96: Data Table on Taiwan - Market size and forecast 2023-2028 ($ billion)
- Exhibits97: Chart on Taiwan - Year-over-year growth 2023-2028 (%)
- Exhibits98: Data Table on Taiwan - Year-over-year growth 2023-2028 (%)
- Exhibits99: Chart on Germany - Market size and forecast 2023-2028 ($ billion)
- Exhibits100: Data Table on Germany - Market size and forecast 2023-2028 ($ billion)
- Exhibits101: Chart on Germany - Year-over-year growth 2023-2028 (%)
- Exhibits102: Data Table on Germany - Year-over-year growth 2023-2028 (%)
- Exhibits103: Chart on US - Market size and forecast 2023-2028 ($ billion)
- Exhibits104: Data Table on US - Market size and forecast 2023-2028 ($ billion)
- Exhibits105: Chart on US - Year-over-year growth 2023-2028 (%)
- Exhibits106: Data Table on US - Year-over-year growth 2023-2028 (%)
- Exhibits107: Market opportunity by geography ($ billion)
- Exhibits108: Data Tables on Market opportunity by geography ($ billion)
- Exhibits109: Impact of drivers and challenges in 2023 and 2028
- Exhibits110: Overview on Criticality of inputs and Factors of differentiation
- Exhibits111: Overview on factors of disruption
- Exhibits112: Impact of key risks on business
- Exhibits113: Vendors covered
- Exhibits114: Matrix on vendor position and classification
- Exhibits115: Applied Materials Inc. - Overview
- Exhibits116: Applied Materials Inc. - Business segments
- Exhibits117: Applied Materials Inc. - Key news
- Exhibits118: Applied Materials Inc. - Key offerings
- Exhibits119: Applied Materials Inc. - Segment focus
- Exhibits120: ASM International NV - Overview
- Exhibits121: ASM International NV - Product / Service
- Exhibits122: ASM International NV - Key offerings
- Exhibits123: ASML - Overview
- Exhibits124: ASML - Product / Service
- Exhibits125: ASML - Key news
- Exhibits126: ASML - Key offerings
- Exhibits127: Axcelis Technologies Inc - Overview
- Exhibits128: Axcelis Technologies Inc - Product / Service
- Exhibits129: Axcelis Technologies Inc - Key offerings
- Exhibits130: EV Group - Overview
- Exhibits131: EV Group - Product / Service
- Exhibits132: EV Group - Key offerings
- Exhibits133: Hitachi Ltd. - Overview
- Exhibits134: Hitachi Ltd. - Business segments
- Exhibits135: Hitachi Ltd. - Key news
- Exhibits136: Hitachi Ltd. - Key offerings
- Exhibits137: Hitachi Ltd. - Segment focus
- Exhibits138: KLA Corp. - Overview
- Exhibits139: KLA Corp. - Business segments
- Exhibits140: KLA Corp. - Key offerings
- Exhibits141: KLA Corp. - Segment focus
- Exhibits142: Lam Research Corp. - Overview
- Exhibits143: Lam Research Corp. - Product / Service
- Exhibits144: Lam Research Corp. - Key news
- Exhibits145: Lam Research Corp. - Key offerings
- Exhibits146: Nikon Corp. - Overview
- Exhibits147: Nikon Corp. - Business segments
- Exhibits148: Nikon Corp. - Key news
- Exhibits149: Nikon Corp. - Key offerings
- Exhibits150: Nikon Corp. - Segment focus
- Exhibits151: Nova Measuring Instruments Ltd. - Overview
- Exhibits152: Nova Measuring Instruments Ltd. - Product / Service
- Exhibits153: Nova Measuring Instruments Ltd. - Key offerings
- Exhibits154: Onto Innovation Inc. - Overview
- Exhibits155: Onto Innovation Inc. - Product / Service
- Exhibits156: Onto Innovation Inc. - Key offerings
- Exhibits157: PLASMA THERM - Overview
- Exhibits158: PLASMA THERM - Product / Service
- Exhibits159: PLASMA THERM - Key offerings
- Exhibits160: Teradyne Inc. - Overview
- Exhibits161: Teradyne Inc. - Business segments
- Exhibits162: Teradyne Inc. - Key news
- Exhibits163: Teradyne Inc. - Key offerings
- Exhibits164: Teradyne Inc. - Segment focus
- Exhibits165: Tokyo Electron Ltd. - Overview
- Exhibits166: Tokyo Electron Ltd. - Business segments
- Exhibits167: Tokyo Electron Ltd. - Key offerings
- Exhibits168: Tokyo Electron Ltd. - Segment focus
- Exhibits169: Veeco Instruments Inc. - Overview
- Exhibits170: Veeco Instruments Inc. - Product / Service
- Exhibits171: Veeco Instruments Inc. - Key offerings
- Exhibits172: Inclusions checklist
- Exhibits173: Exclusions checklist
- Exhibits174: Currency conversion rates for US$
- Exhibits175: Research methodology
- Exhibits176: Validation techniques employed for market sizing
- Exhibits177: Information sources
- Exhibits178: List of abbreviations
The semiconductor manufacturing equipment market is forecasted to grow by USD 46.68 bn during 2023-2028, accelerating at a CAGR of 7.74% during the forecast period. The report on the semiconductor manufacturing equipment market provides a holistic analysis, market size and forecast, trends, growth drivers, and challenges, as well as vendor analysis covering around 25 vendors.
The report offers an up-to-date analysis regarding the current market scenario, the latest trends and drivers, and the overall market environment. The market is driven by increasing investment in semiconductor fabrication, expansion of 5G networks requiring advanced semiconductor fabrication capabilities, and growing number of outsourced semiconductor assembly and test (OSAT) vendors in APAC.
Technavio's semiconductor manufacturing equipment market is segmented as below:
| Market Scope | |
|---|---|
| Base Year | 2024 |
| End Year | 2028 |
| Series Year | 2024-2028 |
| Growth Momentum | Accelerate |
| YOY 2024 | 7.26% |
| CAGR | 7.74% |
| Incremental Value | $46.68bn |
By Application
- Semiconductor fabrication plant or foundry
- Testing and inspection
- Semiconductor electronics manufacturing
By Type
- Front end
- Back end
By Geography
- APAC
- Europe
- North America
- Middle East and Africa
- South America
This study identifies the developments in semiconductor manufacturing equipment industry as one of the prime reasons driving the semiconductor manufacturing equipment market growth during the next few years. Also, adoption of advanced lithography technologies for smaller node sizes and increasing focus on wafer-level packaging and heterogeneous integration will lead to sizable demand in the market.
The report on the semiconductor manufacturing equipment market covers the following areas:
- Semiconductor manufacturing equipment market sizing
- Semiconductor manufacturing equipment market forecast
- Semiconductor manufacturing equipment market industry analysis
The robust vendor analysis is designed to help clients improve their market position, and in line with this, this report provides a detailed analysis of several leading semiconductor manufacturing equipment market vendors that include Applied Materials Inc., ASM International NV, ASML, Axcelis Technologies Inc, EV Group, Hitachi Ltd., KLA Corp., Lam Research Corp., Nikon Corp., Nova Measuring Instruments Ltd., Onto Innovation Inc., PLASMA THERM, Screen Holdings Co. Ltd., Teradyne Inc., Tokyo Electron Ltd., and Veeco Instruments Inc.. Also, the semiconductor manufacturing equipment market analysis report includes information on upcoming trends and challenges that will influence market growth. This is to help companies strategize and leverage all forthcoming growth opportunities.
The study was conducted using an objective combination of primary and secondary information including inputs from key participants in the industry. The report contains a comprehensive market and vendor landscape in addition to an analysis of the key vendors.
The publisher presents a detailed picture of the market by the way of study, synthesis, and summation of data from multiple sources by an analysis of key parameters such as profit, pricing, competition, and promotions. It presents various market facets by identifying the key industry influencers. The data presented is comprehensive, reliable, and a result of extensive research - both primary and secondary. The market research reports provide a complete competitive landscape and an in-depth vendor selection methodology and analysis using qualitative and quantitative research to forecast the accurate market growth.
Table of Contents
1 Executive Summary
- 1.1 Market overview
2 Market Landscape
- 2.1 Market ecosystem
3 Market Sizing
- 3.1 Market definition
- 3.2 Market segment analysis
- 3.3 Market size 2023
- 3.4 Market outlook: Forecast for 2023-2028
4 Historic Market Size
- 4.1 Global semiconductor manufacturing equipment market 2018 - 2022
- 4.2 Application Segment Analysis 2018 - 2022
- 4.3 Type Segment Analysis 2018 - 2022
- 4.4 Geography Segment Analysis 2018 - 2022
- 4.5 Country Segment Analysis 2018 - 2022
5 Five Forces Analysis
- 5.1 Five forces summary
- 5.2 Bargaining power of buyers
- 5.3 Bargaining power of suppliers
- 5.4 Threat of new entrants
- 5.5 Threat of substitutes
- 5.6 Threat of rivalry
- 5.7 Market condition
6 Market Segmentation by Application
- 6.1 Market segments
- 6.2 Comparison by Application
- 6.3 Semiconductor fabrication plant or foundry - Market size and forecast 2023-2028
- 6.4 Testing and inspection - Market size and forecast 2023-2028
- 6.5 Semiconductor electronics manufacturing - Market size and forecast 2023-2028
- 6.6 Market opportunity by Application
7 Market Segmentation by Type
- 7.1 Market segments
- 7.2 Comparison by Type
- 7.3 Front end - Market size and forecast 2023-2028
- 7.4 Back end - Market size and forecast 2023-2028
- 7.5 Market opportunity by Type
8 Customer Landscape
- 8.1 Customer landscape overview
9 Geographic Landscape
- 9.1 Geographic segmentation
- 9.2 Geographic comparison
- 9.3 APAC - Market size and forecast 2023-2028
- 9.4 Europe - Market size and forecast 2023-2028
- 9.5 North America - Market size and forecast 2023-2028
- 9.6 Middle East and Africa - Market size and forecast 2023-2028
- 9.7 South America - Market size and forecast 2023-2028
- 9.8 China - Market size and forecast 2023-2028
- 9.9 India - Market size and forecast 2023-2028
- 9.10 Taiwan - Market size and forecast 2023-2028
- 9.11 Germany - Market size and forecast 2023-2028
- 9.12 US - Market size and forecast 2023-2028
- 9.13 Market opportunity by geography
10 Drivers, Challenges, and Trends
- 10.1 Market drivers
- 10.2 Market challenges
- 10.3 Impact of drivers and challenges
- 10.4 Market trends
11 Vendor Landscape
- 11.1 Overview
- 11.2 Vendor landscape
- 11.3 Landscape disruption
- 11.4 Industry risks
12 Vendor Analysis
- 12.1 Vendors covered
- 12.2 Market positioning of vendors
- 12.3 Applied Materials Inc.
- 12.4 ASM International NV
- 12.5 ASML
- 12.6 Axcelis Technologies Inc
- 12.7 EV Group
- 12.8 Hitachi Ltd.
- 12.9 KLA Corp.
- 12.10 Lam Research Corp.
- 12.11 Nikon Corp.
- 12.12 Nova Measuring Instruments Ltd.
- 12.13 Onto Innovation Inc.
- 12.14 PLASMA THERM
- 12.15 Teradyne Inc.
- 12.16 Tokyo Electron Ltd.
- 12.17 Veeco Instruments Inc.
13 Appendix
- 13.1 Scope of the report
- 13.2 Inclusions and exclusions checklist
- 13.3 Currency conversion rates for US$
- 13.4 Research methodology
- 13.5 List of abbreviations

