|
|
市場調査レポート
商品コード
1634320
建築レンダリングソフトウェアの世界市場(2025年~2029年)Global Architectural Rendering Software Market 2025-2029 |
||||||

|
|||||||
カスタマイズ可能
|
|||||||

| 建築レンダリングソフトウェアの世界市場(2025年~2029年) |
|
出版日: 2025年01月01日
発行: TechNavio
ページ情報: 英文 202 Pages
納期: 即納可能
|

全表示
- 概要
- 図表
- 目次
建築レンダリングソフトウェア市場(2025年~2029年)
世界の建築レンダリングソフトウェアの市場規模は、2024年~2029年に22億890万米ドルに達し、予測期間中のCAGRは21.6%で成長すると予測されます。当レポートでは、建築レンダリングソフトウェア市場の全体的な分析、市場規模・予測、動向、成長促進要因、課題、約25のベンダーを網羅したベンダー分析などを掲載しています。
本レポートは、現在の市場シナリオ、最新動向と促進要因、市場環境全体に関する最新分析を提供しています。市場は、新興国における建築レンダリングソフトウェアの需要拡大、建設品質の向上ニーズの高まり、ビルディングインフォメーションモデリング(BIM)の採用急増などが牽引しています。
| 市場範囲 | |
|---|---|
| 基準年 | 2025年 |
| 終了年 | 2029年 |
| 予測期間 | 2025年~2029年 |
| 成長モメンタム | 加速 |
| 前年比2025年 | 20.3% |
| CAGR | 21.6% |
| 増分額 | 22億890万米ドル |
本調査では、今後数年間における建築レンダリングソフトウェア市場の成長を促進する主な要因の一つとして、ノンフォトリアリスティックレンダリングに対する需要の高まりを挙げています。また、スマートシティ計画への建築レンダリングソフトウェア採用の増加や、建設業界における持続可能性への注目の高まりも、市場の大きな需要につながる見通しです。
目次
第1章 エグゼクティブサマリー
- 市場概要
第2章 Technavioの分析
- 価格感度・ライフサイクル・顧客購入バスケット・採用率・購入基準の分析
- インプットの重要性と差別化の要因
- ディスラプションの要因
- 促進要因と課題の影響
第3章 市場情勢
- 市場エコシステム
- 市場の特徴
- バリューチェーン分析
第4章 市場規模
- 市場の定義
- 市場セグメント分析
- 市場規模(2024年)
- 市場の見通し(2024年~2029年)
第5章 市場規模実績
- 建築レンダリングソフトウェアの世界市場(2019年~2023年)
- 用途セグメント分析(2019年~2023年)
- 展開セグメント分析(2019年~2023年)
- 地域セグメント分析(2019年~2023年)
- 国セグメント分析(2019年~2023年)
第6章 定性分析
- AIの影響:建築レンダリングソフトウェアの世界市場
第7章 ファイブフォース分析
- ファイブフォースの要約
- 買い手の交渉力
- 供給企業の交渉力
- 新規参入業者の脅威
- 代替品の脅威
- 競争の脅威
- 市況
第8章 市場セグメンテーション:用途別
- 市場セグメント
- 比較:用途別
- 非住宅:市場規模と予測(2024年~2029年)
- 住宅:市場規模と予測(2024年~2029年)
- その他:市場規模と予測(2024年~2029年)
- 市場機会:用途別
第9章 市場セグメンテーション:展開別
- 市場セグメント
- 比較:展開別
- オンプレミス:市場規模と予測(2024年~2029年)
- クラウド:市場規模と予測(2024年~2029年)
- 市場機会:展開別
第10章 顧客情勢
- 顧客情勢の概要
第11章 地域別情勢
- 地域別セグメンテーション
- 地域別比較
- 北米:市場規模と予測(2024年~2029年)
- 欧州:市場規模と予測(2024年~2029年)
- アジア太平洋:市場規模と予測(2024年~2029年)
- 中東・アフリカ:市場規模と予測(2024年~2029年)
- 南米:市場規模と予測(2024年~2029年)
- 米国:市場規模と予測(2024年~2029年)
- 英国:市場規模と予測(2024年~2029年)
- 中国:市場規模と予測(2024年~2029年)
- ドイツ:市場規模と予測(2024年~2029年)
- カナダ:市場規模と予測(2024年~2029年)
- 日本:市場規模と予測(2024年~2029年)
- フランス:市場規模と予測(2024年~2029年)
- イタリア:市場規模と予測(2024年~2029年)
- インド:市場規模と予測(2024年~2029年)
- ブラジル:市場規模と予測(2024年~2029年)
- 市場機会:地域情勢別
第12章 促進要因・課題・機会・抑制要因
- 市場促進要因
- 市場の課題
- 促進要因と課題の影響
- 市場の機会・抑制要因
第13章 競合情勢
- 概要
- 競合情勢
- ディスラプションの状況
- 業界のリスク
第14章 競合分析
- 企業プロファイル
- 企業ランキング指数
- 企業の市場ポジショニング
- Altair Engineering Inc.
- Autodesk Inc.
- Chaos Software Ltd.
- Daz Productions Inc.
- Floorplanner.com BV
- Lumion
- Luxion Inc.
- Nemetschek SE
- NEXT LIMIT SL
- NVIDIA Corp.
- OTOY Inc.
- Robert McNeel and Associates
- Roper Technologies Inc.
- Shapespark sp. Zoo
- Vrender Co.
第15章 付録
Exhibits:
- Exhibits1: Executive Summary - Chart on Market Overview
- Exhibits2: Executive Summary - Data Table on Market Overview
- Exhibits3: Executive Summary - Chart on Global Market Characteristics
- Exhibits4: Executive Summary - Chart on Market By Geographical Landscape
- Exhibits5: Executive Summary - Chart on Market Segmentation by Application
- Exhibits6: Executive Summary - Chart on Market Segmentation by Deployment
- Exhibits7: Executive Summary - Chart on Incremental Growth
- Exhibits8: Executive Summary - Data Table on Incremental Growth
- Exhibits9: Executive Summary - Chart on Company Market Positioning
- Exhibits10: Analysis of price sensitivity, lifecycle, customer purchase basket, adoption rates, and purchase criteria
- Exhibits11: Overview on criticality of inputs and factors of differentiation
- Exhibits12: Overview on factors of disruption
- Exhibits13: Impact of drivers and challenges in 2024 and 2029
- Exhibits14: Parent Market
- Exhibits15: Data Table on - Parent Market
- Exhibits16: Market characteristics analysis
- Exhibits17: Value chain analysis
- Exhibits18: Offerings of companies included in the market definition
- Exhibits19: Market segments
- Exhibits20: Chart on Global - Market size and forecast 2024-2029 ($ million)
- Exhibits21: Data Table on Global - Market size and forecast 2024-2029 ($ million)
- Exhibits22: Chart on Global Market: Year-over-year growth 2024-2029 (%)
- Exhibits23: Data Table on Global Market: Year-over-year growth 2024-2029 (%)
- Exhibits24: Historic Market Size - Data Table on Global Architectural Rendering Software Market 2019 - 2023 ($ million)
- Exhibits25: Historic Market Size - Application Segment 2019 - 2023 ($ million)
- Exhibits26: Historic Market Size - Deployment Segment 2019 - 2023 ($ million)
- Exhibits27: Historic Market Size - Geography Segment 2019 - 2023 ($ million)
- Exhibits28: Historic Market Size - Country Segment 2019 - 2023 ($ million)
- Exhibits29: Five forces analysis - Comparison between 2024 and 2029
- Exhibits30: Bargaining power of buyers - Impact of key factors 2024 and 2029
- Exhibits31: Bargaining power of suppliers - Impact of key factors in 2024 and 2029
- Exhibits32: Threat of new entrants - Impact of key factors in 2024 and 2029
- Exhibits33: Threat of substitutes - Impact of key factors in 2024 and 2029
- Exhibits34: Threat of rivalry - Impact of key factors in 2024 and 2029
- Exhibits35: Chart on Market condition - Five forces 2024 and 2029
- Exhibits36: Chart on Application - Market share 2024-2029 (%)
- Exhibits37: Data Table on Application - Market share 2024-2029 (%)
- Exhibits38: Chart on Comparison by Application
- Exhibits39: Data Table on Comparison by Application
- Exhibits40: Chart on Non-residential - Market size and forecast 2024-2029 ($ million)
- Exhibits41: Data Table on Non-residential - Market size and forecast 2024-2029 ($ million)
- Exhibits42: Chart on Non-residential - Year-over-year growth 2024-2029 (%)
- Exhibits43: Data Table on Non-residential - Year-over-year growth 2024-2029 (%)
- Exhibits44: Chart on Residential - Market size and forecast 2024-2029 ($ million)
- Exhibits45: Data Table on Residential - Market size and forecast 2024-2029 ($ million)
- Exhibits46: Chart on Residential - Year-over-year growth 2024-2029 (%)
- Exhibits47: Data Table on Residential - Year-over-year growth 2024-2029 (%)
- Exhibits48: Chart on Others - Market size and forecast 2024-2029 ($ million)
- Exhibits49: Data Table on Others - Market size and forecast 2024-2029 ($ million)
- Exhibits50: Chart on Others - Year-over-year growth 2024-2029 (%)
- Exhibits51: Data Table on Others - Year-over-year growth 2024-2029 (%)
- Exhibits52: Market opportunity by Application ($ million)
- Exhibits53: Data Table on Market opportunity by Application ($ million)
- Exhibits54: Chart on Deployment - Market share 2024-2029 (%)
- Exhibits55: Data Table on Deployment - Market share 2024-2029 (%)
- Exhibits56: Chart on Comparison by Deployment
- Exhibits57: Data Table on Comparison by Deployment
- Exhibits58: Chart on On-premises - Market size and forecast 2024-2029 ($ million)
- Exhibits59: Data Table on On-premises - Market size and forecast 2024-2029 ($ million)
- Exhibits60: Chart on On-premises - Year-over-year growth 2024-2029 (%)
- Exhibits61: Data Table on On-premises - Year-over-year growth 2024-2029 (%)
- Exhibits62: Chart on Cloud - Market size and forecast 2024-2029 ($ million)
- Exhibits63: Data Table on Cloud - Market size and forecast 2024-2029 ($ million)
- Exhibits64: Chart on Cloud - Year-over-year growth 2024-2029 (%)
- Exhibits65: Data Table on Cloud - Year-over-year growth 2024-2029 (%)
- Exhibits66: Market opportunity by Deployment ($ million)
- Exhibits67: Data Table on Market opportunity by Deployment ($ million)
- Exhibits68: Analysis of price sensitivity, lifecycle, customer purchase basket, adoption rates, and purchase criteria
- Exhibits69: Chart on Market share By Geographical Landscape 2024-2029 (%)
- Exhibits70: Data Table on Market share By Geographical Landscape 2024-2029 (%)
- Exhibits71: Chart on Geographic comparison
- Exhibits72: Data Table on Geographic comparison
- Exhibits73: Chart on North America - Market size and forecast 2024-2029 ($ million)
- Exhibits74: Data Table on North America - Market size and forecast 2024-2029 ($ million)
- Exhibits75: Chart on North America - Year-over-year growth 2024-2029 (%)
- Exhibits76: Data Table on North America - Year-over-year growth 2024-2029 (%)
- Exhibits77: Chart on Europe - Market size and forecast 2024-2029 ($ million)
- Exhibits78: Data Table on Europe - Market size and forecast 2024-2029 ($ million)
- Exhibits79: Chart on Europe - Year-over-year growth 2024-2029 (%)
- Exhibits80: Data Table on Europe - Year-over-year growth 2024-2029 (%)
- Exhibits81: Chart on APAC - Market size and forecast 2024-2029 ($ million)
- Exhibits82: Data Table on APAC - Market size and forecast 2024-2029 ($ million)
- Exhibits83: Chart on APAC - Year-over-year growth 2024-2029 (%)
- Exhibits84: Data Table on APAC - Year-over-year growth 2024-2029 (%)
- Exhibits85: Chart on Middle East and Africa - Market size and forecast 2024-2029 ($ million)
- Exhibits86: Data Table on Middle East and Africa - Market size and forecast 2024-2029 ($ million)
- Exhibits87: Chart on Middle East and Africa - Year-over-year growth 2024-2029 (%)
- Exhibits88: Data Table on Middle East and Africa - Year-over-year growth 2024-2029 (%)
- Exhibits89: Chart on South America - Market size and forecast 2024-2029 ($ million)
- Exhibits90: Data Table on South America - Market size and forecast 2024-2029 ($ million)
- Exhibits91: Chart on South America - Year-over-year growth 2024-2029 (%)
- Exhibits92: Data Table on South America - Year-over-year growth 2024-2029 (%)
- Exhibits93: Chart on US - Market size and forecast 2024-2029 ($ million)
- Exhibits94: Data Table on US - Market size and forecast 2024-2029 ($ million)
- Exhibits95: Chart on US - Year-over-year growth 2024-2029 (%)
- Exhibits96: Data Table on US - Year-over-year growth 2024-2029 (%)
- Exhibits97: Chart on UK - Market size and forecast 2024-2029 ($ million)
- Exhibits98: Data Table on UK - Market size and forecast 2024-2029 ($ million)
- Exhibits99: Chart on UK - Year-over-year growth 2024-2029 (%)
- Exhibits100: Data Table on UK - Year-over-year growth 2024-2029 (%)
- Exhibits101: Chart on China - Market size and forecast 2024-2029 ($ million)
- Exhibits102: Data Table on China - Market size and forecast 2024-2029 ($ million)
- Exhibits103: Chart on China - Year-over-year growth 2024-2029 (%)
- Exhibits104: Data Table on China - Year-over-year growth 2024-2029 (%)
- Exhibits105: Chart on Germany - Market size and forecast 2024-2029 ($ million)
- Exhibits106: Data Table on Germany - Market size and forecast 2024-2029 ($ million)
- Exhibits107: Chart on Germany - Year-over-year growth 2024-2029 (%)
- Exhibits108: Data Table on Germany - Year-over-year growth 2024-2029 (%)
- Exhibits109: Chart on Canada - Market size and forecast 2024-2029 ($ million)
- Exhibits110: Data Table on Canada - Market size and forecast 2024-2029 ($ million)
- Exhibits111: Chart on Canada - Year-over-year growth 2024-2029 (%)
- Exhibits112: Data Table on Canada - Year-over-year growth 2024-2029 (%)
- Exhibits113: Chart on Japan - Market size and forecast 2024-2029 ($ million)
- Exhibits114: Data Table on Japan - Market size and forecast 2024-2029 ($ million)
- Exhibits115: Chart on Japan - Year-over-year growth 2024-2029 (%)
- Exhibits116: Data Table on Japan - Year-over-year growth 2024-2029 (%)
- Exhibits117: Chart on France - Market size and forecast 2024-2029 ($ million)
- Exhibits118: Data Table on France - Market size and forecast 2024-2029 ($ million)
- Exhibits119: Chart on France - Year-over-year growth 2024-2029 (%)
- Exhibits120: Data Table on France - Year-over-year growth 2024-2029 (%)
- Exhibits121: Chart on Italy - Market size and forecast 2024-2029 ($ million)
- Exhibits122: Data Table on Italy - Market size and forecast 2024-2029 ($ million)
- Exhibits123: Chart on Italy - Year-over-year growth 2024-2029 (%)
- Exhibits124: Data Table on Italy - Year-over-year growth 2024-2029 (%)
- Exhibits125: Chart on India - Market size and forecast 2024-2029 ($ million)
- Exhibits126: Data Table on India - Market size and forecast 2024-2029 ($ million)
- Exhibits127: Chart on India - Year-over-year growth 2024-2029 (%)
- Exhibits128: Data Table on India - Year-over-year growth 2024-2029 (%)
- Exhibits129: Chart on Brazil - Market size and forecast 2024-2029 ($ million)
- Exhibits130: Data Table on Brazil - Market size and forecast 2024-2029 ($ million)
- Exhibits131: Chart on Brazil - Year-over-year growth 2024-2029 (%)
- Exhibits132: Data Table on Brazil - Year-over-year growth 2024-2029 (%)
- Exhibits133: Market opportunity By Geographical Landscape ($ million)
- Exhibits134: Data Tables on Market opportunity By Geographical Landscape ($ million)
- Exhibits135: Impact of drivers and challenges in 2024 and 2029
- Exhibits136: Overview on criticality of inputs and factors of differentiation
- Exhibits137: Overview on factors of disruption
- Exhibits138: Impact of key risks on business
- Exhibits139: Companies covered
- Exhibits140: Company ranking index
- Exhibits141: Matrix on companies position and classification
- Exhibits142: Altair Engineering Inc. - Overview
- Exhibits143: Altair Engineering Inc. - Business segments
- Exhibits144: Altair Engineering Inc. - Key news
- Exhibits145: Altair Engineering Inc. - Key offerings
- Exhibits146: Altair Engineering Inc. - Segment focus
- Exhibits147: SWOT
- Exhibits148: Autodesk Inc. - Overview
- Exhibits149: Autodesk Inc. - Product / Service
- Exhibits150: Autodesk Inc. - Key news
- Exhibits151: Autodesk Inc. - Key offerings
- Exhibits152: SWOT
- Exhibits153: Chaos Software Ltd. - Overview
- Exhibits154: Chaos Software Ltd. - Product / Service
- Exhibits155: Chaos Software Ltd. - Key offerings
- Exhibits156: SWOT
- Exhibits157: Daz Productions Inc. - Overview
- Exhibits158: Daz Productions Inc. - Product / Service
- Exhibits159: Daz Productions Inc. - Key offerings
- Exhibits160: SWOT
- Exhibits161: Floorplanner.com BV - Overview
- Exhibits162: Floorplanner.com BV - Product / Service
- Exhibits163: Floorplanner.com BV - Key offerings
- Exhibits164: SWOT
- Exhibits165: Lumion - Overview
- Exhibits166: Lumion - Product / Service
- Exhibits167: Lumion - Key offerings
- Exhibits168: SWOT
- Exhibits169: Luxion Inc. - Overview
- Exhibits170: Luxion Inc. - Product / Service
- Exhibits171: Luxion Inc. - Key offerings
- Exhibits172: SWOT
- Exhibits173: Nemetschek SE - Overview
- Exhibits174: Nemetschek SE - Business segments
- Exhibits175: Nemetschek SE - Key news
- Exhibits176: Nemetschek SE - Key offerings
- Exhibits177: Nemetschek SE - Segment focus
- Exhibits178: SWOT
- Exhibits179: NEXT LIMIT SL - Overview
- Exhibits180: NEXT LIMIT SL - Product / Service
- Exhibits181: NEXT LIMIT SL - Key offerings
- Exhibits182: SWOT
- Exhibits183: NVIDIA Corp. - Overview
- Exhibits184: NVIDIA Corp. - Business segments
- Exhibits185: NVIDIA Corp. - Key news
- Exhibits186: NVIDIA Corp. - Key offerings
- Exhibits187: NVIDIA Corp. - Segment focus
- Exhibits188: SWOT
- Exhibits189: OTOY Inc. - Overview
- Exhibits190: OTOY Inc. - Product / Service
- Exhibits191: OTOY Inc. - Key offerings
- Exhibits192: SWOT
- Exhibits193: Robert McNeel and Associates - Overview
- Exhibits194: Robert McNeel and Associates - Product / Service
- Exhibits195: Robert McNeel and Associates - Key offerings
- Exhibits196: SWOT
- Exhibits197: Roper Technologies Inc. - Overview
- Exhibits198: Roper Technologies Inc. - Business segments
- Exhibits199: Roper Technologies Inc. - Key news
- Exhibits200: Roper Technologies Inc. - Key offerings
- Exhibits201: Roper Technologies Inc. - Segment focus
- Exhibits202: SWOT
- Exhibits203: Shapespark sp. Zoo - Overview
- Exhibits204: Shapespark sp. Zoo - Product / Service
- Exhibits205: Shapespark sp. Zoo - Key offerings
- Exhibits206: SWOT
- Exhibits207: Vrender Co. - Overview
- Exhibits208: Vrender Co. - Product / Service
- Exhibits209: Vrender Co. - Key offerings
- Exhibits210: SWOT
- Exhibits211: Inclusions checklist
- Exhibits212: Exclusions checklist
- Exhibits213: Currency conversion rates for US$
- Exhibits214: Research methodology
- Exhibits215: Information sources
- Exhibits216: Data validation
- Exhibits217: Validation techniques employed for market sizing
- Exhibits218: Data synthesis
- Exhibits219: 360 degree market analysis
- Exhibits220: List of abbreviations
Architectural Rendering Software Market 2025-2029
The architectural rendering software market is forecasted to grow by USD 2208.9 mn during 2024-2029, accelerating at a CAGR of 21.6% during the forecast period. The report on the architectural rendering software market provides a holistic analysis, market size and forecast, trends, growth drivers, and challenges, as well as vendor analysis covering around 25 vendors.
The report offers an up-to-date analysis regarding the current market scenario, the latest trends and drivers, and the overall market environment. The market is driven by growing demand for architectural rendering software in emerging economies, rising need to improve quality of construction, and upsurge in adoption of building information modeling (BIM).
| Market Scope | |
|---|---|
| Base Year | 2025 |
| End Year | 2029 |
| Series Year | 2025-2029 |
| Growth Momentum | Accelerate |
| YOY 2025 | 20.3% |
| CAGR | 21.6% |
| Incremental Value | $2208.9 mn |
Technavio's architectural rendering software market is segmented as below:
By Application
- Non-residential
- Residential
- Others
By Deployment
- On-premises
- Cloud
By Geographical Landscape
- North America
- Europe
- APAC
- Middle East and Africa
- South America
This study identifies the rising demand for non-photorealistic rendering as one of the prime reasons driving the architectural rendering software market growth during the next few years. Also, increasing adoption of architectural rendering software for planning smart cities and increasing focus on sustainability in construction industry will lead to sizable demand in the market.
The report on the architectural rendering software market covers the following areas:
- Architectural Rendering Software Market sizing
- Architectural Rendering Software Market forecast
- Architectural Rendering Software Market industry analysis
The robust vendor analysis is designed to help clients improve their market position, and in line with this, this report provides a detailed analysis of several leading architectural rendering software market vendors that include Altair Engineering Inc., Applet 3D, Autodesk Inc., Chaos Software Ltd., Daz Productions Inc., Floorplanner.com BV, Lumion, Luxion Inc., Nemetschek SE, NEXT LIMIT SL, NVIDIA Corp., OTOY Inc., RealSpace Vision Communication Inc., Robert McNeel and Associates, Roper Technologies Inc., Shapespark sp. Zoo, The Walt Disney Co., Trimble Inc., Vizrt Group, and Vrender Co.. Also, the architectural rendering software market analysis report includes information on upcoming trends and challenges that will influence market growth. This is to help companies strategize and leverage all forthcoming growth opportunities.
The study was conducted using an objective combination of primary and secondary information including inputs from key participants in the industry. The report contains a comprehensive market and vendor landscape in addition to an analysis of the key vendors.
The publisher presents a detailed picture of the market by the way of study, synthesis, and summation of data from multiple sources by an analysis of key parameters such as profit, pricing, competition, and promotions. It presents various market facets by identifying the key industry influencers. The data presented is comprehensive, reliable, and a result of extensive primary and secondary research. The market research reports provide a complete competitive landscape and an in-depth vendor selection methodology and analysis using qualitative and quantitative research to forecast accurate market growth.
Table of Contents
1 Executive Summary
- 1.1 Market overview
- Executive Summary - Chart on Market Overview
- Executive Summary - Data Table on Market Overview
- Executive Summary - Chart on Global Market Characteristics
- Executive Summary - Chart on Market By Geographical Landscape
- Executive Summary - Chart on Market Segmentation by Application
- Executive Summary - Chart on Market Segmentation by Deployment
- Executive Summary - Chart on Incremental Growth
- Executive Summary - Data Table on Incremental Growth
- Executive Summary - Chart on Company Market Positioning
2 Technavio Analysis
- 2.1 Analysis of price sensitivity, lifecycle, customer purchase basket, adoption rates, and purchase criteria
- Analysis of price sensitivity, lifecycle, customer purchase basket, adoption rates, and purchase criteria
- 2.2 Criticality of inputs and Factors of differentiation
- Overview on criticality of inputs and factors of differentiation
- 2.3 Factors of disruption
- Overview on factors of disruption
- 2.4 Impact of drivers and challenges
- Impact of drivers and challenges in 2024 and 2029
3 Market Landscape
- 3.1 Market ecosystem
- Parent Market
- Data Table on - Parent Market
- 3.2 Market characteristics
- Market characteristics analysis
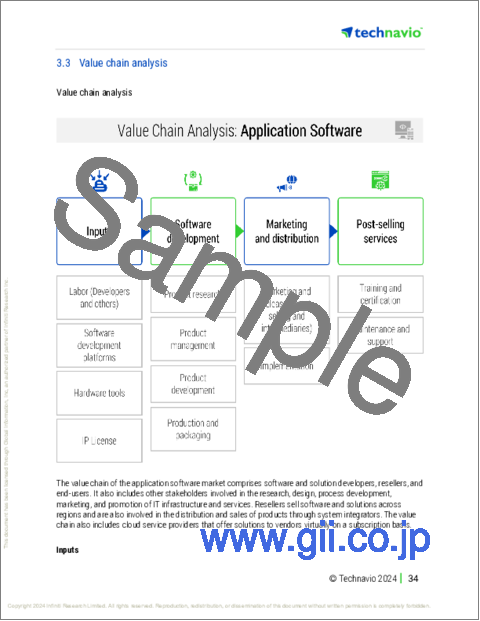
- 3.3 Value chain analysis
- Value chain analysis
4 Market Sizing
- 4.1 Market definition
- Offerings of companies included in the market definition
- 4.2 Market segment analysis
- Market segments
- 4.3 Market size 2024
- 4.4 Market outlook: Forecast for 2024-2029
- Chart on Global - Market size and forecast 2024-2029 ($ million)
- Data Table on Global - Market size and forecast 2024-2029 ($ million)
- Chart on Global Market: Year-over-year growth 2024-2029 (%)
- Data Table on Global Market: Year-over-year growth 2024-2029 (%)
5 Historic Market Size
- 5.1 Global Architectural Rendering Software Market 2019 - 2023
- Historic Market Size - Data Table on Global Architectural Rendering Software Market 2019 - 2023 ($ million)
- 5.2 Application segment analysis 2019 - 2023
- Historic Market Size - Application Segment 2019 - 2023 ($ million)
- 5.3 Deployment segment analysis 2019 - 2023
- Historic Market Size - Deployment Segment 2019 - 2023 ($ million)
- 5.4 Geography segment analysis 2019 - 2023
- Historic Market Size - Geography Segment 2019 - 2023 ($ million)
- 5.5 Country segment analysis 2019 - 2023
- Historic Market Size - Country Segment 2019 - 2023 ($ million)
6 Qualitative Analysis
- 6.1 Impact of AI on the Global Architectural Rendering Software Market
7 Five Forces Analysis
- 7.1 Five forces summary
- Five forces analysis - Comparison between 2024 and 2029
- 7.2 Bargaining power of buyers
- Bargaining power of buyers - Impact of key factors 2024 and 2029
- 7.3 Bargaining power of suppliers
- Bargaining power of suppliers - Impact of key factors in 2024 and 2029
- 7.4 Threat of new entrants
- Threat of new entrants - Impact of key factors in 2024 and 2029
- 7.5 Threat of substitutes
- Threat of substitutes - Impact of key factors in 2024 and 2029
- 7.6 Threat of rivalry
- Threat of rivalry - Impact of key factors in 2024 and 2029
- 7.7 Market condition
- Chart on Market condition - Five forces 2024 and 2029
8 Market Segmentation by Application
- 8.1 Market segments
- Chart on Application - Market share 2024-2029 (%)
- Data Table on Application - Market share 2024-2029 (%)
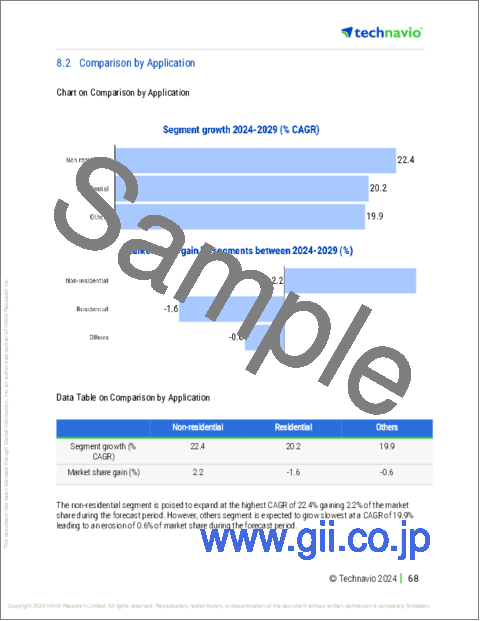
- 8.2 Comparison by Application
- Chart on Comparison by Application
- Data Table on Comparison by Application
- 8.3 Non-residential - Market size and forecast 2024-2029
- Chart on Non-residential - Market size and forecast 2024-2029 ($ million)
- Data Table on Non-residential - Market size and forecast 2024-2029 ($ million)
- Chart on Non-residential - Year-over-year growth 2024-2029 (%)
- Data Table on Non-residential - Year-over-year growth 2024-2029 (%)
- 8.4 Residential - Market size and forecast 2024-2029
- Chart on Residential - Market size and forecast 2024-2029 ($ million)
- Data Table on Residential - Market size and forecast 2024-2029 ($ million)
- Chart on Residential - Year-over-year growth 2024-2029 (%)
- Data Table on Residential - Year-over-year growth 2024-2029 (%)
- 8.5 Others - Market size and forecast 2024-2029
- Chart on Others - Market size and forecast 2024-2029 ($ million)
- Data Table on Others - Market size and forecast 2024-2029 ($ million)
- Chart on Others - Year-over-year growth 2024-2029 (%)
- Data Table on Others - Year-over-year growth 2024-2029 (%)
- 8.6 Market opportunity by Application
- Market opportunity by Application ($ million)
- Data Table on Market opportunity by Application ($ million)
9 Market Segmentation by Deployment
- 9.1 Market segments
- Chart on Deployment - Market share 2024-2029 (%)
- Data Table on Deployment - Market share 2024-2029 (%)
- 9.2 Comparison by Deployment
- Chart on Comparison by Deployment
- Data Table on Comparison by Deployment
- 9.3 On-premises - Market size and forecast 2024-2029
- Chart on On-premises - Market size and forecast 2024-2029 ($ million)
- Data Table on On-premises - Market size and forecast 2024-2029 ($ million)
- Chart on On-premises - Year-over-year growth 2024-2029 (%)
- Data Table on On-premises - Year-over-year growth 2024-2029 (%)
- 9.4 Cloud - Market size and forecast 2024-2029
- Chart on Cloud - Market size and forecast 2024-2029 ($ million)
- Data Table on Cloud - Market size and forecast 2024-2029 ($ million)
- Chart on Cloud - Year-over-year growth 2024-2029 (%)
- Data Table on Cloud - Year-over-year growth 2024-2029 (%)
- 9.5 Market opportunity by Deployment
- Market opportunity by Deployment ($ million)
- Data Table on Market opportunity by Deployment ($ million)
10 Customer Landscape
- 10.1 Customer landscape overview
- Analysis of price sensitivity, lifecycle, customer purchase basket, adoption rates, and purchase criteria
11 Geographic Landscape
- 11.1 Geographic segmentation
- Chart on Market share By Geographical Landscape 2024-2029 (%)
- Data Table on Market share By Geographical Landscape 2024-2029 (%)
- 11.2 Geographic comparison
- Chart on Geographic comparison
- Data Table on Geographic comparison
- 11.3 North America - Market size and forecast 2024-2029
- Chart on North America - Market size and forecast 2024-2029 ($ million)
- Data Table on North America - Market size and forecast 2024-2029 ($ million)
- Chart on North America - Year-over-year growth 2024-2029 (%)
- Data Table on North America - Year-over-year growth 2024-2029 (%)
- 11.4 Europe - Market size and forecast 2024-2029
- Chart on Europe - Market size and forecast 2024-2029 ($ million)
- Data Table on Europe - Market size and forecast 2024-2029 ($ million)
- Chart on Europe - Year-over-year growth 2024-2029 (%)
- Data Table on Europe - Year-over-year growth 2024-2029 (%)
- 11.5 APAC - Market size and forecast 2024-2029
- Chart on APAC - Market size and forecast 2024-2029 ($ million)
- Data Table on APAC - Market size and forecast 2024-2029 ($ million)
- Chart on APAC - Year-over-year growth 2024-2029 (%)
- Data Table on APAC - Year-over-year growth 2024-2029 (%)
- 11.6 Middle East and Africa - Market size and forecast 2024-2029
- Chart on Middle East and Africa - Market size and forecast 2024-2029 ($ million)
- Data Table on Middle East and Africa - Market size and forecast 2024-2029 ($ million)
- Chart on Middle East and Africa - Year-over-year growth 2024-2029 (%)
- Data Table on Middle East and Africa - Year-over-year growth 2024-2029 (%)
- 11.7 South America - Market size and forecast 2024-2029
- Chart on South America - Market size and forecast 2024-2029 ($ million)
- Data Table on South America - Market size and forecast 2024-2029 ($ million)
- Chart on South America - Year-over-year growth 2024-2029 (%)
- Data Table on South America - Year-over-year growth 2024-2029 (%)
- 11.8 US - Market size and forecast 2024-2029
- Chart on US - Market size and forecast 2024-2029 ($ million)
- Data Table on US - Market size and forecast 2024-2029 ($ million)
- Chart on US - Year-over-year growth 2024-2029 (%)
- Data Table on US - Year-over-year growth 2024-2029 (%)
- 11.9 UK - Market size and forecast 2024-2029
- Chart on UK - Market size and forecast 2024-2029 ($ million)
- Data Table on UK - Market size and forecast 2024-2029 ($ million)
- Chart on UK - Year-over-year growth 2024-2029 (%)
- Data Table on UK - Year-over-year growth 2024-2029 (%)
- 11.10 China - Market size and forecast 2024-2029
- Chart on China - Market size and forecast 2024-2029 ($ million)
- Data Table on China - Market size and forecast 2024-2029 ($ million)
- Chart on China - Year-over-year growth 2024-2029 (%)
- Data Table on China - Year-over-year growth 2024-2029 (%)
- 11.11 Germany - Market size and forecast 2024-2029
- Chart on Germany - Market size and forecast 2024-2029 ($ million)
- Data Table on Germany - Market size and forecast 2024-2029 ($ million)
- Chart on Germany - Year-over-year growth 2024-2029 (%)
- Data Table on Germany - Year-over-year growth 2024-2029 (%)
- 11.12 Canada - Market size and forecast 2024-2029
- Chart on Canada - Market size and forecast 2024-2029 ($ million)
- Data Table on Canada - Market size and forecast 2024-2029 ($ million)
- Chart on Canada - Year-over-year growth 2024-2029 (%)
- Data Table on Canada - Year-over-year growth 2024-2029 (%)
- 11.13 Japan - Market size and forecast 2024-2029
- Chart on Japan - Market size and forecast 2024-2029 ($ million)
- Data Table on Japan - Market size and forecast 2024-2029 ($ million)
- Chart on Japan - Year-over-year growth 2024-2029 (%)
- Data Table on Japan - Year-over-year growth 2024-2029 (%)
- 11.14 France - Market size and forecast 2024-2029
- Chart on France - Market size and forecast 2024-2029 ($ million)
- Data Table on France - Market size and forecast 2024-2029 ($ million)
- Chart on France - Year-over-year growth 2024-2029 (%)
- Data Table on France - Year-over-year growth 2024-2029 (%)
- 11.15 Italy - Market size and forecast 2024-2029
- Chart on Italy - Market size and forecast 2024-2029 ($ million)
- Data Table on Italy - Market size and forecast 2024-2029 ($ million)
- Chart on Italy - Year-over-year growth 2024-2029 (%)
- Data Table on Italy - Year-over-year growth 2024-2029 (%)
- 11.16 India - Market size and forecast 2024-2029
- Chart on India - Market size and forecast 2024-2029 ($ million)
- Data Table on India - Market size and forecast 2024-2029 ($ million)
- Chart on India - Year-over-year growth 2024-2029 (%)
- Data Table on India - Year-over-year growth 2024-2029 (%)
- 11.17 Brazil - Market size and forecast 2024-2029
- Chart on Brazil - Market size and forecast 2024-2029 ($ million)
- Data Table on Brazil - Market size and forecast 2024-2029 ($ million)
- Chart on Brazil - Year-over-year growth 2024-2029 (%)
- Data Table on Brazil - Year-over-year growth 2024-2029 (%)
- 11.18 Market opportunity By Geographical Landscape
- Market opportunity By Geographical Landscape ($ million)
- Data Tables on Market opportunity By Geographical Landscape ($ million)
12 Drivers, Challenges, and Opportunity/Restraints
- 12.1 Market drivers
- 12.2 Market challenges
- 12.3 Impact of drivers and challenges
- Impact of drivers and challenges in 2024 and 2029
- 12.4 Market opportunities/restraints
13 Competitive Landscape
- 13.1 Overview
- 13.2 Competitive Landscape
- Overview on criticality of inputs and factors of differentiation
- 13.3 Landscape disruption
- Overview on factors of disruption
- 13.4 Industry risks
- Impact of key risks on business
14 Competitive Analysis
- 14.1 Companies profiled
- Companies covered
- 14.2 Company ranking index
- Company ranking index
- 14.3 Market positioning of companies
- Matrix on companies position and classification
- 14.4 Altair Engineering Inc.
- Altair Engineering Inc. - Overview
- Altair Engineering Inc. - Business segments
- Altair Engineering Inc. - Key news
- Altair Engineering Inc. - Key offerings
- Altair Engineering Inc. - Segment focus
- SWOT
- 14.5 Autodesk Inc.
- Autodesk Inc. - Overview
- Autodesk Inc. - Product / Service
- Autodesk Inc. - Key news
- Autodesk Inc. - Key offerings
- SWOT
- 14.6 Chaos Software Ltd.
- Chaos Software Ltd. - Overview
- Chaos Software Ltd. - Product / Service
- Chaos Software Ltd. - Key offerings
- SWOT
- 14.7 Daz Productions Inc.
- Daz Productions Inc. - Overview
- Daz Productions Inc. - Product / Service
- Daz Productions Inc. - Key offerings
- SWOT
- 14.8 Floorplanner.com BV
- Floorplanner.com BV - Overview
- Floorplanner.com BV - Product / Service
- Floorplanner.com BV - Key offerings
- SWOT
- 14.9 Lumion
- Lumion - Overview
- Lumion - Product / Service
- Lumion - Key offerings
- SWOT
- 14.10 Luxion Inc.
- Luxion Inc. - Overview
- Luxion Inc. - Product / Service
- Luxion Inc. - Key offerings
- SWOT
- 14.11 Nemetschek SE
- Nemetschek SE - Overview
- Nemetschek SE - Business segments
- Nemetschek SE - Key news
- Nemetschek SE - Key offerings
- Nemetschek SE - Segment focus
- SWOT
- 14.12 NEXT LIMIT SL
- NEXT LIMIT SL - Overview
- NEXT LIMIT SL - Product / Service
- NEXT LIMIT SL - Key offerings
- SWOT
- 14.13 NVIDIA Corp.
- NVIDIA Corp. - Overview
- NVIDIA Corp. - Business segments
- NVIDIA Corp. - Key news
- NVIDIA Corp. - Key offerings
- NVIDIA Corp. - Segment focus
- SWOT
- 14.14 OTOY Inc.
- OTOY Inc. - Overview
- OTOY Inc. - Product / Service
- OTOY Inc. - Key offerings
- SWOT
- 14.15 Robert McNeel and Associates
- Robert McNeel and Associates - Overview
- Robert McNeel and Associates - Product / Service
- Robert McNeel and Associates - Key offerings
- SWOT
- 14.16 Roper Technologies Inc.
- Roper Technologies Inc. - Overview
- Roper Technologies Inc. - Business segments
- Roper Technologies Inc. - Key news
- Roper Technologies Inc. - Key offerings
- Roper Technologies Inc. - Segment focus
- SWOT
- 14.17 Shapespark sp. Zoo
- Shapespark sp. Zoo - Overview
- Shapespark sp. Zoo - Product / Service
- Shapespark sp. Zoo - Key offerings
- SWOT
- 14.18 Vrender Co.
- Vrender Co. - Overview
- Vrender Co. - Product / Service
- Vrender Co. - Key offerings
- SWOT
15 Appendix
- 15.1 Scope of the report
- 15.2 Inclusions and exclusions checklist
- Inclusions checklist
- Exclusions checklist
- 15.3 Currency conversion rates for US$
- Currency conversion rates for US$
- 15.4 Research methodology
- Research methodology
- 15.5 Data procurement
- Information sources
- 15.6 Data validation
- Data validation
- 15.7 Validation techniques employed for market sizing
- Validation techniques employed for market sizing
- 15.8 Data synthesis
- Data synthesis
- 15.9 360 degree market analysis
- 360 degree market analysis
- 15.10 List of abbreviations
- List of abbreviations

