|
|
市場調査レポート
商品コード
1450101
量子ドットの世界市場 2024-2028Global Quantum Dots Market 2024-2028 |
||||||
|
|||||||
カスタマイズ可能
|
|||||||

| 量子ドットの世界市場 2024-2028 |
|
出版日: 2024年02月28日
発行: TechNavio
ページ情報: 英文 160 Pages
納期: 即納可能
|

全表示
- 概要
- 図表
- 目次
量子ドット市場は2023-2028年に70億9,000万米ドル、予測期間中のCAGRは17.01%で成長すると予測されます。
当レポートでは、量子ドット市場の全体的な分析、市場規模・予測、動向、成長促進要因、課題、約25のベンダーを網羅したベンダー分析などを掲載しています。
現在の市場シナリオ、最新動向と促進要因、市場環境全体に関する最新分析を提供しています。市場は、より優れた性能と高解像度を備えた最適化されたデバイスに対する需要の増加、カドミウムフリーの量子ドットに対する消費者の関心の高まり、エネルギー効率の高いデバイスに対するニーズの高まりによって牽引されています。
| 市場範囲 | |
|---|---|
| 基準年 | 2024 |
| 終了年 | 2028 |
| 予測期間 | 2024-2028 |
| 成長モメンタム | 加速 |
| 前年比2024年 | 16.34% |
| CAGR | 17.01% |
| 増分額 | 70億9,000万米ドル |
本調査では、今後数年間の量子ドット市場成長を牽引する主な要因の1つとして、より明るく、鮮やかで、高解像度のディスプレイに対するニーズの高まりを挙げています。また、オプトエレクトロニクスの採用が増加し、製品イノベーション、戦略的提携、研究開発への投資が増加していることも、同市場の大きな需要につながっています。
目次
第1章 エグゼクティブサマリー
- 市場概要
第2章 市場情勢
- 市場エコシステム
第3章 市場規模
- 市場の定義
- 市場セグメント分析
- 市場規模 2023
- 市場の見通し 2023-2028
第4章 市場規模実績
- 量子ドットの世界市場 2018-2022
- 材料セグメント分析 2018-2022
- 製品セグメント分析 2018-2022
- 地域別セグメント分析 2018-2022
- 国別セグメント分析 2018-2022
第5章 ファイブフォース分析
- ファイブフォースの要約
- 買い手の交渉力
- 供給企業の交渉力
- 新規参入業者の脅威
- 代替品の脅威
- 競争の脅威
- 市況
第6章 市場セグメンテーション:素材別
- 市場セグメント
- 比較:素材別
- カドミウム系:市場規模と予測 2023-2028
- カドミウムフリー:市場規模と予測 2023-2028
- 市場機会:素材別
第7章 市場セグメンテーション:製品別
- 市場セグメント
- 比較:製品別
- ディスプレイ:市場規模と予測 2023-2028
- その他:市場規模と予測 2023-2028
- 市場機会:製品別
第8章 顧客情勢
- 顧客情勢の概要
第9章 地域別情勢
- 地域別セグメンテーション
- 地域別比較
- 北米:市場規模と予測 2023-2028
- 欧州:市場規模と予測 2023-2028
- アジア太平洋:市場規模と予測 2023-2028
- 中東・アフリカ:市場規模と予測 2023-2028
- 南米:市場規模と予測 2023-2028
- 米国:市場規模と予測 2023-2028
- 中国:市場規模と予測 2023-2028
- ドイツ:市場規模と予測 2023-2028
- カナダ:市場規模と予測 2023-2028
- 英国:市場規模と予測 2023-2028
- 市場機会:地域情勢別
第10章 促進要因、課題、および動向
- 市場促進要因
- 市場の課題
- 促進要因と課題の影響
- 市場動向
第11章 ベンダー情勢
- 概要
- ベンダー情勢
- 混乱の状況
- 業界のリスク
第12章 ベンダー分析
- 対象ベンダー
- ベンダーの市場ポジショニング
- ams OSRAM AG
- Indium Corp.
- LG Electronics Inc.
- MaTecK GmbH
- Merck KGaA
- Nanosys Inc.
- Nippon Chemical Industrial Co. Ltd.
- NNCrystal US Corp.
- Ocean NanoTech LLC
- QD Laser Inc.
- Quantum Solutions UK
- Samsung Electronics Co. Ltd.
- Strem Chemicals Inc.
- UbiQD Inc.
- XTPL S.A.
第13章 付録
Exhibits:
- Exhibits1: Executive Summary - Chart on Market Overview
- Exhibits2: Executive Summary - Data Table on Market Overview
- Exhibits3: Executive Summary - Chart on Global Market Characteristics
- Exhibits4: Executive Summary - Chart on Market By Geographical Landscape
- Exhibits5: Executive Summary - Chart on Market Segmentation by Material
- Exhibits6: Executive Summary - Chart on Market Segmentation by Product
- Exhibits7: Executive Summary - Chart on Incremental Growth
- Exhibits8: Executive Summary - Data Table on Incremental Growth
- Exhibits9: Executive Summary - Chart on Vendor Market Positioning
- Exhibits10: Parent market
- Exhibits11: Market Characteristics
- Exhibits12: Offerings of vendors included in the market definition
- Exhibits13: Market segments
- Exhibits14: Chart on Global - Market size and forecast 2023-2028 ($ billion)
- Exhibits15: Data Table on Global - Market size and forecast 2023-2028 ($ billion)
- Exhibits16: Chart on Global Market: Year-over-year growth 2023-2028 (%)
- Exhibits17: Data Table on Global Market: Year-over-year growth 2023-2028 (%)
- Exhibits18: Historic Market Size - Data Table on global quantum dots market 2018 - 2022 ($ billion)
- Exhibits19: Historic Market Size - Material Segment 2018 - 2022 ($ billion)
- Exhibits20: Historic Market Size - Product Segment 2018 - 2022 ($ billion)
- Exhibits21: Historic Market Size - Geography Segment 2018 - 2022 ($ billion)
- Exhibits22: Historic Market Size - Country Segment 2018 - 2022 ($ billion)
- Exhibits23: Five forces analysis - Comparison between 2023 and 2028
- Exhibits24: Chart on Bargaining power of buyers - Impact of key factors 2023 and 2028
- Exhibits25: Bargaining power of suppliers - Impact of key factors in 2023 and 2028
- Exhibits26: Threat of new entrants - Impact of key factors in 2023 and 2028
- Exhibits27: Threat of substitutes - Impact of key factors in 2023 and 2028
- Exhibits28: Threat of rivalry - Impact of key factors in 2023 and 2028
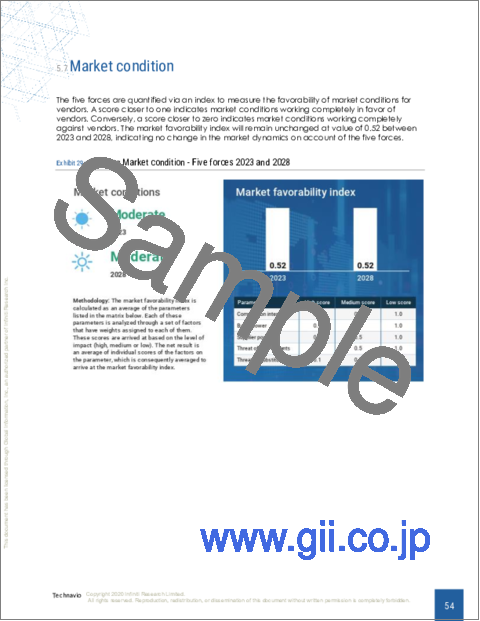
- Exhibits29: Chart on Market condition - Five forces 2023 and 2028
- Exhibits30: Chart on Material - Market share 2023-2028 (%)
- Exhibits31: Data Table on Material - Market share 2023-2028 (%)
- Exhibits32: Chart on Comparison by Material
- Exhibits33: Data Table on Comparison by Material
- Exhibits34: Chart on Cadmium-based - Market size and forecast 2023-2028 ($ billion)
- Exhibits35: Data Table on Cadmium-based - Market size and forecast 2023-2028 ($ billion)
- Exhibits36: Chart on Cadmium-based - Year-over-year growth 2023-2028 (%)
- Exhibits37: Data Table on Cadmium-based - Year-over-year growth 2023-2028 (%)
- Exhibits38: Chart on Cadmium-free - Market size and forecast 2023-2028 ($ billion)
- Exhibits39: Data Table on Cadmium-free - Market size and forecast 2023-2028 ($ billion)
- Exhibits40: Chart on Cadmium-free - Year-over-year growth 2023-2028 (%)
- Exhibits41: Data Table on Cadmium-free - Year-over-year growth 2023-2028 (%)
- Exhibits42: Market opportunity by Material ($ billion)
- Exhibits43: Data Table on Market opportunity by Material ($ billion)
- Exhibits44: Chart on Product - Market share 2023-2028 (%)
- Exhibits45: Data Table on Product - Market share 2023-2028 (%)
- Exhibits46: Chart on Comparison by Product
- Exhibits47: Data Table on Comparison by Product
- Exhibits48: Chart on Displays - Market size and forecast 2023-2028 ($ billion)
- Exhibits49: Data Table on Displays - Market size and forecast 2023-2028 ($ billion)
- Exhibits50: Chart on Displays - Year-over-year growth 2023-2028 (%)
- Exhibits51: Data Table on Displays - Year-over-year growth 2023-2028 (%)
- Exhibits52: Chart on Others - Market size and forecast 2023-2028 ($ billion)
- Exhibits53: Data Table on Others - Market size and forecast 2023-2028 ($ billion)
- Exhibits54: Chart on Others - Year-over-year growth 2023-2028 (%)
- Exhibits55: Data Table on Others - Year-over-year growth 2023-2028 (%)
- Exhibits56: Market opportunity by Product ($ billion)
- Exhibits57: Data Table on Market opportunity by Product ($ billion)
- Exhibits58: Analysis of price sensitivity, lifecycle, customer purchase basket, adoption rates, and purchase criteria
- Exhibits59: Chart on Market share By Geographical Landscape 2023-2028 (%)
- Exhibits60: Data Table on Market share By Geographical Landscape 2023-2028 (%)
- Exhibits61: Chart on Geographic comparison
- Exhibits62: Data Table on Geographic comparison
- Exhibits63: Chart on North America - Market size and forecast 2023-2028 ($ billion)
- Exhibits64: Data Table on North America - Market size and forecast 2023-2028 ($ billion)
- Exhibits65: Chart on North America - Year-over-year growth 2023-2028 (%)
- Exhibits66: Data Table on North America - Year-over-year growth 2023-2028 (%)
- Exhibits67: Chart on Europe - Market size and forecast 2023-2028 ($ billion)
- Exhibits68: Data Table on Europe - Market size and forecast 2023-2028 ($ billion)
- Exhibits69: Chart on Europe - Year-over-year growth 2023-2028 (%)
- Exhibits70: Data Table on Europe - Year-over-year growth 2023-2028 (%)
- Exhibits71: Chart on APAC - Market size and forecast 2023-2028 ($ billion)
- Exhibits72: Data Table on APAC - Market size and forecast 2023-2028 ($ billion)
- Exhibits73: Chart on APAC - Year-over-year growth 2023-2028 (%)
- Exhibits74: Data Table on APAC - Year-over-year growth 2023-2028 (%)
- Exhibits75: Chart on Middle East and Africa - Market size and forecast 2023-2028 ($ billion)
- Exhibits76: Data Table on Middle East and Africa - Market size and forecast 2023-2028 ($ billion)
- Exhibits77: Chart on Middle East and Africa - Year-over-year growth 2023-2028 (%)
- Exhibits78: Data Table on Middle East and Africa - Year-over-year growth 2023-2028 (%)
- Exhibits79: Chart on South America - Market size and forecast 2023-2028 ($ billion)
- Exhibits80: Data Table on South America - Market size and forecast 2023-2028 ($ billion)
- Exhibits81: Chart on South America - Year-over-year growth 2023-2028 (%)
- Exhibits82: Data Table on South America - Year-over-year growth 2023-2028 (%)
- Exhibits83: Chart on US - Market size and forecast 2023-2028 ($ billion)
- Exhibits84: Data Table on US - Market size and forecast 2023-2028 ($ billion)
- Exhibits85: Chart on US - Year-over-year growth 2023-2028 (%)
- Exhibits86: Data Table on US - Year-over-year growth 2023-2028 (%)
- Exhibits87: Chart on China - Market size and forecast 2023-2028 ($ billion)
- Exhibits88: Data Table on China - Market size and forecast 2023-2028 ($ billion)
- Exhibits89: Chart on China - Year-over-year growth 2023-2028 (%)
- Exhibits90: Data Table on China - Year-over-year growth 2023-2028 (%)
- Exhibits91: Chart on Germany - Market size and forecast 2023-2028 ($ billion)
- Exhibits92: Data Table on Germany - Market size and forecast 2023-2028 ($ billion)
- Exhibits93: Chart on Germany - Year-over-year growth 2023-2028 (%)
- Exhibits94: Data Table on Germany - Year-over-year growth 2023-2028 (%)
- Exhibits95: Chart on Canada - Market size and forecast 2023-2028 ($ billion)
- Exhibits96: Data Table on Canada - Market size and forecast 2023-2028 ($ billion)
- Exhibits97: Chart on Canada - Year-over-year growth 2023-2028 (%)
- Exhibits98: Data Table on Canada - Year-over-year growth 2023-2028 (%)
- Exhibits99: Chart on UK - Market size and forecast 2023-2028 ($ billion)
- Exhibits100: Data Table on UK - Market size and forecast 2023-2028 ($ billion)
- Exhibits101: Chart on UK - Year-over-year growth 2023-2028 (%)
- Exhibits102: Data Table on UK - Year-over-year growth 2023-2028 (%)
- Exhibits103: Market opportunity By Geographical Landscape ($ billion)
- Exhibits104: Data Tables on Market opportunity By Geographical Landscape ($ billion)
- Exhibits105: Impact of drivers and challenges in 2023 and 2028
- Exhibits106: Overview on Criticality of inputs and Factors of differentiation
- Exhibits107: Overview on factors of disruption
- Exhibits108: Impact of key risks on business
- Exhibits109: Vendors covered
- Exhibits110: Matrix on vendor position and classification
- Exhibits111: ams OSRAM AG - Overview
- Exhibits112: ams OSRAM AG - Business segments
- Exhibits113: ams OSRAM AG - Key offerings
- Exhibits114: ams OSRAM AG - Segment focus
- Exhibits115: Indium Corp. - Overview
- Exhibits116: Indium Corp. - Product / Service
- Exhibits117: Indium Corp. - Key offerings
- Exhibits118: LG Electronics Inc. - Overview
- Exhibits119: LG Electronics Inc. - Product / Service
- Exhibits120: LG Electronics Inc. - Key offerings
- Exhibits121: MaTecK GmbH - Overview
- Exhibits122: MaTecK GmbH - Product / Service
- Exhibits123: MaTecK GmbH - Key offerings
- Exhibits124: Merck KGaA - Overview
- Exhibits125: Merck KGaA - Business segments
- Exhibits126: Merck KGaA - Key news
- Exhibits127: Merck KGaA - Key offerings
- Exhibits128: Merck KGaA - Segment focus
- Exhibits129: Nanosys Inc. - Overview
- Exhibits130: Nanosys Inc. - Product / Service
- Exhibits131: Nanosys Inc. - Key offerings
- Exhibits132: Nippon Chemical Industrial Co. Ltd. - Overview
- Exhibits133: Nippon Chemical Industrial Co. Ltd. - Product / Service
- Exhibits134: Nippon Chemical Industrial Co. Ltd. - Key offerings
- Exhibits135: NNCrystal US Corp. - Overview
- Exhibits136: NNCrystal US Corp. - Product / Service
- Exhibits137: NNCrystal US Corp. - Key offerings
- Exhibits138: Ocean NanoTech LLC - Overview
- Exhibits139: Ocean NanoTech LLC - Product / Service
- Exhibits140: Ocean NanoTech LLC - Key offerings
- Exhibits141: QD Laser Inc. - Overview
- Exhibits142: QD Laser Inc. - Product / Service
- Exhibits143: QD Laser Inc. - Key offerings
- Exhibits144: Quantum Solutions UK - Overview
- Exhibits145: Quantum Solutions UK - Product / Service
- Exhibits146: Quantum Solutions UK - Key offerings
- Exhibits147: Samsung Electronics Co. Ltd. - Overview
- Exhibits148: Samsung Electronics Co. Ltd. - Business segments
- Exhibits149: Samsung Electronics Co. Ltd. - Key news
- Exhibits150: Samsung Electronics Co. Ltd. - Key offerings
- Exhibits151: Samsung Electronics Co. Ltd. - Segment focus
- Exhibits152: Strem Chemicals Inc. - Overview
- Exhibits153: Strem Chemicals Inc. - Product / Service
- Exhibits154: Strem Chemicals Inc. - Key offerings
- Exhibits155: UbiQD Inc. - Overview
- Exhibits156: UbiQD Inc. - Product / Service
- Exhibits157: UbiQD Inc. - Key offerings
- Exhibits158: XTPL S.A. - Overview
- Exhibits159: XTPL S.A. - Product / Service
- Exhibits160: XTPL S.A. - Key offerings
- Exhibits161: Inclusions checklist
- Exhibits162: Exclusions checklist
- Exhibits163: Currency conversion rates for US$
- Exhibits164: Research methodology
- Exhibits165: Validation techniques employed for market sizing
- Exhibits166: Information sources
- Exhibits167: List of abbreviations
The quantum dots market is forecasted to grow by USD 7.09 bn during 2023-2028, accelerating at a CAGR of 17.01% during the forecast period. The report on the quantum dots market provides a holistic analysis, market size and forecast, trends, growth drivers, and challenges, as well as vendor analysis covering around 25 vendors.
The report offers an up-to-date analysis regarding the current market scenario, the latest trends and drivers, and the overall market environment. The market is driven by increasing demand for optimized devices with better performance and high resolution, growing interest of consumers in cadmium-free quantum dots, and rising need for energy-efficient devices.
Technavio's quantum dots market is segmented as below:
| Market Scope | |
|---|---|
| Base Year | 2024 |
| End Year | 2028 |
| Series Year | 2024-2028 |
| Growth Momentum | Accelerate |
| YOY 2024 | 16.34% |
| CAGR | 17.01% |
| Incremental Value | $7.09bn |
By Material
- Cadmium-based
- Cadmium-free
By Product
- Displays
- Others
By Geographical Landscape
- North America
- Europe
- APAC
- Middle East and Africa
- South America
This study identifies the growing need for more bright, vibrant, and high-resolution displays as one of the prime reasons driving the quantum dots market growth during the next few years. Also, increasing adoption of optoelectronics and increasing investments in product innovation, strategic alliance, and research and development will lead to sizable demand in the market.
The report on the quantum dots market covers the following areas:
- Quantum dots market sizing
- Quantum dots market forecast
- Quantum dots market industry analysis
The robust vendor analysis is designed to help clients improve their market position, and in line with this, this report provides a detailed analysis of several leading quantum dots market vendors that include American Elements, ams OSRAM AG, Indium Corp., LG Electronics Inc., MaTecK GmbH, Merck KGaA, Nanorh, Nanosys Inc., Nippon Chemical Industrial Co. Ltd., NNCrystal US Corp., Ocean NanoTech LLC, QD Laser Inc., Quantum Solutions UK, RANVOUS Inc., Samsung Electronics Co. Ltd., UbiQD Inc., Core Quantum Technologies, Crystalplex Corp., Strem Chemicals Inc., and XTPL S.A.. Also, the quantum dots market analysis report includes information on upcoming trends and challenges that will influence market growth. This is to help companies strategize and leverage all forthcoming growth opportunities.
The study was conducted using an objective combination of primary and secondary information including inputs from key participants in the industry. The report contains a comprehensive market and vendor landscape in addition to an analysis of the key vendors.
The publisher presents a detailed picture of the market by the way of study, synthesis, and summation of data from multiple sources by an analysis of key parameters such as profit, pricing, competition, and promotions. It presents various market facets by identifying the key industry influencers. The data presented is comprehensive, reliable, and a result of extensive research - both primary and secondary. The market research reports provide a complete competitive landscape and an in-depth vendor selection methodology and analysis using qualitative and quantitative research to forecast the accurate market growth.
Table of Contents
1 Executive Summary
- 1.1 Market overview
2 Market Landscape
- 2.1 Market ecosystem
3 Market Sizing
- 3.1 Market definition
- 3.2 Market segment analysis
- 3.3 Market size 2023
- 3.4 Market outlook: Forecast for 2023-2028
4 Historic Market Size
- 4.1 Global quantum dots market 2018 - 2022
- 4.2 Material Segment Analysis 2018 - 2022
- 4.3 Product Segment Analysis 2018 - 2022
- 4.4 Geography Segment Analysis 2018 - 2022
- 4.5 Country Segment Analysis 2018 - 2022
5 Five Forces Analysis
- 5.1 Five forces summary
- 5.2 Bargaining power of buyers
- 5.3 Bargaining power of suppliers
- 5.4 Threat of new entrants
- 5.5 Threat of substitutes
- 5.6 Threat of rivalry
- 5.7 Market condition
6 Market Segmentation by Material
- 6.1 Market segments
- 6.2 Comparison by Material
- 6.3 Cadmium-based - Market size and forecast 2023-2028
- 6.4 Cadmium-free - Market size and forecast 2023-2028
- 6.5 Market opportunity by Material
7 Market Segmentation by Product
- 7.1 Market segments
- 7.2 Comparison by Product
- 7.3 Displays - Market size and forecast 2023-2028
- 7.4 Others - Market size and forecast 2023-2028
- 7.5 Market opportunity by Product
8 Customer Landscape
- 8.1 Customer landscape overview
9 Geographic Landscape
- 9.1 Geographic segmentation
- 9.2 Geographic comparison
- 9.3 North America - Market size and forecast 2023-2028
- 9.4 Europe - Market size and forecast 2023-2028
- 9.5 APAC - Market size and forecast 2023-2028
- 9.6 Middle East and Africa - Market size and forecast 2023-2028
- 9.7 South America - Market size and forecast 2023-2028
- 9.8 US - Market size and forecast 2023-2028
- 9.9 China - Market size and forecast 2023-2028
- 9.10 Germany - Market size and forecast 2023-2028
- 9.11 Canada - Market size and forecast 2023-2028
- 9.12 UK - Market size and forecast 2023-2028
- 9.13 Market opportunity By Geographical Landscape
10 Drivers, Challenges, and Trends
- 10.1 Market drivers
- 10.2 Market challenges
- 10.3 Impact of drivers and challenges
- 10.4 Market trends
11 Vendor Landscape
- 11.1 Overview
- 11.2 Vendor landscape
- 11.3 Landscape disruption
- 11.4 Industry risks
12 Vendor Analysis
- 12.1 Vendors covered
- 12.2 Market positioning of vendors
- 12.3 ams OSRAM AG
- 12.4 Indium Corp.
- 12.5 LG Electronics Inc.
- 12.6 MaTecK GmbH
- 12.7 Merck KGaA
- 12.8 Nanosys Inc.
- 12.9 Nippon Chemical Industrial Co. Ltd.
- 12.10 NNCrystal US Corp.
- 12.11 Ocean NanoTech LLC
- 12.12 QD Laser Inc.
- 12.13 Quantum Solutions UK
- 12.14 Samsung Electronics Co. Ltd.
- 12.15 Strem Chemicals Inc.
- 12.16 UbiQD Inc.
- 12.17 XTPL S.A.
13 Appendix
- 13.1 Scope of the report
- 13.2 Inclusions and exclusions checklist
- 13.3 Currency conversion rates for US$
- 13.4 Research methodology
- 13.5 List of abbreviations

