|
|
市場調査レポート
商品コード
1446187
オートメーションテストの世界市場 2024-2028Global Automation Testing Market 2024-2028 |
||||||

|
|||||||
カスタマイズ可能
|
|||||||


| オートメーションテストの世界市場 2024-2028 |
|
出版日: 2024年02月15日
発行: TechNavio
ページ情報: 英文 154 Pages
納期: 即納可能
|

全表示
- 概要
- 図表
- 目次
オートメーションテスト市場は2023-2028年に302億1,000万米ドル、予測期間中のCAGRは15.91%で成長すると予測されます。
当レポートでは、オートメーションテスト市場の全体的な分析、市場規模・予測、動向、成長促進要因、課題、約25のベンダーを網羅したベンダー分析などを掲載しています。
現在の市場シナリオ、最新動向と促進要因、市場環境全体に関する最新分析を提供しています。継続的デリバリーと継続的インテグレーション(CD/CI)に対する需要の高まり、オートメーションテストの研究開発への高額投資、品質とユーザーエクスペリエンスへの注目の高まりが市場を牽引しています。
| 市場範囲 | |
|---|---|
| 基準年 | 2024 |
| 終了年 | 2028 |
| 予測期間 | 2024-2028 |
| 成長モメンタム | 加速 |
| 前年比2024年 | 15.78% |
| CAGR | 15.91% |
| 増分額 | 302億1,000万米ドル |
本調査では、急速なデジタル変革が今後数年間のオートメーションテスト市場の成長を促進する主要因の1つであると特定しています。また、ソフトウェアテスト技術の革新や企業間の合併・買収の増加も、市場の大きな需要につながると思われます。
目次
第1章 エグゼクティブサマリー
- 市場概要
第2章 市場情勢
- 市場エコシステム
第3章 市場規模
- 市場の定義
- 市場セグメント分析
- 市場規模 2023
- 市場の見通し 2023-2028
第4章 市場規模実績
- オートメーションテストの世界市場 2018-2022
- エンドユーザーセグメント分析 2018-2022
- 展開セグメント分析 2018-2022
- 地域別セグメント分析 2018-2022
- 国別セグメント分析 2018-2022
第5章 ファイブフォース分析
- ファイブフォースの要約
- 買い手の交渉力
- 供給企業の交渉力
- 新規参入業者の脅威
- 代替品の脅威
- 競争の脅威
- 市況
第6章 市場セグメンテーション:エンドユーザー別
- 市場セグメント
- 比較:エンドユーザー別
- BFSI:市場規模と予測 2023-2028
- 通信とメディア:市場規模と予測 2023-2028
- 製造業:市場規模と予測 2023-2028
- その他:市場規模と予測 2023-2028
- 市場機会:エンドユーザー別
第7章 市場セグメンテーション:展開別
- 市場セグメント
- 比較:展開別
- オンプレミス:市場規模と予測 2023-2028
- クラウドベース:市場規模と予測 2023-2028
- 市場機会:展開別
第8章 顧客情勢
- 顧客情勢の概要
第9章 地域別情勢
- 地域別セグメンテーション
- 地域別比較
- 北米:市場規模と予測 2023-2028
- 欧州:市場規模と予測 2023-2028
- アジア太平洋:市場規模と予測 2023-2028
- 南米:市場規模と予測 2023-2028
- 中東・アフリカ:市場規模と予測 2023-2028
- 米国:市場規模と予測 2023-2028
- 中国:市場規模と予測 2023-2028
- 英国:市場規模と予測 2023-2028
- ドイツ:市場規模と予測 2023-2028
- 日本:市場規模と予測 2023-2028
- 市場機会:地域情勢別
第10章 促進要因、課題、および動向
- 市場促進要因
- 市場の課題
- 促進要因と課題の影響
- 市場動向
第11章 ベンダー情勢
- 概要
- ベンダー情勢
- 混乱の状況
- 業界のリスク
第12章 ベンダー分析
- 対象ベンダー
- ベンダーの市場ポジショニング
- Accenture Plc
- Afour technologies
- Apexon
- Applitools Group
- Astegic Inc.
- Broadcom Inc.
- Capgemini Service SAS
- Cigniti Technologies Ltd.
- Codoid
- International Business Machines Corp.
- Keysight Technologies Inc.
- Microsoft Corp.
- Parasoft Corp.
- Sauce Labs Inc.
- Tricentis GmbH
第13章 付録
Exhibits:
- Exhibits1: Executive Summary - Chart on Market Overview
- Exhibits2: Executive Summary - Data Table on Market Overview
- Exhibits3: Executive Summary - Chart on Global Market Characteristics
- Exhibits4: Executive Summary - Chart on Market By Geographical Landscape
- Exhibits5: Executive Summary - Chart on Market Segmentation by End-user
- Exhibits6: Executive Summary - Chart on Market Segmentation by Deployment
- Exhibits7: Executive Summary - Chart on Incremental Growth
- Exhibits8: Executive Summary - Data Table on Incremental Growth
- Exhibits9: Executive Summary - Chart on Vendor Market Positioning
- Exhibits10: Parent market
- Exhibits11: Market Characteristics
- Exhibits12: Offerings of vendors included in the market definition
- Exhibits13: Market segments
- Exhibits14: Chart on Global - Market size and forecast 2023-2028 ($ billion)
- Exhibits15: Data Table on Global - Market size and forecast 2023-2028 ($ billion)
- Exhibits16: Chart on Global Market: Year-over-year growth 2023-2028 (%)
- Exhibits17: Data Table on Global Market: Year-over-year growth 2023-2028 (%)
- Exhibits18: Historic Market Size - Data Table on global automation testing market 2018 - 2022 ($ billion)
- Exhibits19: Historic Market Size - End-user Segment 2018 - 2022 ($ billion)
- Exhibits20: Historic Market Size - Deployment Segment 2018 - 2022 ($ billion)
- Exhibits21: Historic Market Size - Geography Segment 2018 - 2022 ($ billion)
- Exhibits22: Historic Market Size - Country Segment 2018 - 2022 ($ billion)
- Exhibits23: Five forces analysis - Comparison between 2023 and 2028
- Exhibits24: Chart on Bargaining power of buyers - Impact of key factors 2023 and 2028
- Exhibits25: Bargaining power of suppliers - Impact of key factors in 2023 and 2028
- Exhibits26: Threat of new entrants - Impact of key factors in 2023 and 2028
- Exhibits27: Threat of substitutes - Impact of key factors in 2023 and 2028
- Exhibits28: Threat of rivalry - Impact of key factors in 2023 and 2028
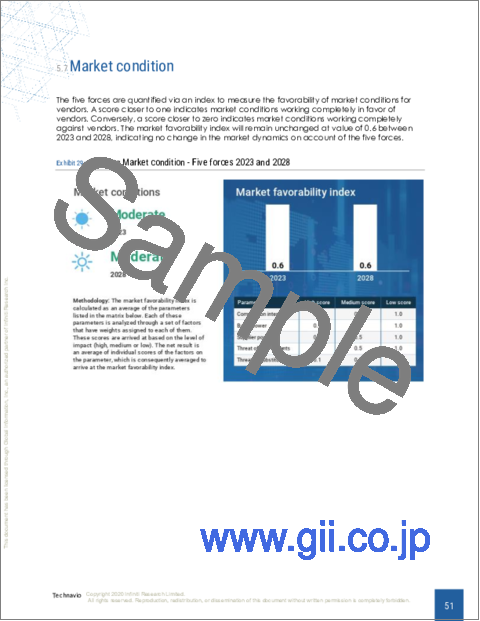
- Exhibits29: Chart on Market condition - Five forces 2023 and 2028
- Exhibits30: Chart on End-user - Market share 2023-2028 (%)
- Exhibits31: Data Table on End-user - Market share 2023-2028 (%)
- Exhibits32: Chart on Comparison by End-user
- Exhibits33: Data Table on Comparison by End-user
- Exhibits34: Chart on BFSI - Market size and forecast 2023-2028 ($ billion)
- Exhibits35: Data Table on BFSI - Market size and forecast 2023-2028 ($ billion)
- Exhibits36: Chart on BFSI - Year-over-year growth 2023-2028 (%)
- Exhibits37: Data Table on BFSI - Year-over-year growth 2023-2028 (%)
- Exhibits38: Chart on Telecom and media - Market size and forecast 2023-2028 ($ billion)
- Exhibits39: Data Table on Telecom and media - Market size and forecast 2023-2028 ($ billion)
- Exhibits40: Chart on Telecom and media - Year-over-year growth 2023-2028 (%)
- Exhibits41: Data Table on Telecom and media - Year-over-year growth 2023-2028 (%)
- Exhibits42: Chart on Manufacturing - Market size and forecast 2023-2028 ($ billion)
- Exhibits43: Data Table on Manufacturing - Market size and forecast 2023-2028 ($ billion)
- Exhibits44: Chart on Manufacturing - Year-over-year growth 2023-2028 (%)
- Exhibits45: Data Table on Manufacturing - Year-over-year growth 2023-2028 (%)
- Exhibits46: Chart on Others - Market size and forecast 2023-2028 ($ billion)
- Exhibits47: Data Table on Others - Market size and forecast 2023-2028 ($ billion)
- Exhibits48: Chart on Others - Year-over-year growth 2023-2028 (%)
- Exhibits49: Data Table on Others - Year-over-year growth 2023-2028 (%)
- Exhibits50: Market opportunity by End-user ($ billion)
- Exhibits51: Data Table on Market opportunity by End-user ($ billion)
- Exhibits52: Chart on Deployment - Market share 2023-2028 (%)
- Exhibits53: Data Table on Deployment - Market share 2023-2028 (%)
- Exhibits54: Chart on Comparison by Deployment
- Exhibits55: Data Table on Comparison by Deployment
- Exhibits56: Chart on On-premises - Market size and forecast 2023-2028 ($ billion)
- Exhibits57: Data Table on On-premises - Market size and forecast 2023-2028 ($ billion)
- Exhibits58: Chart on On-premises - Year-over-year growth 2023-2028 (%)
- Exhibits59: Data Table on On-premises - Year-over-year growth 2023-2028 (%)
- Exhibits60: Chart on Cloud-based - Market size and forecast 2023-2028 ($ billion)
- Exhibits61: Data Table on Cloud-based - Market size and forecast 2023-2028 ($ billion)
- Exhibits62: Chart on Cloud-based - Year-over-year growth 2023-2028 (%)
- Exhibits63: Data Table on Cloud-based - Year-over-year growth 2023-2028 (%)
- Exhibits64: Market opportunity by Deployment ($ billion)
- Exhibits65: Data Table on Market opportunity by Deployment ($ billion)
- Exhibits66: Analysis of price sensitivity, lifecycle, customer purchase basket, adoption rates, and purchase criteria
- Exhibits67: Chart on Market share By Geographical Landscape 2023-2028 (%)
- Exhibits68: Data Table on Market share By Geographical Landscape 2023-2028 (%)
- Exhibits69: Chart on Geographic comparison
- Exhibits70: Data Table on Geographic comparison
- Exhibits71: Chart on North America - Market size and forecast 2023-2028 ($ billion)
- Exhibits72: Data Table on North America - Market size and forecast 2023-2028 ($ billion)
- Exhibits73: Chart on North America - Year-over-year growth 2023-2028 (%)
- Exhibits74: Data Table on North America - Year-over-year growth 2023-2028 (%)
- Exhibits75: Chart on Europe - Market size and forecast 2023-2028 ($ billion)
- Exhibits76: Data Table on Europe - Market size and forecast 2023-2028 ($ billion)
- Exhibits77: Chart on Europe - Year-over-year growth 2023-2028 (%)
- Exhibits78: Data Table on Europe - Year-over-year growth 2023-2028 (%)
- Exhibits79: Chart on APAC - Market size and forecast 2023-2028 ($ billion)
- Exhibits80: Data Table on APAC - Market size and forecast 2023-2028 ($ billion)
- Exhibits81: Chart on APAC - Year-over-year growth 2023-2028 (%)
- Exhibits82: Data Table on APAC - Year-over-year growth 2023-2028 (%)
- Exhibits83: Chart on South America - Market size and forecast 2023-2028 ($ billion)
- Exhibits84: Data Table on South America - Market size and forecast 2023-2028 ($ billion)
- Exhibits85: Chart on South America - Year-over-year growth 2023-2028 (%)
- Exhibits86: Data Table on South America - Year-over-year growth 2023-2028 (%)
- Exhibits87: Chart on Middle East and Africa - Market size and forecast 2023-2028 ($ billion)
- Exhibits88: Data Table on Middle East and Africa - Market size and forecast 2023-2028 ($ billion)
- Exhibits89: Chart on Middle East and Africa - Year-over-year growth 2023-2028 (%)
- Exhibits90: Data Table on Middle East and Africa - Year-over-year growth 2023-2028 (%)
- Exhibits91: Chart on US - Market size and forecast 2023-2028 ($ billion)
- Exhibits92: Data Table on US - Market size and forecast 2023-2028 ($ billion)
- Exhibits93: Chart on US - Year-over-year growth 2023-2028 (%)
- Exhibits94: Data Table on US - Year-over-year growth 2023-2028 (%)
- Exhibits95: Chart on China - Market size and forecast 2023-2028 ($ billion)
- Exhibits96: Data Table on China - Market size and forecast 2023-2028 ($ billion)
- Exhibits97: Chart on China - Year-over-year growth 2023-2028 (%)
- Exhibits98: Data Table on China - Year-over-year growth 2023-2028 (%)
- Exhibits99: Chart on UK - Market size and forecast 2023-2028 ($ billion)
- Exhibits100: Data Table on UK - Market size and forecast 2023-2028 ($ billion)
- Exhibits101: Chart on UK - Year-over-year growth 2023-2028 (%)
- Exhibits102: Data Table on UK - Year-over-year growth 2023-2028 (%)
- Exhibits103: Chart on Germany - Market size and forecast 2023-2028 ($ billion)
- Exhibits104: Data Table on Germany - Market size and forecast 2023-2028 ($ billion)
- Exhibits105: Chart on Germany - Year-over-year growth 2023-2028 (%)
- Exhibits106: Data Table on Germany - Year-over-year growth 2023-2028 (%)
- Exhibits107: Chart on Japan - Market size and forecast 2023-2028 ($ billion)
- Exhibits108: Data Table on Japan - Market size and forecast 2023-2028 ($ billion)
- Exhibits109: Chart on Japan - Year-over-year growth 2023-2028 (%)
- Exhibits110: Data Table on Japan - Year-over-year growth 2023-2028 (%)
- Exhibits111: Market opportunity By Geographical Landscape ($ billion)
- Exhibits112: Data Tables on Market opportunity By Geographical Landscape ($ billion)
- Exhibits113: Impact of drivers and challenges in 2023 and 2028
- Exhibits114: Overview on Criticality of inputs and Factors of differentiation
- Exhibits115: Overview on factors of disruption
- Exhibits116: Impact of key risks on business
- Exhibits117: Vendors covered
- Exhibits118: Matrix on vendor position and classification
- Exhibits119: Accenture Plc - Overview
- Exhibits120: Accenture Plc - Business segments
- Exhibits121: Accenture Plc - Key news
- Exhibits122: Accenture Plc - Key offerings
- Exhibits123: Accenture Plc - Segment focus
- Exhibits124: Afour technologies - Overview
- Exhibits125: Afour technologies - Product / Service
- Exhibits126: Afour technologies - Key offerings
- Exhibits127: Apexon - Overview
- Exhibits128: Apexon - Product / Service
- Exhibits129: Apexon - Key offerings
- Exhibits130: Applitools Group - Overview
- Exhibits131: Applitools Group - Product / Service
- Exhibits132: Applitools Group - Key offerings
- Exhibits133: Astegic Inc. - Overview
- Exhibits134: Astegic Inc. - Product / Service
- Exhibits135: Astegic Inc. - Key offerings
- Exhibits136: Broadcom Inc. - Overview
- Exhibits137: Broadcom Inc. - Business segments
- Exhibits138: Broadcom Inc. - Key news
- Exhibits139: Broadcom Inc. - Key offerings
- Exhibits140: Broadcom Inc. - Segment focus
- Exhibits141: Capgemini Service SAS - Overview
- Exhibits142: Capgemini Service SAS - Business segments
- Exhibits143: Capgemini Service SAS - Key news
- Exhibits144: Capgemini Service SAS - Key offerings
- Exhibits145: Capgemini Service SAS - Segment focus
- Exhibits146: Cigniti Technologies Ltd. - Overview
- Exhibits147: Cigniti Technologies Ltd. - Product / Service
- Exhibits148: Cigniti Technologies Ltd. - Key offerings
- Exhibits149: Codoid - Overview
- Exhibits150: Codoid - Product / Service
- Exhibits151: Codoid - Key offerings
- Exhibits152: International Business Machines Corp. - Overview
- Exhibits153: International Business Machines Corp. - Business segments
- Exhibits154: International Business Machines Corp. - Key news
- Exhibits155: International Business Machines Corp. - Key offerings
- Exhibits156: International Business Machines Corp. - Segment focus
- Exhibits157: Keysight Technologies Inc. - Overview
- Exhibits158: Keysight Technologies Inc. - Business segments
- Exhibits159: Keysight Technologies Inc. - Key news
- Exhibits160: Keysight Technologies Inc. - Key offerings
- Exhibits161: Keysight Technologies Inc. - Segment focus
- Exhibits162: Microsoft Corp. - Overview
- Exhibits163: Microsoft Corp. - Business segments
- Exhibits164: Microsoft Corp. - Key news
- Exhibits165: Microsoft Corp. - Key offerings
- Exhibits166: Microsoft Corp. - Segment focus
- Exhibits167: Parasoft Corp. - Overview
- Exhibits168: Parasoft Corp. - Product / Service
- Exhibits169: Parasoft Corp. - Key offerings
- Exhibits170: Sauce Labs Inc. - Overview
- Exhibits171: Sauce Labs Inc. - Product / Service
- Exhibits172: Sauce Labs Inc. - Key offerings
- Exhibits173: Tricentis GmbH - Overview
- Exhibits174: Tricentis GmbH - Product / Service
- Exhibits175: Tricentis GmbH - Key offerings
- Exhibits176: Inclusions checklist
- Exhibits177: Exclusions checklist
- Exhibits178: Currency conversion rates for US$
- Exhibits179: Research methodology
- Exhibits180: Validation techniques employed for market sizing
- Exhibits181: Information sources
- Exhibits182: List of abbreviations
The automation testing market is forecasted to grow by USD 30.21 bn during 2023-2028, accelerating at a CAGR of 15.91% during the forecast period. The report on the automation testing market provides a holistic analysis, market size and forecast, trends, growth drivers, and challenges, as well as vendor analysis covering around 25 vendors.
The report offers an up-to-date analysis regarding the current market scenario, the latest trends and drivers, and the overall market environment. The market is driven by increasing demand for continuous delivery and continuous integration (cd/ci), high investment in research and development of automation testing, and increasing focus on quality and user experience.
Technavio's automation testing market is segmented as below:
| Market Scope | |
|---|---|
| Base Year | 2024 |
| End Year | 2028 |
| Series Year | 2024-2028 |
| Growth Momentum | Accelerate |
| YOY 2024 | 15.78% |
| CAGR | 15.91% |
| Incremental Value | $30.21bn |
By End-user
- BFSI
- Telecom and media
- Manufacturing
- Others
By Deployment
- On-premises
- Cloud-based
By Geographical Landscape
- North America
- Europe
- APAC
- South America
- Middle East and Africa
This study identifies the rapid digital transformation as one of the prime reasons driving the automation testing market growth during the next few years. Also, innovation in software testing technologies and increasing mergers and acquisitions among players will lead to sizable demand in the market.
The report on the automation testing market covers the following areas:
- Automation testing market sizing
- Automation testing market forecast
- Automation testing market industry analysis
The robust vendor analysis is designed to help clients improve their market position, and in line with this, this report provides a detailed analysis of several leading automation testing market vendors that include Accenture Plc, Afour technologies, Apexon, Applitools Group, Astegic Inc., Broadcom Inc., Capgemini Service SAS, Cigniti Technologies Ltd., Codoid, Cygnet Infotech, International Business Machines Corp., Invensis Technologies Pvt Ltd., Keysight Technologies Inc., Microsoft Corp., Mobisoft Infotech, Open Text Corp., Parasoft Corp., Sauce Labs Inc., Tricentis GmbH, and Worksoft. Also, the automation testing market analysis report includes information on upcoming trends and challenges that will influence market growth. This is to help companies strategize and leverage all forthcoming growth opportunities.
The study was conducted using an objective combination of primary and secondary information including inputs from key participants in the industry. The report contains a comprehensive market and vendor landscape in addition to an analysis of the key vendors.
The publisher presents a detailed picture of the market by the way of study, synthesis, and summation of data from multiple sources by an analysis of key parameters such as profit, pricing, competition, and promotions. It presents various market facets by identifying the key industry influencers. The data presented is comprehensive, reliable, and a result of extensive research - both primary and secondary. The market research reports provide a complete competitive landscape and an in-depth vendor selection methodology and analysis using qualitative and quantitative research to forecast the accurate market growth.
Table of Contents
1 Executive Summary
- 1.1 Market overview
2 Market Landscape
- 2.1 Market ecosystem
3 Market Sizing
- 3.1 Market definition
- 3.2 Market segment analysis
- 3.3 Market size 2023
- 3.4 Market outlook: Forecast for 2023-2028
4 Historic Market Size
- 4.1 Global automation testing market 2018 - 2022
- 4.2 End-user Segment Analysis 2018 - 2022
- 4.3 Deployment Segment Analysis 2018 - 2022
- 4.4 Geography Segment Analysis 2018 - 2022
- 4.5 Country Segment Analysis 2018 - 2022
5 Five Forces Analysis
- 5.1 Five forces summary
- 5.2 Bargaining power of buyers
- 5.3 Bargaining power of suppliers
- 5.4 Threat of new entrants
- 5.5 Threat of substitutes
- 5.6 Threat of rivalry
- 5.7 Market condition
6 Market Segmentation by End-user
- 6.1 Market segments
- 6.2 Comparison by End-user
- 6.3 BFSI - Market size and forecast 2023-2028
- 6.4 Telecom and media - Market size and forecast 2023-2028
- 6.5 Manufacturing - Market size and forecast 2023-2028
- 6.6 Others - Market size and forecast 2023-2028
- 6.7 Market opportunity by End-user
7 Market Segmentation by Deployment
- 7.1 Market segments
- 7.2 Comparison by Deployment
- 7.3 On-premises - Market size and forecast 2023-2028
- 7.4 Cloud-based - Market size and forecast 2023-2028
- 7.5 Market opportunity by Deployment
8 Customer Landscape
- 8.1 Customer landscape overview
9 Geographic Landscape
- 9.1 Geographic segmentation
- 9.2 Geographic comparison
- 9.3 North America - Market size and forecast 2023-2028
- 9.4 Europe - Market size and forecast 2023-2028
- 9.5 APAC - Market size and forecast 2023-2028
- 9.6 South America - Market size and forecast 2023-2028
- 9.7 Middle East and Africa - Market size and forecast 2023-2028
- 9.8 US - Market size and forecast 2023-2028
- 9.9 China - Market size and forecast 2023-2028
- 9.10 UK - Market size and forecast 2023-2028
- 9.11 Germany - Market size and forecast 2023-2028
- 9.12 Japan - Market size and forecast 2023-2028
- 9.13 Market opportunity By Geographical Landscape
10 Drivers, Challenges, and Trends
- 10.1 Market drivers
- 10.2 Market challenges
- 10.3 Impact of drivers and challenges
- 10.4 Market trends
11 Vendor Landscape
- 11.1 Overview
- 11.2 Vendor landscape
- 11.3 Landscape disruption
- 11.4 Industry risks
12 Vendor Analysis
- 12.1 Vendors covered
- 12.2 Market positioning of vendors
- 12.3 Accenture Plc
- 12.4 Afour technologies
- 12.5 Apexon
- 12.6 Applitools Group
- 12.7 Astegic Inc.
- 12.8 Broadcom Inc.
- 12.9 Capgemini Service SAS
- 12.10 Cigniti Technologies Ltd.
- 12.11 Codoid
- 12.12 International Business Machines Corp.
- 12.13 Keysight Technologies Inc.
- 12.14 Microsoft Corp.
- 12.15 Parasoft Corp.
- 12.16 Sauce Labs Inc.
- 12.17 Tricentis GmbH
13 Appendix
- 13.1 Scope of the report
- 13.2 Inclusions and exclusions checklist
- 13.3 Currency conversion rates for US$
- 13.4 Research methodology
- 13.5 List of abbreviations

