|
|
市場調査レポート
商品コード
1446169
プロバイオティクス原料の世界市場 2024-2028Global Probiotic Ingredients Market 2024-2028 |
||||||

|
|||||||
カスタマイズ可能
|
|||||||


| プロバイオティクス原料の世界市場 2024-2028 |
|
出版日: 2024年01月29日
発行: TechNavio
ページ情報: 英文 165 Pages
納期: 即納可能
|

全表示
- 概要
- 図表
- 目次
プロバイオティクス原料市場は2023-2028年に30億米ドル、予測期間中のCAGRは8.51%で成長すると予測されます。
当レポートでは、プロバイオティクス原料市場の全体的な分析、市場規模・予測、動向、成長促進要因、課題、約25のベンダーを網羅したベンダー分析などを掲載しています。
現在の市場シナリオ、最新動向と促進要因、市場環境全体に関する最新分析を提供しています。市場は、プロバイオティクスサプリメントの利点に関する意識の高まり、生活習慣病に関する意識の高まり、動物の健康に対するプロバイオティクス需要の増加によって牽引されています。
| 市場範囲 | |
|---|---|
| 基準年 | 2024 |
| 終了年 | 2028 |
| 予測期間 | 2024-2028 |
| 成長モメンタム | 加速 |
| 前年比2024年 | 7.87% |
| CAGR | 8.51% |
| 増分額 | 30億米ドル |
本調査では、今後数年間のプロバイオティクス原料市場の成長を促進する主な要因の1つとして、プロバイオティクスの用途拡大を挙げています。また、カスタマイズされたソリューションへの注目の高まりと製品イノベーションの増加は、市場の大きな需要につながります。
目次
第1章 エグゼクティブサマリー
- 市場概要
第2章 市場情勢
- 市場エコシステム
第3章 市場規模
- 市場の定義
- 市場セグメント分析
- 市場規模 2023
- 市場の見通し 2023-2028
第4章 市場規模実績
- プロバイオティクス原料の世界市場 2018-2022
- 用途別セグメント分析 2018-2022
- ソースセグメント分析 2018-2022
- 地域別セグメント分析 2018-2022
- 国別セグメント分析 2018-2022
第5章 ファイブフォース分析
- ファイブフォースの要約
- 買い手の交渉力
- 供給企業の交渉力
- 新規参入業者の脅威
- 代替品の脅威
- 競争の脅威
- 市況
第6章 市場セグメンテーション:用途別
- 市場セグメント
- 比較:用途別
- 飲食品:市場規模と予測 2023-2028
- 栄養補助食品:市場規模と予測 2023-2028
- その他:市場規模と予測 2023-2028
- 市場機会:用途別
第7章 市場セグメンテーション:ソース別
- 市場セグメント
- 比較:ソース別
- 細菌:市場規模と予測 2023-2028
- 酵母:市場規模と予測 2023-2028
- 市場機会:ソース別
第8章 顧客情勢
- 顧客情勢の概要
第9章 地域別情勢
- 地域別セグメンテーション
- 地域別比較
- アジア太平洋:市場規模と予測 2023-2028
- 欧州:市場規模と予測 2023-2028
- 北米:市場規模と予測 2023-2028
- 中東・アフリカ:市場規模と予測 2023-2028
- 南米:市場規模と予測 2023-2028
- 米国:市場規模と予測 2023-2028
- 日本:市場規模と予測 2023-2028
- 中国:市場規模と予測 2023-2028
- ドイツ:市場規模と予測 2023-2028
- 英国:市場規模と予測 2023-2028
- 市場機会:地域情勢別
第10章 促進要因、課題、および動向
- 市場促進要因
- 市場の課題
- 促進要因と課題の影響
- 市場動向
第11章 ベンダー情勢
- 概要
- ベンダー情勢
- 混乱の状況
- 業界のリスク
第12章 ベンダー分析
- 対象ベンダー
- ベンダーの市場ポジショニング
- Archer Daniels Midland Co.
- Biena Inc.
- BIOCODEX SAS
- BioGaia AB
- Chr Hansen Holding AS
- Danone SA
- DuPont de Nemours Inc.
- Kerry Group Plc
- Lallemand Inc.
- Novozymes OneHealth
- Nutris
- Probi AB
- Probiotical S.p.A.
- Sabinsa Corp.
- Winclove BV
第13章 付録
Exhibits:
- Exhibits1: Executive Summary - Chart on Market Overview
- Exhibits2: Executive Summary - Data Table on Market Overview
- Exhibits3: Executive Summary - Chart on Global Market Characteristics
- Exhibits4: Executive Summary - Chart on Market By Geographical Landscape
- Exhibits5: Executive Summary - Chart on Market Segmentation by Application
- Exhibits6: Executive Summary - Chart on Market Segmentation by Source
- Exhibits7: Executive Summary - Chart on Incremental Growth
- Exhibits8: Executive Summary - Data Table on Incremental Growth
- Exhibits9: Executive Summary - Chart on Vendor Market Positioning
- Exhibits10: Parent market
- Exhibits11: Market Characteristics
- Exhibits12: Offerings of vendors included in the market definition
- Exhibits13: Market segments
- Exhibits14: Chart on Global - Market size and forecast 2023-2028 ($ billion)
- Exhibits15: Data Table on Global - Market size and forecast 2023-2028 ($ billion)
- Exhibits16: Chart on Global Market: Year-over-year growth 2023-2028 (%)
- Exhibits17: Data Table on Global Market: Year-over-year growth 2023-2028 (%)
- Exhibits18: Historic Market Size - Data Table on global probiotic ingredients market 2018 - 2022 ($ billion)
- Exhibits19: Historic Market Size - Application Segment 2018 - 2022 ($ billion)
- Exhibits20: Historic Market Size - Source Segment 2018 - 2022 ($ billion)
- Exhibits21: Historic Market Size - Geography Segment 2018 - 2022 ($ billion)
- Exhibits22: Historic Market Size - Country Segment 2018 - 2022 ($ billion)
- Exhibits23: Five forces analysis - Comparison between 2023 and 2028
- Exhibits24: Chart on Bargaining power of buyers - Impact of key factors 2023 and 2028
- Exhibits25: Bargaining power of suppliers - Impact of key factors in 2023 and 2028
- Exhibits26: Threat of new entrants - Impact of key factors in 2023 and 2028
- Exhibits27: Threat of substitutes - Impact of key factors in 2023 and 2028
- Exhibits28: Threat of rivalry - Impact of key factors in 2023 and 2028
- Exhibits29: Chart on Market condition - Five forces 2023 and 2028
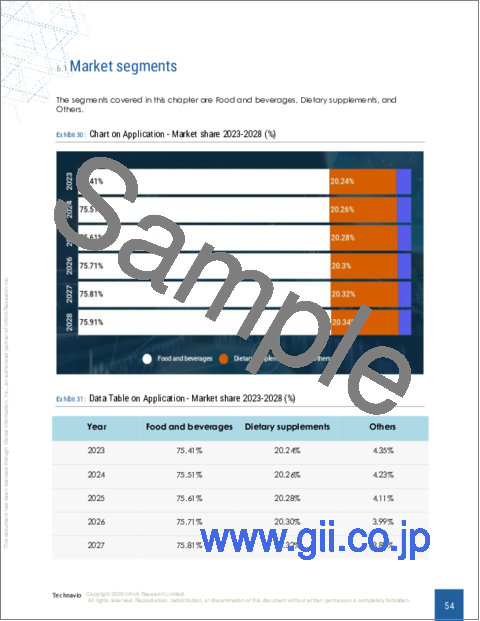
- Exhibits30: Chart on Application - Market share 2023-2028 (%)
- Exhibits31: Data Table on Application - Market share 2023-2028 (%)
- Exhibits32: Chart on Comparison by Application
- Exhibits33: Data Table on Comparison by Application
- Exhibits34: Chart on Food and beverages - Market size and forecast 2023-2028 ($ billion)
- Exhibits35: Data Table on Food and beverages - Market size and forecast 2023-2028 ($ billion)
- Exhibits36: Chart on Food and beverages - Year-over-year growth 2023-2028 (%)
- Exhibits37: Data Table on Food and beverages - Year-over-year growth 2023-2028 (%)
- Exhibits38: Chart on Dietary supplements - Market size and forecast 2023-2028 ($ billion)
- Exhibits39: Data Table on Dietary supplements - Market size and forecast 2023-2028 ($ billion)
- Exhibits40: Chart on Dietary supplements - Year-over-year growth 2023-2028 (%)
- Exhibits41: Data Table on Dietary supplements - Year-over-year growth 2023-2028 (%)
- Exhibits42: Chart on Others - Market size and forecast 2023-2028 ($ billion)
- Exhibits43: Data Table on Others - Market size and forecast 2023-2028 ($ billion)
- Exhibits44: Chart on Others - Year-over-year growth 2023-2028 (%)
- Exhibits45: Data Table on Others - Year-over-year growth 2023-2028 (%)
- Exhibits46: Market opportunity by Application ($ billion)
- Exhibits47: Data Table on Market opportunity by Application ($ billion)
- Exhibits48: Chart on Source - Market share 2023-2028 (%)
- Exhibits49: Data Table on Source - Market share 2023-2028 (%)
- Exhibits50: Chart on Comparison by Source
- Exhibits51: Data Table on Comparison by Source
- Exhibits52: Chart on Bacteria - Market size and forecast 2023-2028 ($ billion)
- Exhibits53: Data Table on Bacteria - Market size and forecast 2023-2028 ($ billion)
- Exhibits54: Chart on Bacteria - Year-over-year growth 2023-2028 (%)
- Exhibits55: Data Table on Bacteria - Year-over-year growth 2023-2028 (%)
- Exhibits56: Chart on Yeast - Market size and forecast 2023-2028 ($ billion)
- Exhibits57: Data Table on Yeast - Market size and forecast 2023-2028 ($ billion)
- Exhibits58: Chart on Yeast - Year-over-year growth 2023-2028 (%)
- Exhibits59: Data Table on Yeast - Year-over-year growth 2023-2028 (%)
- Exhibits60: Market opportunity by Source ($ billion)
- Exhibits61: Data Table on Market opportunity by Source ($ billion)
- Exhibits62: Analysis of price sensitivity, lifecycle, customer purchase basket, adoption rates, and purchase criteria
- Exhibits63: Chart on Market share By Geographical Landscape 2023-2028 (%)
- Exhibits64: Data Table on Market share By Geographical Landscape 2023-2028 (%)
- Exhibits65: Chart on Geographic comparison
- Exhibits66: Data Table on Geographic comparison
- Exhibits67: Chart on APAC - Market size and forecast 2023-2028 ($ billion)
- Exhibits68: Data Table on APAC - Market size and forecast 2023-2028 ($ billion)
- Exhibits69: Chart on APAC - Year-over-year growth 2023-2028 (%)
- Exhibits70: Data Table on APAC - Year-over-year growth 2023-2028 (%)
- Exhibits71: Chart on Europe - Market size and forecast 2023-2028 ($ billion)
- Exhibits72: Data Table on Europe - Market size and forecast 2023-2028 ($ billion)
- Exhibits73: Chart on Europe - Year-over-year growth 2023-2028 (%)
- Exhibits74: Data Table on Europe - Year-over-year growth 2023-2028 (%)
- Exhibits75: Chart on North America - Market size and forecast 2023-2028 ($ billion)
- Exhibits76: Data Table on North America - Market size and forecast 2023-2028 ($ billion)
- Exhibits77: Chart on North America - Year-over-year growth 2023-2028 (%)
- Exhibits78: Data Table on North America - Year-over-year growth 2023-2028 (%)
- Exhibits79: Chart on Middle East and Africa - Market size and forecast 2023-2028 ($ billion)
- Exhibits80: Data Table on Middle East and Africa - Market size and forecast 2023-2028 ($ billion)
- Exhibits81: Chart on Middle East and Africa - Year-over-year growth 2023-2028 (%)
- Exhibits82: Data Table on Middle East and Africa - Year-over-year growth 2023-2028 (%)
- Exhibits83: Chart on South America - Market size and forecast 2023-2028 ($ billion)
- Exhibits84: Data Table on South America - Market size and forecast 2023-2028 ($ billion)
- Exhibits85: Chart on South America - Year-over-year growth 2023-2028 (%)
- Exhibits86: Data Table on South America - Year-over-year growth 2023-2028 (%)
- Exhibits87: Chart on US - Market size and forecast 2023-2028 ($ billion)
- Exhibits88: Data Table on US - Market size and forecast 2023-2028 ($ billion)
- Exhibits89: Chart on US - Year-over-year growth 2023-2028 (%)
- Exhibits90: Data Table on US - Year-over-year growth 2023-2028 (%)
- Exhibits91: Chart on Japan - Market size and forecast 2023-2028 ($ billion)
- Exhibits92: Data Table on Japan - Market size and forecast 2023-2028 ($ billion)
- Exhibits93: Chart on Japan - Year-over-year growth 2023-2028 (%)
- Exhibits94: Data Table on Japan - Year-over-year growth 2023-2028 (%)
- Exhibits95: Chart on China - Market size and forecast 2023-2028 ($ billion)
- Exhibits96: Data Table on China - Market size and forecast 2023-2028 ($ billion)
- Exhibits97: Chart on China - Year-over-year growth 2023-2028 (%)
- Exhibits98: Data Table on China - Year-over-year growth 2023-2028 (%)
- Exhibits99: Chart on Germany - Market size and forecast 2023-2028 ($ billion)
- Exhibits100: Data Table on Germany - Market size and forecast 2023-2028 ($ billion)
- Exhibits101: Chart on Germany - Year-over-year growth 2023-2028 (%)
- Exhibits102: Data Table on Germany - Year-over-year growth 2023-2028 (%)
- Exhibits103: Chart on UK - Market size and forecast 2023-2028 ($ billion)
- Exhibits104: Data Table on UK - Market size and forecast 2023-2028 ($ billion)
- Exhibits105: Chart on UK - Year-over-year growth 2023-2028 (%)
- Exhibits106: Data Table on UK - Year-over-year growth 2023-2028 (%)
- Exhibits107: Market opportunity By Geographical Landscape ($ billion)
- Exhibits108: Data Tables on Market opportunity By Geographical Landscape ($ billion)
- Exhibits109: Impact of drivers and challenges in 2023 and 2028
- Exhibits110: Overview on Criticality of inputs and Factors of differentiation
- Exhibits111: Overview on factors of disruption
- Exhibits112: Impact of key risks on business
- Exhibits113: Vendors covered
- Exhibits114: Matrix on vendor position and classification
- Exhibits115: Archer Daniels Midland Co. - Overview
- Exhibits116: Archer Daniels Midland Co. - Business segments
- Exhibits117: Archer Daniels Midland Co. - Key offerings
- Exhibits118: Archer Daniels Midland Co. - Segment focus
- Exhibits119: Biena Inc. - Overview
- Exhibits120: Biena Inc. - Product / Service
- Exhibits121: Biena Inc. - Key offerings
- Exhibits122: BIOCODEX SAS - Overview
- Exhibits123: BIOCODEX SAS - Product / Service
- Exhibits124: BIOCODEX SAS - Key offerings
- Exhibits125: BioGaia AB - Overview
- Exhibits126: BioGaia AB - Business segments
- Exhibits127: BioGaia AB - Key news
- Exhibits128: BioGaia AB - Key offerings
- Exhibits129: BioGaia AB - Segment focus
- Exhibits130: Chr Hansen Holding AS - Overview
- Exhibits131: Chr Hansen Holding AS - Business segments
- Exhibits132: Chr Hansen Holding AS - Key news
- Exhibits133: Chr Hansen Holding AS - Key offerings
- Exhibits134: Chr Hansen Holding AS - Segment focus
- Exhibits135: Danone SA - Overview
- Exhibits136: Danone SA - Business segments
- Exhibits137: Danone SA - Key news
- Exhibits138: Danone SA - Key offerings
- Exhibits139: Danone SA - Segment focus
- Exhibits140: DuPont de Nemours Inc. - Overview
- Exhibits141: DuPont de Nemours Inc. - Business segments
- Exhibits142: DuPont de Nemours Inc. - Key news
- Exhibits143: DuPont de Nemours Inc. - Key offerings
- Exhibits144: DuPont de Nemours Inc. - Segment focus
- Exhibits145: Kerry Group Plc - Overview
- Exhibits146: Kerry Group Plc - Business segments
- Exhibits147: Kerry Group Plc - Key offerings
- Exhibits148: Kerry Group Plc - Segment focus
- Exhibits149: Lallemand Inc. - Overview
- Exhibits150: Lallemand Inc. - Product / Service
- Exhibits151: Lallemand Inc. - Key offerings
- Exhibits152: Novozymes OneHealth - Overview
- Exhibits153: Novozymes OneHealth - Product / Service
- Exhibits154: Novozymes OneHealth - Key offerings
- Exhibits155: Nutris - Overview
- Exhibits156: Nutris - Product / Service
- Exhibits157: Nutris - Key offerings
- Exhibits158: Probi AB - Overview
- Exhibits159: Probi AB - Business segments
- Exhibits160: Probi AB - Key offerings
- Exhibits161: Probi AB - Segment focus
- Exhibits162: Probiotical S.p.A. - Overview
- Exhibits163: Probiotical S.p.A. - Product / Service
- Exhibits164: Probiotical S.p.A. - Key offerings
- Exhibits165: Sabinsa Corp. - Overview
- Exhibits166: Sabinsa Corp. - Product / Service
- Exhibits167: Sabinsa Corp. - Key offerings
- Exhibits168: Winclove BV - Overview
- Exhibits169: Winclove BV - Product / Service
- Exhibits170: Winclove BV - Key offerings
- Exhibits171: Inclusions checklist
- Exhibits172: Exclusions checklist
- Exhibits173: Currency conversion rates for US$
- Exhibits174: Research methodology
- Exhibits175: Validation techniques employed for market sizing
- Exhibits176: Information sources
- Exhibits177: List of abbreviations
The probiotic ingredients market is forecasted to grow by USD 3.00 bn during 2023-2028, accelerating at a CAGR of 8.51% during the forecast period. The report on the probiotic ingredients market provides a holistic analysis, market size and forecast, trends, growth drivers, and challenges, as well as vendor analysis covering around 25 vendors.
The report offers an up-to-date analysis regarding the current market scenario, the latest trends and drivers, and the overall market environment. The market is driven by rising awareness about benefits of probiotic supplements, increased awareness about lifestyle-related diseases, and increasing demand for probiotics for animal health.
Technavio's probiotic ingredients market is segmented as below:
| Market Scope | |
|---|---|
| Base Year | 2024 |
| End Year | 2028 |
| Series Year | 2024-2028 |
| Growth Momentum | Accelerate |
| YOY 2024 | 7.87% |
| CAGR | 8.51% |
| Incremental Value | $3.00bn |
By Application
- Food and beverages
- Dietary supplements
- Others
By Source
- Bacteria
- Yeast
By Geographical Landscape
- APAC
- Europe
- North America
- Middle East and Africa
- South America
This study identifies the rising applications of probiotics as one of the prime reasons driving the probiotic ingredients market growth during the next few years. Also, growing focus on customized solutions and increasing product innovations will lead to sizable demand in the market.
The report on the probiotic ingredients market covers the following areas:
- Probiotic ingredients market sizing
- Probiotic ingredients market forecast
- Probiotic ingredients market industry analysis
The robust vendor analysis is designed to help clients improve their market position, and in line with this, this report provides a detailed analysis of several leading probiotic ingredients market vendors that include Archer Daniels Midland Co., Biena Inc., BIOCODEX SAS, BioGaia AB, Chr Hansen Holding AS, CUSTOM PROBIOTICS Inc., Danone SA, DuPont de Nemours Inc., Kerry Group Plc, Novozymes OneHealth, Sabinsa Corp., Thermo Fisher Scientific Inc., Unique Biotech Ltd., Winclove BV, Lallemand Inc., American Biosystems Inc., Nutris, Orffa International Holding B.V., Probi AB, and Probiotical S.p.A.. Also, the probiotic ingredients market analysis report includes information on upcoming trends and challenges that will influence market growth. This is to help companies strategize and leverage all forthcoming growth opportunities.
The study was conducted using an objective combination of primary and secondary information including inputs from key participants in the industry. The report contains a comprehensive market and vendor landscape in addition to an analysis of the key vendors.
The publisher presents a detailed picture of the market by the way of study, synthesis, and summation of data from multiple sources by an analysis of key parameters such as profit, pricing, competition, and promotions. It presents various market facets by identifying the key industry influencers. The data presented is comprehensive, reliable, and a result of extensive research - both primary and secondary. The market research reports provide a complete competitive landscape and an in-depth vendor selection methodology and analysis using qualitative and quantitative research to forecast the accurate market growth.
Table of Contents
1 Executive Summary
- 1.1 Market overview
2 Market Landscape
- 2.1 Market ecosystem
3 Market Sizing
- 3.1 Market definition
- 3.2 Market segment analysis
- 3.3 Market size 2023
- 3.4 Market outlook: Forecast for 2023-2028
4 Historic Market Size
- 4.1 Global probiotic ingredients market 2018 - 2022
- 4.2 Application Segment Analysis 2018 - 2022
- 4.3 Source Segment Analysis 2018 - 2022
- 4.4 Geography Segment Analysis 2018 - 2022
- 4.5 Country Segment Analysis 2018 - 2022
5 Five Forces Analysis
- 5.1 Five forces summary
- 5.2 Bargaining power of buyers
- 5.3 Bargaining power of suppliers
- 5.4 Threat of new entrants
- 5.5 Threat of substitutes
- 5.6 Threat of rivalry
- 5.7 Market condition
6 Market Segmentation by Application
- 6.1 Market segments
- 6.2 Comparison by Application
- 6.3 Food and beverages - Market size and forecast 2023-2028
- 6.4 Dietary supplements - Market size and forecast 2023-2028
- 6.5 Others - Market size and forecast 2023-2028
- 6.6 Market opportunity by Application
7 Market Segmentation by Source
- 7.1 Market segments
- 7.2 Comparison by Source
- 7.3 Bacteria - Market size and forecast 2023-2028
- 7.4 Yeast - Market size and forecast 2023-2028
- 7.5 Market opportunity by Source
8 Customer Landscape
- 8.1 Customer landscape overview
9 Geographic Landscape
- 9.1 Geographic segmentation
- 9.2 Geographic comparison
- 9.3 APAC - Market size and forecast 2023-2028
- 9.4 Europe - Market size and forecast 2023-2028
- 9.5 North America - Market size and forecast 2023-2028
- 9.6 Middle East and Africa - Market size and forecast 2023-2028
- 9.7 South America - Market size and forecast 2023-2028
- 9.8 US - Market size and forecast 2023-2028
- 9.9 Japan - Market size and forecast 2023-2028
- 9.10 China - Market size and forecast 2023-2028
- 9.11 Germany - Market size and forecast 2023-2028
- 9.12 UK - Market size and forecast 2023-2028
- 9.13 Market opportunity By Geographical Landscape
10 Drivers, Challenges, and Trends
- 10.1 Market drivers
- 10.2 Market challenges
- 10.3 Impact of drivers and challenges
- 10.4 Market trends
11 Vendor Landscape
- 11.1 Overview
- 11.2 Vendor landscape
- 11.3 Landscape disruption
- 11.4 Industry risks
12 Vendor Analysis
- 12.1 Vendors covered
- 12.2 Market positioning of vendors
- 12.3 Archer Daniels Midland Co.
- 12.4 Biena Inc.
- 12.5 BIOCODEX SAS
- 12.6 BioGaia AB
- 12.7 Chr Hansen Holding AS
- 12.8 Danone SA
- 12.9 DuPont de Nemours Inc.
- 12.10 Kerry Group Plc
- 12.11 Lallemand Inc.
- 12.12 Novozymes OneHealth
- 12.13 Nutris
- 12.14 Probi AB
- 12.15 Probiotical S.p.A.
- 12.16 Sabinsa Corp.
- 12.17 Winclove BV
13 Appendix
- 13.1 Scope of the report
- 13.2 Inclusions and exclusions checklist
- 13.3 Currency conversion rates for US$
- 13.4 Research methodology
- 13.5 List of abbreviations

