|
|
市場調査レポート
商品コード
1446161
ラボラトリーオートメーションシステムの世界市場 2024-2028Global Laboratory Automation Systems Market 2024-2028 |
||||||
|
|||||||
カスタマイズ可能
|
|||||||


| ラボラトリーオートメーションシステムの世界市場 2024-2028 |
|
出版日: 2024年02月15日
発行: TechNavio
ページ情報: 英文 172 Pages
納期: 即納可能
|

全表示
- 概要
- 図表
- 目次
ラボラトリーオートメーションシステム市場は2023-2028年に20億1,000万米ドル、予測期間中のCAGRは8.68%で成長すると予測されます。
当レポートでは、ラボラトリーオートメーションシステム市場の全体的な分析、市場規模・予測、動向、成長促進要因、課題、約25のベンダーを網羅したベンダー分析などを掲載しています。
現在の市場シナリオ、最新動向と促進要因、市場環境全体に関する最新分析を提供しています。市場は、ラボラトリーオートメーションソフトウェアサービスに対する需要の増加、ヘルスケアにおける自動化ソリューションの利用の高まり、タンパク質結晶化および結晶学に対する高い需要が牽引しています。
| 市場範囲 | |
|---|---|
| 基準年 | 2024 |
| 終了年 | 2028 |
| 予測期間 | 2024-2028 |
| 成長モメンタム | 加速 |
| 前年比2024年 | 8.26% |
| CAGR | 8.68% |
| 増分額 | 20億1,000万米ドル |
本調査では、今後数年間におけるラボラトリーオートメーションシステム市場の成長を促進する主な要因の一つとして、新興国市場におけるFDA認可製造施設数の増加を挙げています。また、体外診断業界における標準化と自動化の採用、ワクチン生産の増加が市場の大きな需要につながります。
目次
第1章 エグゼクティブサマリー
- 市場概要
第2章 市場情勢
- 市場エコシステム
第3章 市場規模
- 市場の定義
- 市場セグメント分析
- 市場規模 2023
- 市場の見通し 2023-2028
第4章 市場規模実績
- ラボラトリーオートメーションシステムの世界市場 2018-2022
- エンドユーザーセグメント分析 2018-2022
- タイプセグメント分析 2018-2022
- 地域別セグメント分析 2018-2022
- 国別セグメント分析 2018-2022
第5章 ファイブフォース分析
- ファイブフォースの要約
- 買い手の交渉力
- 供給企業の交渉力
- 新規参入業者の脅威
- 代替品の脅威
- 競争の脅威
- 市況
第6章 市場セグメンテーション:エンドユーザー別
- 市場セグメント
- 比較:エンドユーザー別
- 製薬会社およびバイオテクノロジー会社:市場規模と予測 2023-2028
- 臨床検査機関および参考検査機関:市場規模と予測 2023-2028
- 学術機関および調査機関:市場規模と予測 2023-2028
- その他:市場規模と予測 2023-2028
- 市場機会:エンドユーザー別
第7章 市場セグメンテーション:タイプ別
- 市場セグメント
- 比較:タイプ別
- 装置:市場規模と予測 2023-2028
- ソフトウェアとサービス:市場規模と予測 2023-2028
- 市場機会:タイプ別
第8章 顧客情勢
- 顧客情勢の概要
第9章 地域別情勢
- 地域別セグメンテーション
- 地域別比較
- 北米:市場規模と予測 2023-2028
- 欧州:市場規模と予測 2023-2028
- アジア:市場規模と予測 2023-2028
- 世界のその他の地域:市場規模と予測 2023-2028
- 米国:市場規模と予測 2023-2028
- ドイツ:市場規模と予測 2023-2028
- 英国:市場規模と予測 2023-2028
- 中国:市場規模と予測 2023-2028
- 日本:市場規模と予測 2023-2028
- 市場機会:地域情勢別
第10章 促進要因、課題、および動向
- 市場促進要因
- 市場の課題
- 促進要因と課題の影響
- 市場動向
第11章 ベンダー情勢
- 概要
- ベンダー情勢
- 混乱の状況
- 業界のリスク
第12章 ベンダー分析
- 対象ベンダー
- ベンダーの市場ポジショニング
- Abbott Laboratories
- Agilent Technologies Inc.
- Bee Robotics Ltd.
- Eppendorf SE
- Gilson Inc.
- LabVantage Solutions Inc.
- LabWare Inc.
- Olympus Corp.
- PerkinElmer Inc
- QIAGEN NV
- SCINOMIX
- Siemens AG
- SPT Labtech Ltd.
- Tecan Trading AG
- Thermo Fisher Scientific Inc.
第13章 付録
Exhibits:
- Exhibits1: Executive Summary - Chart on Market Overview
- Exhibits2: Executive Summary - Data Table on Market Overview
- Exhibits3: Executive Summary - Chart on Global Market Characteristics
- Exhibits4: Executive Summary - Chart on Market By Geographical Landscape
- Exhibits5: Executive Summary - Chart on Market Segmentation by End-user
- Exhibits6: Executive Summary - Chart on Market Segmentation by Type
- Exhibits7: Executive Summary - Chart on Incremental Growth
- Exhibits8: Executive Summary - Data Table on Incremental Growth
- Exhibits9: Executive Summary - Chart on Vendor Market Positioning
- Exhibits10: Parent market
- Exhibits11: Market Characteristics
- Exhibits12: Offerings of vendors included in the market definition
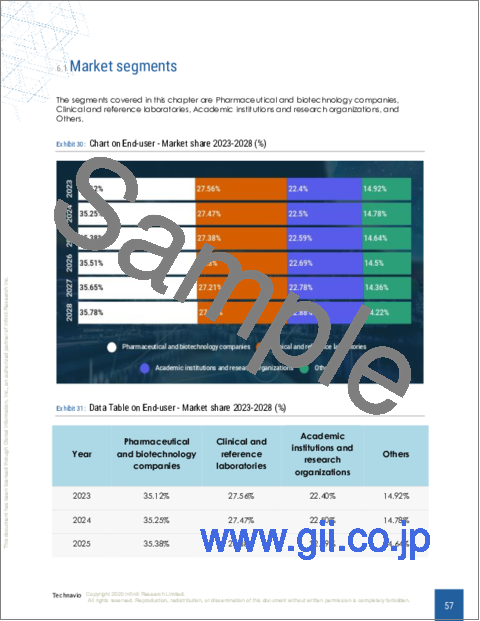
- Exhibits13: Market segments
- Exhibits14: Chart on Global - Market size and forecast 2023-2028 ($ billion)
- Exhibits15: Data Table on Global - Market size and forecast 2023-2028 ($ billion)
- Exhibits16: Chart on Global Market: Year-over-year growth 2023-2028 (%)
- Exhibits17: Data Table on Global Market: Year-over-year growth 2023-2028 (%)
- Exhibits18: Historic Market Size - Data Table on global laboratory automation systems market 2018 - 2022 ($ billion)
- Exhibits19: Historic Market Size - End-user Segment 2018 - 2022 ($ billion)
- Exhibits20: Historic Market Size - Type Segment 2018 - 2022 ($ billion)
- Exhibits21: Historic Market Size - Geography Segment 2018 - 2022 ($ billion)
- Exhibits22: Historic Market Size - Country Segment 2018 - 2022 ($ billion)
- Exhibits23: Five forces analysis - Comparison between 2023 and 2028
- Exhibits24: Chart on Bargaining power of buyers - Impact of key factors 2023 and 2028
- Exhibits25: Bargaining power of suppliers - Impact of key factors in 2023 and 2028
- Exhibits26: Threat of new entrants - Impact of key factors in 2023 and 2028
- Exhibits27: Threat of substitutes - Impact of key factors in 2023 and 2028
- Exhibits28: Threat of rivalry - Impact of key factors in 2023 and 2028
- Exhibits29: Chart on Market condition - Five forces 2023 and 2028
- Exhibits30: Chart on End-user - Market share 2023-2028 (%)
- Exhibits31: Data Table on End-user - Market share 2023-2028 (%)
- Exhibits32: Chart on Comparison by End-user
- Exhibits33: Data Table on Comparison by End-user
- Exhibits34: Chart on Pharmaceutical and biotechnology companies - Market size and forecast 2023-2028 ($ billion)
- Exhibits35: Data Table on Pharmaceutical and biotechnology companies - Market size and forecast 2023-2028 ($ billion)
- Exhibits36: Chart on Pharmaceutical and biotechnology companies - Year-over-year growth 2023-2028 (%)
- Exhibits37: Data Table on Pharmaceutical and biotechnology companies - Year-over-year growth 2023-2028 (%)
- Exhibits38: Chart on Clinical and reference laboratories - Market size and forecast 2023-2028 ($ billion)
- Exhibits39: Data Table on Clinical and reference laboratories - Market size and forecast 2023-2028 ($ billion)
- Exhibits40: Chart on Clinical and reference laboratories - Year-over-year growth 2023-2028 (%)
- Exhibits41: Data Table on Clinical and reference laboratories - Year-over-year growth 2023-2028 (%)
- Exhibits42: Chart on Academic institutions and research organizations - Market size and forecast 2023-2028 ($ billion)
- Exhibits43: Data Table on Academic institutions and research organizations - Market size and forecast 2023-2028 ($ billion)
- Exhibits44: Chart on Academic institutions and research organizations - Year-over-year growth 2023-2028 (%)
- Exhibits45: Data Table on Academic institutions and research organizations - Year-over-year growth 2023-2028 (%)
- Exhibits46: Chart on Others - Market size and forecast 2023-2028 ($ billion)
- Exhibits47: Data Table on Others - Market size and forecast 2023-2028 ($ billion)
- Exhibits48: Chart on Others - Year-over-year growth 2023-2028 (%)
- Exhibits49: Data Table on Others - Year-over-year growth 2023-2028 (%)
- Exhibits50: Market opportunity by End-user ($ billion)
- Exhibits51: Data Table on Market opportunity by End-user ($ billion)
- Exhibits52: Chart on Type - Market share 2023-2028 (%)
- Exhibits53: Data Table on Type - Market share 2023-2028 (%)
- Exhibits54: Chart on Comparison by Type
- Exhibits55: Data Table on Comparison by Type
- Exhibits56: Chart on Equipment - Market size and forecast 2023-2028 ($ billion)
- Exhibits57: Data Table on Equipment - Market size and forecast 2023-2028 ($ billion)
- Exhibits58: Chart on Equipment - Year-over-year growth 2023-2028 (%)
- Exhibits59: Data Table on Equipment - Year-over-year growth 2023-2028 (%)
- Exhibits60: Chart on Software and services - Market size and forecast 2023-2028 ($ billion)
- Exhibits61: Data Table on Software and services - Market size and forecast 2023-2028 ($ billion)
- Exhibits62: Chart on Software and services - Year-over-year growth 2023-2028 (%)
- Exhibits63: Data Table on Software and services - Year-over-year growth 2023-2028 (%)
- Exhibits64: Market opportunity by Type ($ billion)
- Exhibits65: Data Table on Market opportunity by Type ($ billion)
- Exhibits66: Analysis of price sensitivity, lifecycle, customer purchase basket, adoption rates, and purchase criteria
- Exhibits67: Chart on Market share By Geographical Landscape 2023-2028 (%)
- Exhibits68: Data Table on Market share By Geographical Landscape 2023-2028 (%)
- Exhibits69: Chart on Geographic comparison
- Exhibits70: Data Table on Geographic comparison
- Exhibits71: Chart on North America - Market size and forecast 2023-2028 ($ billion)
- Exhibits72: Data Table on North America - Market size and forecast 2023-2028 ($ billion)
- Exhibits73: Chart on North America - Year-over-year growth 2023-2028 (%)
- Exhibits74: Data Table on North America - Year-over-year growth 2023-2028 (%)
- Exhibits75: Chart on Europe - Market size and forecast 2023-2028 ($ billion)
- Exhibits76: Data Table on Europe - Market size and forecast 2023-2028 ($ billion)
- Exhibits77: Chart on Europe - Year-over-year growth 2023-2028 (%)
- Exhibits78: Data Table on Europe - Year-over-year growth 2023-2028 (%)
- Exhibits79: Chart on Asia - Market size and forecast 2023-2028 ($ billion)
- Exhibits80: Data Table on Asia - Market size and forecast 2023-2028 ($ billion)
- Exhibits81: Chart on Asia - Year-over-year growth 2023-2028 (%)
- Exhibits82: Data Table on Asia - Year-over-year growth 2023-2028 (%)
- Exhibits83: Chart on Rest of World (ROW) - Market size and forecast 2023-2028 ($ billion)
- Exhibits84: Data Table on Rest of World (ROW) - Market size and forecast 2023-2028 ($ billion)
- Exhibits85: Chart on Rest of World (ROW) - Year-over-year growth 2023-2028 (%)
- Exhibits86: Data Table on Rest of World (ROW) - Year-over-year growth 2023-2028 (%)
- Exhibits87: Chart on US - Market size and forecast 2023-2028 ($ billion)
- Exhibits88: Data Table on US - Market size and forecast 2023-2028 ($ billion)
- Exhibits89: Chart on US - Year-over-year growth 2023-2028 (%)
- Exhibits90: Data Table on US - Year-over-year growth 2023-2028 (%)
- Exhibits91: Chart on Germany - Market size and forecast 2023-2028 ($ billion)
- Exhibits92: Data Table on Germany - Market size and forecast 2023-2028 ($ billion)
- Exhibits93: Chart on Germany - Year-over-year growth 2023-2028 (%)
- Exhibits94: Data Table on Germany - Year-over-year growth 2023-2028 (%)
- Exhibits95: Chart on UK - Market size and forecast 2023-2028 ($ billion)
- Exhibits96: Data Table on UK - Market size and forecast 2023-2028 ($ billion)
- Exhibits97: Chart on UK - Year-over-year growth 2023-2028 (%)
- Exhibits98: Data Table on UK - Year-over-year growth 2023-2028 (%)
- Exhibits99: Chart on China - Market size and forecast 2023-2028 ($ billion)
- Exhibits100: Data Table on China - Market size and forecast 2023-2028 ($ billion)
- Exhibits101: Chart on China - Year-over-year growth 2023-2028 (%)
- Exhibits102: Data Table on China - Year-over-year growth 2023-2028 (%)
- Exhibits103: Chart on Japan - Market size and forecast 2023-2028 ($ billion)
- Exhibits104: Data Table on Japan - Market size and forecast 2023-2028 ($ billion)
- Exhibits105: Chart on Japan - Year-over-year growth 2023-2028 (%)
- Exhibits106: Data Table on Japan - Year-over-year growth 2023-2028 (%)
- Exhibits107: Market opportunity By Geographical Landscape ($ billion)
- Exhibits108: Data Tables on Market opportunity By Geographical Landscape ($ billion)
- Exhibits109: Impact of drivers and challenges in 2023 and 2028
- Exhibits110: Overview on Criticality of inputs and Factors of differentiation
- Exhibits111: Overview on factors of disruption
- Exhibits112: Impact of key risks on business
- Exhibits113: Vendors covered
- Exhibits114: Matrix on vendor position and classification
- Exhibits115: Abbott Laboratories - Overview
- Exhibits116: Abbott Laboratories - Business segments
- Exhibits117: Abbott Laboratories - Key news
- Exhibits118: Abbott Laboratories - Key offerings
- Exhibits119: Abbott Laboratories - Segment focus
- Exhibits120: Agilent Technologies Inc. - Overview
- Exhibits121: Agilent Technologies Inc. - Business segments
- Exhibits122: Agilent Technologies Inc. - Key offerings
- Exhibits123: Agilent Technologies Inc. - Segment focus
- Exhibits124: Bee Robotics Ltd. - Overview
- Exhibits125: Bee Robotics Ltd. - Key offerings
- Exhibits126: Eppendorf SE - Overview
- Exhibits127: Eppendorf SE - Product / Service
- Exhibits128: Eppendorf SE - Key news
- Exhibits129: Eppendorf SE - Key offerings
- Exhibits130: Gilson Inc. - Overview
- Exhibits131: Gilson Inc. - Product / Service
- Exhibits132: Gilson Inc. - Key offerings
- Exhibits133: LabVantage Solutions Inc. - Overview
- Exhibits134: LabVantage Solutions Inc. - Product / Service
- Exhibits135: LabVantage Solutions Inc. - Key offerings
- Exhibits136: LabWare Inc. - Overview
- Exhibits137: LabWare Inc. - Product / Service
- Exhibits138: LabWare Inc. - Key offerings
- Exhibits139: Olympus Corp. - Overview
- Exhibits140: Olympus Corp. - Business segments
- Exhibits141: Olympus Corp. - Key news
- Exhibits142: Olympus Corp. - Key offerings
- Exhibits143: Olympus Corp. - Segment focus
- Exhibits144: PerkinElmer Inc - Overview
- Exhibits145: PerkinElmer Inc - Business segments
- Exhibits146: PerkinElmer Inc - Key news
- Exhibits147: PerkinElmer Inc - Key offerings
- Exhibits148: PerkinElmer Inc - Segment focus
- Exhibits149: QIAGEN NV - Overview
- Exhibits150: QIAGEN NV - Product / Service
- Exhibits151: QIAGEN NV - Key news
- Exhibits152: QIAGEN NV - Key offerings
- Exhibits153: SCINOMIX - Overview
- Exhibits154: SCINOMIX - Product / Service
- Exhibits155: SCINOMIX - Key offerings
- Exhibits156: Siemens AG - Overview
- Exhibits157: Siemens AG - Business segments
- Exhibits158: Siemens AG - Key news
- Exhibits159: Siemens AG - Key offerings
- Exhibits160: Siemens AG - Segment focus
- Exhibits161: SPT Labtech Ltd. - Overview
- Exhibits162: SPT Labtech Ltd. - Product / Service
- Exhibits163: SPT Labtech Ltd. - Key offerings
- Exhibits164: Tecan Trading AG - Overview
- Exhibits165: Tecan Trading AG - Business segments
- Exhibits166: Tecan Trading AG - Key offerings
- Exhibits167: Tecan Trading AG - Segment focus
- Exhibits168: Thermo Fisher Scientific Inc. - Overview
- Exhibits169: Thermo Fisher Scientific Inc. - Business segments
- Exhibits170: Thermo Fisher Scientific Inc. - Key news
- Exhibits171: Thermo Fisher Scientific Inc. - Key offerings
- Exhibits172: Thermo Fisher Scientific Inc. - Segment focus
- Exhibits173: Inclusions checklist
- Exhibits174: Exclusions checklist
- Exhibits175: Currency conversion rates for US$
- Exhibits176: Research methodology
- Exhibits177: Validation techniques employed for market sizing
- Exhibits178: Information sources
- Exhibits179: List of abbreviations
The laboratory automation systems market is forecasted to grow by USD 2.01 bn during 2023-2028, accelerating at a CAGR of 8.68% during the forecast period. The report on the laboratory automation systems market provides a holistic analysis, market size and forecast, trends, growth drivers, and challenges, as well as vendor analysis covering around 25 vendors.
The report offers an up-to-date analysis regarding the current market scenario, the latest trends and drivers, and the overall market environment. The market is driven by increasing demand for laboratory automation software services, rising use of automated solutions in healthcare, and high demand for protein crystallization and crystallography.
Technavio's laboratory automation systems market is segmented as below:
| Market Scope | |
|---|---|
| Base Year | 2024 |
| End Year | 2028 |
| Series Year | 2024-2028 |
| Growth Momentum | Accelerate |
| YOY 2024 | 8.26% |
| CAGR | 8.68% |
| Incremental Value | $2.01bn |
By End-user
- Pharmaceutical and biotechnology companies
- Clinical and reference laboratories
- Academic institutions and research organizations
- Others
By Type
- Equipment
- Software
- services
By Geographical Landscape
- North America
- Europe
- Asia
- Rest of World (ROW)
This study identifies the rising number of FDA-approved manufacturing facilities in developing nations as one of the prime reasons driving the laboratory automation systems market growth during the next few years. Also, adoption of standardization and automation in in-vitro diagnostics industry and increased vaccine production will lead to sizable demand in the market.
The report on the laboratory automation systems market covers the following areas:
- Laboratory automation systems market sizing
- Laboratory automation systems market forecast
- Laboratory automation systems market industry analysis
The robust vendor analysis is designed to help clients improve their market position, and in line with this, this report provides a detailed analysis of several leading laboratory automation systems market vendors that include Abbott Laboratories, Agilent Technologies Inc., Becton Dickinson and Co., Bee Robotics Ltd., Biosero Inc., Cognex Corp., Eppendorf SE, F. Hoffmann La Roche Ltd., Gilson Inc., LabVantage Solutions Inc., LabWare Inc., Olympus Corp., PerkinElmer Inc, QIAGEN NV, SCINOMIX, Siemens AG, SPT Labtech Ltd., Tecan Trading AG, and Thermo Fisher Scientific Inc.. Also, the laboratory automation systems market analysis report includes information on upcoming trends and challenges that will influence market growth. This is to help companies strategize and leverage all forthcoming growth opportunities.
The study was conducted using an objective combination of primary and secondary information including inputs from key participants in the industry. The report contains a comprehensive market and vendor landscape in addition to an analysis of the key vendors.
The publisher presents a detailed picture of the market by the way of study, synthesis, and summation of data from multiple sources by an analysis of key parameters such as profit, pricing, competition, and promotions. It presents various market facets by identifying the key industry influencers. The data presented is comprehensive, reliable, and a result of extensive research - both primary and secondary. The market research reports provide a complete competitive landscape and an in-depth vendor selection methodology and analysis using qualitative and quantitative research to forecast the accurate market growth.
Table of Contents
1 Executive Summary
- 1.1 Market overview
2 Market Landscape
- 2.1 Market ecosystem
3 Market Sizing
- 3.1 Market definition
- 3.2 Market segment analysis
- 3.3 Market size 2023
- 3.4 Market outlook: Forecast for 2023-2028
4 Historic Market Size
- 4.1 Global laboratory automation systems market 2018 - 2022
- 4.2 End-user Segment Analysis 2018 - 2022
- 4.3 Type Segment Analysis 2018 - 2022
- 4.4 Geography Segment Analysis 2018 - 2022
- 4.5 Country Segment Analysis 2018 - 2022
5 Five Forces Analysis
- 5.1 Five forces summary
- 5.2 Bargaining power of buyers
- 5.3 Bargaining power of suppliers
- 5.4 Threat of new entrants
- 5.5 Threat of substitutes
- 5.6 Threat of rivalry
- 5.7 Market condition
6 Market Segmentation by End-user
- 6.1 Market segments
- 6.2 Comparison by End-user
- 6.3 Pharmaceutical and biotechnology companies - Market size and forecast 2023-2028
- 6.4 Clinical and reference laboratories - Market size and forecast 2023-2028
- 6.5 Academic institutions and research organizations - Market size and forecast 2023-2028
- 6.6 Others - Market size and forecast 2023-2028
- 6.7 Market opportunity by End-user
7 Market Segmentation by Type
- 7.1 Market segments
- 7.2 Comparison by Type
- 7.3 Equipment - Market size and forecast 2023-2028
- 7.4 Software and services - Market size and forecast 2023-2028
- 7.5 Market opportunity by Type
8 Customer Landscape
- 8.1 Customer landscape overview
9 Geographic Landscape
- 9.1 Geographic segmentation
- 9.2 Geographic comparison
- 9.3 North America - Market size and forecast 2023-2028
- 9.4 Europe - Market size and forecast 2023-2028
- 9.5 Asia - Market size and forecast 2023-2028
- 9.6 Rest of World (ROW) - Market size and forecast 2023-2028
- 9.7 US - Market size and forecast 2023-2028
- 9.8 Germany - Market size and forecast 2023-2028
- 9.9 UK - Market size and forecast 2023-2028
- 9.10 China - Market size and forecast 2023-2028
- 9.11 Japan - Market size and forecast 2023-2028
- 9.12 Market opportunity By Geographical Landscape
10 Drivers, Challenges, and Trends
- 10.1 Market drivers
- 10.2 Market challenges
- 10.3 Impact of drivers and challenges
- 10.4 Market trends
11 Vendor Landscape
- 11.1 Overview
- 11.2 Vendor landscape
- 11.3 Landscape disruption
- 11.4 Industry risks
12 Vendor Analysis
- 12.1 Vendors covered
- 12.2 Market positioning of vendors
- 12.3 Abbott Laboratories
- 12.4 Agilent Technologies Inc.
- 12.5 Bee Robotics Ltd.
- 12.6 Eppendorf SE
- 12.7 Gilson Inc.
- 12.8 LabVantage Solutions Inc.
- 12.9 LabWare Inc.
- 12.10 Olympus Corp.
- 12.11 PerkinElmer Inc
- 12.12 QIAGEN NV
- 12.13 SCINOMIX
- 12.14 Siemens AG
- 12.15 SPT Labtech Ltd.
- 12.16 Tecan Trading AG
- 12.17 Thermo Fisher Scientific Inc.
13 Appendix
- 13.1 Scope of the report
- 13.2 Inclusions and exclusions checklist
- 13.3 Currency conversion rates for US$
- 13.4 Research methodology
- 13.5 List of abbreviations

