|
|
市場調査レポート
商品コード
1748524
スズの世界市場(2025年~2029年)Global Tin Market 2025-2029 |
||||||

|
|||||||
カスタマイズ可能
|
|||||||


| スズの世界市場(2025年~2029年) |
|
出版日: 2025年06月11日
発行: TechNavio
ページ情報: 英文 230 Pages
納期: 即納可能
|

全表示
- 概要
- 図表
- 目次
世界のスズの市場規模は、2024年~2029年に8億7,660万米ドルに成長し、予測期間中のCAGRは2.1%となると予測されます。
当レポートでは、スズ市場の全体的な分析、市場規模・予測、動向、成長促進要因、課題、約25のベンダーを網羅したベンダー分析などを掲載しています。
現在の市場シナリオ、最新動向と促進要因、市場環境全体に関する最新分析を提供しています。缶詰食品・飲料の需要拡大、鉛フリーはんだ付けの需要増加、家電産業の拡大が市場を牽引しています。
| 市場範囲 | |
|---|---|
| 基準年 | 2025年 |
| 終了年 | 2029年 |
| 予測期間 | 2025年~2029年 |
| 成長モメンタム | 加速 |
| 前年比 | 2.1% |
| CAGR | 2.1% |
| 増分額 | 8億7,660万米ドル |
本調査は、業界の主要参加者からのインプットを含め、一次情報と二次情報を客観的に組み合わせて実施しました。レポートには、主要企業の分析に加え、包括的な市場規模データ、地域別分析によるセグメント、ベンダー情勢が含まれています。レポートには過去データと予測データがあります。
本調査では、今後数年間のスズ市場の成長を促進する主な要因の1つとして、スズのリサイクルへのシフトを挙げています。また、太陽エネルギー産業の今後の成長と、様々な用途におけるスズの用途の増加が、市場の大きな需要につながる見込みです。
目次
第1章 エグゼクティブサマリー
- 市場概要
第2章 Technavioの分析
- 価格感度・ライフサイクル・顧客購入バスケット・採用率・購入基準の分析
- インプットの重要性と差別化の要因
- ディスラプションの要因
- 促進要因と課題の影響
第3章 市場情勢
- 市場エコシステム
- 市場の特徴
- バリューチェーン分析
第4章 市場規模
- 市場の定義
- 市場セグメント分析
- 市場規模(2024年)
- 市場の見通し(2024年~2029年)
第5章 市場規模実績
- スズの世界市場(2019年~2023年)
- 用途セグメント分析(2019年~2023年)
- エンドユーザーセグメント分析(2019年~2023年)
- 製品タイプセグメント分析(2019年~2023年)
- 地域セグメント分析(2019年~2023年)
- 国セグメント分析(2019年~2023年)
第6章 定性分析
- AIの影響:スズの世界市場
第7章 ファイブフォース分析
- ファイブフォースの要約
- 買い手の交渉力
- 供給企業の交渉力
- 新規参入業者の脅威
- 代替品の脅威
- 競争の脅威
- 市況
第8章 市場セグメンテーション:用途別
- 市場セグメント
- 比較:用途別
- はんだ付け:市場規模と予測(2024年~2029年)
- スズ化学品:市場規模と予測(2024年~2029年)
- ブリキ:市場規模と予測(2024年~2029年)
- 鉛蓄電池:市場規模と予測(2024年~2029年)
- その他:市場規模と予測(2024年~2029年)
- 市場機会:用途別
第9章 市場セグメンテーション:エンドユーザー別
- 市場セグメント
- 比較:エンドユーザー別
- エレクトロニクス:市場規模と予測(2024年~2029年)
- 自動車:市場規模と予測(2024年~2029年)
- 包装:市場規模と予測(2024年~2029年)
- ガラス:市場規模と予測(2024年~2029年)
- その他:市場規模と予測(2024年~2029年)
- 市場機会:エンドユーザー別
第10章 市場セグメンテーション:製品タイプ別
- 市場セグメント
- 比較:製品タイプ別
- 金属:市場規模と予測(2024年~2029年)
- 合金:市場規模と予測(2024年~2029年)
- 化合物:市場規模と予測(2024年~2029年)
- 市場機会:製品タイプ別
第11章 顧客情勢
- 顧客情勢の概要
第12章 地域別情勢
- 地域別セグメンテーション
- 地域別比較
- アジア太平洋:市場規模と予測(2024年~2029年)
- 欧州:市場規模と予測(2024年~2029年)
- 北米:市場規模と予測(2024年~2029年)
- 中東・アフリカ:市場規模と予測(2024年~2029年)
- 南米:市場規模と予測(2024年~2029年)
- 中国:市場規模と予測(2024年~2029年)
- 米国:市場規模と予測(2024年~2029年)
- インド:市場規模と予測(2024年~2029年)
- 日本:市場規模と予測(2024年~2029年)
- 韓国:市場規模と予測(2024年~2029年)
- ドイツ:市場規模と予測(2024年~2029年)
- 英国:市場規模と予測(2024年~2029年)
- オーストラリア:市場規模と予測(2024年~2029年)
- フランス:市場規模と予測(2024年~2029年)
- カナダ:市場規模と予測(2024年~2029年)
- 市場機会:地域情勢別
第13章 促進要因・課題・機会・抑制要因
- 市場促進要因
- 市場の課題
- 促進要因と課題の影響
- 市場の機会・抑制要因
第14章 競合情勢
- 概要
- 競合情勢
- ディスラプションの状況
- 業界のリスク
第15章 競合分析
- 企業プロファイル
- 企業ランキング指数
- 企業の市場ポジショニング
- ABM Metal Tech
- ArcelorMittal
- Aurubis AG
- Bharat Tin Works
- Bharat Ultimate Packaging Pvt. Ltd.
- DuPont de Nemours Inc.
- Hindustan Tin Works Ltd.
- Indium Corp.
- Malaysia Smelting Corp. Berhad
- Minsur SA
- PT TIMAH Persero Tbk
- Swastik Tins Pvt. Ltd.
- Thailand Smelting and Refining Co. Ltd.
- Yunnan Tin Group Holding Co. Ltd.
- Zenith Tins Pvt. Ltd.
第16章 付録
Exhibits:
- Exhibits1: Executive Summary - Chart on Market Overview
- Exhibits2: Executive Summary - Data Table on Market Overview
- Exhibits3: Executive Summary - Chart on Global Market Characteristics
- Exhibits4: Executive Summary - Chart on Market By Geographical Landscape
- Exhibits5: Executive Summary - Chart on Market Segmentation by Application
- Exhibits6: Executive Summary - Chart on Market Segmentation by End-user
- Exhibits7: Executive Summary - Chart on Market Segmentation by Product Type
- Exhibits8: Executive Summary - Chart on Incremental Growth
- Exhibits9: Executive Summary - Data Table on Incremental Growth
- Exhibits10: Executive Summary - Chart on Company Market Positioning
- Exhibits11: Analysis of price sensitivity, lifecycle, customer purchase basket, adoption rates, and purchase criteria
- Exhibits12: Overview on criticality of inputs and factors of differentiation
- Exhibits13: Overview on factors of disruption
- Exhibits14: Impact of drivers and challenges in 2024 and 2029
- Exhibits15: Parent Market
- Exhibits16: Data Table on - Parent Market
- Exhibits17: Market characteristics analysis
- Exhibits18: Value chain analysis
- Exhibits19: Offerings of companies included in the market definition
- Exhibits20: Market segments
- Exhibits21: Chart on Global - Market size and forecast 2024-2029 ($ million)
- Exhibits22: Data Table on Global - Market size and forecast 2024-2029 ($ million)
- Exhibits23: Chart on Global Market: Year-over-year growth 2024-2029 (%)
- Exhibits24: Data Table on Global Market: Year-over-year growth 2024-2029 (%)
- Exhibits25: Historic Market Size - Data Table on Global Tin Market 2019 - 2023 ($ million)
- Exhibits26: Historic Market Size - Application Segment 2019 - 2023 ($ million)
- Exhibits27: Historic Market Size - End-user Segment 2019 - 2023 ($ million)
- Exhibits28: Historic Market Size - Product Type Segment 2019 - 2023 ($ million)
- Exhibits29: Historic Market Size - Geography Segment 2019 - 2023 ($ million)
- Exhibits30: Historic Market Size - Country Segment 2019 - 2023 ($ million)
- Exhibits31: Five forces analysis - Comparison between 2024 and 2029
- Exhibits32: Bargaining power of buyers - Impact of key factors 2024 and 2029
- Exhibits33: Bargaining power of suppliers - Impact of key factors in 2024 and 2029
- Exhibits34: Threat of new entrants - Impact of key factors in 2024 and 2029
- Exhibits35: Threat of substitutes - Impact of key factors in 2024 and 2029
- Exhibits36: Threat of rivalry - Impact of key factors in 2024 and 2029
- Exhibits37: Chart on Market condition - Five forces 2024 and 2029
- Exhibits38: Chart on Application - Market share 2024-2029 (%)
- Exhibits39: Data Table on Application - Market share 2024-2029 (%)
- Exhibits40: Chart on Comparison by Application
- Exhibits41: Data Table on Comparison by Application
- Exhibits42: Chart on Soldering - Market size and forecast 2024-2029 ($ million)
- Exhibits43: Data Table on Soldering - Market size and forecast 2024-2029 ($ million)
- Exhibits44: Chart on Soldering - Year-over-year growth 2024-2029 (%)
- Exhibits45: Data Table on Soldering - Year-over-year growth 2024-2029 (%)
- Exhibits46: Chart on Tin chemical - Market size and forecast 2024-2029 ($ million)
- Exhibits47: Data Table on Tin chemical - Market size and forecast 2024-2029 ($ million)
- Exhibits48: Chart on Tin chemical - Year-over-year growth 2024-2029 (%)
- Exhibits49: Data Table on Tin chemical - Year-over-year growth 2024-2029 (%)
- Exhibits50: Chart on Tinplate - Market size and forecast 2024-2029 ($ million)
- Exhibits51: Data Table on Tinplate - Market size and forecast 2024-2029 ($ million)
- Exhibits52: Chart on Tinplate - Year-over-year growth 2024-2029 (%)
- Exhibits53: Data Table on Tinplate - Year-over-year growth 2024-2029 (%)
- Exhibits54: Chart on Lead acid battery - Market size and forecast 2024-2029 ($ million)
- Exhibits55: Data Table on Lead acid battery - Market size and forecast 2024-2029 ($ million)
- Exhibits56: Chart on Lead acid battery - Year-over-year growth 2024-2029 (%)
- Exhibits57: Data Table on Lead acid battery - Year-over-year growth 2024-2029 (%)
- Exhibits58: Chart on Others - Market size and forecast 2024-2029 ($ million)
- Exhibits59: Data Table on Others - Market size and forecast 2024-2029 ($ million)
- Exhibits60: Chart on Others - Year-over-year growth 2024-2029 (%)
- Exhibits61: Data Table on Others - Year-over-year growth 2024-2029 (%)
- Exhibits62: Market opportunity by Application ($ million)
- Exhibits63: Data Table on Market opportunity by Application ($ million)
- Exhibits64: Chart on End-user - Market share 2024-2029 (%)
- Exhibits65: Data Table on End-user - Market share 2024-2029 (%)
- Exhibits66: Chart on Comparison by End-user
- Exhibits67: Data Table on Comparison by End-user
- Exhibits68: Chart on Electronics - Market size and forecast 2024-2029 ($ million)
- Exhibits69: Data Table on Electronics - Market size and forecast 2024-2029 ($ million)
- Exhibits70: Chart on Electronics - Year-over-year growth 2024-2029 (%)
- Exhibits71: Data Table on Electronics - Year-over-year growth 2024-2029 (%)
- Exhibits72: Chart on Automotive - Market size and forecast 2024-2029 ($ million)
- Exhibits73: Data Table on Automotive - Market size and forecast 2024-2029 ($ million)
- Exhibits74: Chart on Automotive - Year-over-year growth 2024-2029 (%)
- Exhibits75: Data Table on Automotive - Year-over-year growth 2024-2029 (%)
- Exhibits76: Chart on Packaging - Market size and forecast 2024-2029 ($ million)
- Exhibits77: Data Table on Packaging - Market size and forecast 2024-2029 ($ million)
- Exhibits78: Chart on Packaging - Year-over-year growth 2024-2029 (%)
- Exhibits79: Data Table on Packaging - Year-over-year growth 2024-2029 (%)
- Exhibits80: Chart on Glass - Market size and forecast 2024-2029 ($ million)
- Exhibits81: Data Table on Glass - Market size and forecast 2024-2029 ($ million)
- Exhibits82: Chart on Glass - Year-over-year growth 2024-2029 (%)
- Exhibits83: Data Table on Glass - Year-over-year growth 2024-2029 (%)
- Exhibits84: Chart on Others - Market size and forecast 2024-2029 ($ million)
- Exhibits85: Data Table on Others - Market size and forecast 2024-2029 ($ million)
- Exhibits86: Chart on Others - Year-over-year growth 2024-2029 (%)
- Exhibits87: Data Table on Others - Year-over-year growth 2024-2029 (%)
- Exhibits88: Market opportunity by End-user ($ million)
- Exhibits89: Data Table on Market opportunity by End-user ($ million)
- Exhibits90: Chart on Product Type - Market share 2024-2029 (%)
- Exhibits91: Data Table on Product Type - Market share 2024-2029 (%)
- Exhibits92: Chart on Comparison by Product Type
- Exhibits93: Data Table on Comparison by Product Type
- Exhibits94: Chart on Metal - Market size and forecast 2024-2029 ($ million)
- Exhibits95: Data Table on Metal - Market size and forecast 2024-2029 ($ million)
- Exhibits96: Chart on Metal - Year-over-year growth 2024-2029 (%)
- Exhibits97: Data Table on Metal - Year-over-year growth 2024-2029 (%)
- Exhibits98: Chart on Alloy - Market size and forecast 2024-2029 ($ million)
- Exhibits99: Data Table on Alloy - Market size and forecast 2024-2029 ($ million)
- Exhibits100: Chart on Alloy - Year-over-year growth 2024-2029 (%)
- Exhibits101: Data Table on Alloy - Year-over-year growth 2024-2029 (%)
- Exhibits102: Chart on Compounds - Market size and forecast 2024-2029 ($ million)
- Exhibits103: Data Table on Compounds - Market size and forecast 2024-2029 ($ million)
- Exhibits104: Chart on Compounds - Year-over-year growth 2024-2029 (%)
- Exhibits105: Data Table on Compounds - Year-over-year growth 2024-2029 (%)
- Exhibits106: Market opportunity by Product Type ($ million)
- Exhibits107: Data Table on Market opportunity by Product Type ($ million)
- Exhibits108: Analysis of price sensitivity, lifecycle, customer purchase basket, adoption rates, and purchase criteria
- Exhibits109: Chart on Market share By Geographical Landscape 2024-2029 (%)
- Exhibits110: Data Table on Market share By Geographical Landscape 2024-2029 (%)
- Exhibits111: Chart on Geographic comparison
- Exhibits112: Data Table on Geographic comparison
- Exhibits113: Chart on APAC - Market size and forecast 2024-2029 ($ million)
- Exhibits114: Data Table on APAC - Market size and forecast 2024-2029 ($ million)
- Exhibits115: Chart on APAC - Year-over-year growth 2024-2029 (%)
- Exhibits116: Data Table on APAC - Year-over-year growth 2024-2029 (%)
- Exhibits117: Chart on Europe - Market size and forecast 2024-2029 ($ million)
- Exhibits118: Data Table on Europe - Market size and forecast 2024-2029 ($ million)
- Exhibits119: Chart on Europe - Year-over-year growth 2024-2029 (%)
- Exhibits120: Data Table on Europe - Year-over-year growth 2024-2029 (%)
- Exhibits121: Chart on North America - Market size and forecast 2024-2029 ($ million)
- Exhibits122: Data Table on North America - Market size and forecast 2024-2029 ($ million)
- Exhibits123: Chart on North America - Year-over-year growth 2024-2029 (%)
- Exhibits124: Data Table on North America - Year-over-year growth 2024-2029 (%)
- Exhibits125: Chart on Middle East and Africa - Market size and forecast 2024-2029 ($ million)
- Exhibits126: Data Table on Middle East and Africa - Market size and forecast 2024-2029 ($ million)
- Exhibits127: Chart on Middle East and Africa - Year-over-year growth 2024-2029 (%)
- Exhibits128: Data Table on Middle East and Africa - Year-over-year growth 2024-2029 (%)
- Exhibits129: Chart on South America - Market size and forecast 2024-2029 ($ million)
- Exhibits130: Data Table on South America - Market size and forecast 2024-2029 ($ million)
- Exhibits131: Chart on South America - Year-over-year growth 2024-2029 (%)
- Exhibits132: Data Table on South America - Year-over-year growth 2024-2029 (%)
- Exhibits133: Chart on China - Market size and forecast 2024-2029 ($ million)
- Exhibits134: Data Table on China - Market size and forecast 2024-2029 ($ million)
- Exhibits135: Chart on China - Year-over-year growth 2024-2029 (%)
- Exhibits136: Data Table on China - Year-over-year growth 2024-2029 (%)
- Exhibits137: Chart on US - Market size and forecast 2024-2029 ($ million)
- Exhibits138: Data Table on US - Market size and forecast 2024-2029 ($ million)
- Exhibits139: Chart on US - Year-over-year growth 2024-2029 (%)
- Exhibits140: Data Table on US - Year-over-year growth 2024-2029 (%)
- Exhibits141: Chart on India - Market size and forecast 2024-2029 ($ million)
- Exhibits142: Data Table on India - Market size and forecast 2024-2029 ($ million)
- Exhibits143: Chart on India - Year-over-year growth 2024-2029 (%)
- Exhibits144: Data Table on India - Year-over-year growth 2024-2029 (%)
- Exhibits145: Chart on Japan - Market size and forecast 2024-2029 ($ million)
- Exhibits146: Data Table on Japan - Market size and forecast 2024-2029 ($ million)
- Exhibits147: Chart on Japan - Year-over-year growth 2024-2029 (%)
- Exhibits148: Data Table on Japan - Year-over-year growth 2024-2029 (%)
- Exhibits149: Chart on South Korea - Market size and forecast 2024-2029 ($ million)
- Exhibits150: Data Table on South Korea - Market size and forecast 2024-2029 ($ million)
- Exhibits151: Chart on South Korea - Year-over-year growth 2024-2029 (%)
- Exhibits152: Data Table on South Korea - Year-over-year growth 2024-2029 (%)
- Exhibits153: Chart on Germany - Market size and forecast 2024-2029 ($ million)
- Exhibits154: Data Table on Germany - Market size and forecast 2024-2029 ($ million)
- Exhibits155: Chart on Germany - Year-over-year growth 2024-2029 (%)
- Exhibits156: Data Table on Germany - Year-over-year growth 2024-2029 (%)
- Exhibits157: Chart on UK - Market size and forecast 2024-2029 ($ million)
- Exhibits158: Data Table on UK - Market size and forecast 2024-2029 ($ million)
- Exhibits159: Chart on UK - Year-over-year growth 2024-2029 (%)
- Exhibits160: Data Table on UK - Year-over-year growth 2024-2029 (%)
- Exhibits161: Chart on Australia - Market size and forecast 2024-2029 ($ million)
- Exhibits162: Data Table on Australia - Market size and forecast 2024-2029 ($ million)
- Exhibits163: Chart on Australia - Year-over-year growth 2024-2029 (%)
- Exhibits164: Data Table on Australia - Year-over-year growth 2024-2029 (%)
- Exhibits165: Chart on France - Market size and forecast 2024-2029 ($ million)
- Exhibits166: Data Table on France - Market size and forecast 2024-2029 ($ million)
- Exhibits167: Chart on France - Year-over-year growth 2024-2029 (%)
- Exhibits168: Data Table on France - Year-over-year growth 2024-2029 (%)
- Exhibits169: Chart on Canada - Market size and forecast 2024-2029 ($ million)
- Exhibits170: Data Table on Canada - Market size and forecast 2024-2029 ($ million)
- Exhibits171: Chart on Canada - Year-over-year growth 2024-2029 (%)
- Exhibits172: Data Table on Canada - Year-over-year growth 2024-2029 (%)
- Exhibits173: Market opportunity By Geographical Landscape ($ million)
- Exhibits174: Data Tables on Market opportunity By Geographical Landscape ($ million)
- Exhibits175: Impact of drivers and challenges in 2024 and 2029
- Exhibits176: Overview on criticality of inputs and factors of differentiation
- Exhibits177: Overview on factors of disruption
- Exhibits178: Impact of key risks on business
- Exhibits179: Companies covered
- Exhibits180: Company ranking index
- Exhibits181: Matrix on companies position and classification
- Exhibits182: ABM Metal Tech - Overview
- Exhibits183: ABM Metal Tech - Product / Service
- Exhibits184: ABM Metal Tech - Key offerings
- Exhibits185: SWOT
- Exhibits186: ArcelorMittal - Overview
- Exhibits187: ArcelorMittal - Business segments
- Exhibits188: ArcelorMittal - Key offerings
- Exhibits189: ArcelorMittal - Segment focus
- Exhibits190: SWOT
- Exhibits191: Aurubis AG - Overview
- Exhibits192: Aurubis AG - Business segments
- Exhibits193: Aurubis AG - Key news
- Exhibits194: Aurubis AG - Key offerings
- Exhibits195: Aurubis AG - Segment focus
- Exhibits196: SWOT
- Exhibits197: Bharat Tin Works - Overview
- Exhibits198: Bharat Tin Works - Product / Service
- Exhibits199: Bharat Tin Works - Key offerings
- Exhibits200: SWOT
- Exhibits201: Bharat Ultimate Packaging Pvt. Ltd. - Overview
- Exhibits202: Bharat Ultimate Packaging Pvt. Ltd. - Product / Service
- Exhibits203: Bharat Ultimate Packaging Pvt. Ltd. - Key offerings
- Exhibits204: SWOT
- Exhibits205: DuPont de Nemours Inc. - Overview
- Exhibits206: DuPont de Nemours Inc. - Business segments
- Exhibits207: DuPont de Nemours Inc. - Key news
- Exhibits208: DuPont de Nemours Inc. - Key offerings
- Exhibits209: DuPont de Nemours Inc. - Segment focus
- Exhibits210: SWOT
- Exhibits211: Hindustan Tin Works Ltd. - Overview
- Exhibits212: Hindustan Tin Works Ltd. - Product / Service
- Exhibits213: Hindustan Tin Works Ltd. - Key offerings
- Exhibits214: SWOT
- Exhibits215: Indium Corp. - Overview
- Exhibits216: Indium Corp. - Product / Service
- Exhibits217: Indium Corp. - Key news
- Exhibits218: Indium Corp. - Key offerings
- Exhibits219: SWOT
- Exhibits220: Malaysia Smelting Corp. Berhad - Overview
- Exhibits221: Malaysia Smelting Corp. Berhad - Product / Service
- Exhibits222: Malaysia Smelting Corp. Berhad - Key offerings
- Exhibits223: SWOT
- Exhibits224: Minsur SA - Overview
- Exhibits225: Minsur SA - Product / Service
- Exhibits226: Minsur SA - Key offerings
- Exhibits227: SWOT
- Exhibits228: PT TIMAH Persero Tbk - Overview
- Exhibits229: PT TIMAH Persero Tbk - Product / Service
- Exhibits230: PT TIMAH Persero Tbk - Key offerings
- Exhibits231: SWOT
- Exhibits232: Swastik Tins Pvt. Ltd. - Overview
- Exhibits233: Swastik Tins Pvt. Ltd. - Product / Service
- Exhibits234: Swastik Tins Pvt. Ltd. - Key offerings
- Exhibits235: SWOT
- Exhibits236: Thailand Smelting and Refining Co. Ltd. - Overview
- Exhibits237: Thailand Smelting and Refining Co. Ltd. - Product / Service
- Exhibits238: Thailand Smelting and Refining Co. Ltd. - Key offerings
- Exhibits239: SWOT
- Exhibits240: Yunnan Tin Group Holding Co. Ltd. - Overview
- Exhibits241: Yunnan Tin Group Holding Co. Ltd. - Product / Service
- Exhibits242: Yunnan Tin Group Holding Co. Ltd. - Key offerings
- Exhibits243: SWOT
- Exhibits244: Zenith Tins Pvt. Ltd. - Overview
- Exhibits245: Zenith Tins Pvt. Ltd. - Product / Service
- Exhibits246: Zenith Tins Pvt. Ltd. - Key offerings
- Exhibits247: SWOT
- Exhibits248: Inclusions checklist
- Exhibits249: Exclusions checklist
- Exhibits250: Currency conversion rates for US$
- Exhibits251: Research methodology
- Exhibits252: Information sources
- Exhibits253: Data validation
- Exhibits254: Validation techniques employed for market sizing
- Exhibits255: Data synthesis
- Exhibits256: 360 degree market analysis
- Exhibits257: List of abbreviations
The tin market is forecasted to grow by USD 876.6 mn during 2024-2029, accelerating at a CAGR of 2.1% during the forecast period. The report on the tin market provides a holistic analysis, market size and forecast, trends, growth drivers, and challenges, as well as vendor analysis covering around 25 vendors.
The report offers an up-to-date analysis regarding the current market scenario, the latest trends and drivers, and the overall market environment. The market is driven by growing demand for canned foods and beverages, rise in demand for lead-free soldering, and expansion of consumer electronics industry.
| Market Scope | |
|---|---|
| Base Year | 2025 |
| End Year | 2029 |
| Series Year | 2025-2029 |
| Growth Momentum | Accelerate |
| YOY 2025 | 2.1% |
| CAGR | 2.1% |
| Incremental Value | $876.6 mn |
The study was conducted using an objective combination of primary and secondary information including inputs from key participants in the industry. The report contains a comprehensive market size data, segment with regional analysis and vendor landscape in addition to an analysis of the key companies. Reports have historic and forecast data.
Technavio's tin market is segmented as below:
By Application
- Soldering
- Tin chemical
- Tinplate
- Lead acid battery
- Others
By End-user
- Electronics
- Automotive
- Packaging
- Glass
- Others
By Product Type
- Metal
- Alloy
- Compounds
By Geographical Landscape
- APAC
- Europe
- North America
- Middle East and Africa
- South America
This study identifies the shifting focus toward recycling of tin as one of the prime reasons driving the tin market growth during the next few years. Also, prospective growth in solar energy industry and increasing applications of tin in various applications will lead to sizable demand in the market.
The report on the tin market covers the following areas:
- Tin Market sizing
- Tin Market forecast
- Tin Market industry analysis
The robust vendor analysis is designed to help clients improve their market position, and in line with this, this report provides a detailed analysis of several leading tin market vendors that include ABM Metal Tech, ArcelorMittal, Aurubis AG, Bharat Tin Works, Bharat Ultimate Packaging Pvt. Ltd., DuPont de Nemours Inc., Empresa Metalurgica Vinto, Hindustan Tin Works Ltd., Indium Corp., Malaysia Smelting Corp. Berhad, Minsur SA, Nikitha Containers Pvt. Ltd., PT TIMAH Persero Tbk, Saksham Containers Pvt. Ltd., Suraj Containers Ltd., Swastik Tins Pvt. Ltd., Thailand Smelting and Refining Co. Ltd., Yunnan Tin Group Holding Co. Ltd., and Zenith Tins Pvt. Ltd.. Also, the tin market analysis report includes information on upcoming trends and challenges that will influence market growth. This is to help companies strategize and leverage all forthcoming growth opportunities.
The publisher presents a detailed picture of the market by the way of study, synthesis, and summation of data from multiple sources by an analysis of key parameters such as profit, pricing, competition, and promotions. It presents various market facets by identifying the key industry influencers. The data presented is comprehensive, reliable, and a result of extensive primary and secondary research. The market research reports provide a complete competitive landscape and an in-depth vendor selection methodology and analysis using qualitative and quantitative research to forecast accurate market growth.
Table of Contents
1 Executive Summary
- 1.1 Market overview
- Executive Summary - Chart on Market Overview
- Executive Summary - Data Table on Market Overview
- Executive Summary - Chart on Global Market Characteristics
- Executive Summary - Chart on Market By Geographical Landscape
- Executive Summary - Chart on Market Segmentation by Application
- Executive Summary - Chart on Market Segmentation by End-user
- Executive Summary - Chart on Market Segmentation by Product Type
- Executive Summary - Chart on Incremental Growth
- Executive Summary - Data Table on Incremental Growth
- Executive Summary - Chart on Company Market Positioning
2 Technavio Analysis
- 2.1 Analysis of price sensitivity, lifecycle, customer purchase basket, adoption rates, and purchase criteria
- Analysis of price sensitivity, lifecycle, customer purchase basket, adoption rates, and purchase criteria
- 2.2 Criticality of inputs and Factors of differentiation
- Overview on criticality of inputs and factors of differentiation
- 2.3 Factors of disruption
- Overview on factors of disruption
- 2.4 Impact of drivers and challenges
- Impact of drivers and challenges in 2024 and 2029
3 Market Landscape
- 3.1 Market ecosystem
- Parent Market
- Data Table on - Parent Market
- 3.2 Market characteristics
- Market characteristics analysis
- 3.3 Value chain analysis
- Value chain analysis
4 Market Sizing
- 4.1 Market definition
- Offerings of companies included in the market definition
- 4.2 Market segment analysis
- Market segments
- 4.3 Market size 2024
- 4.4 Market outlook: Forecast for 2024-2029
- Chart on Global - Market size and forecast 2024-2029 ($ million)
- Data Table on Global - Market size and forecast 2024-2029 ($ million)
- Chart on Global Market: Year-over-year growth 2024-2029 (%)
- Data Table on Global Market: Year-over-year growth 2024-2029 (%)
5 Historic Market Size
- 5.1 Global Tin Market 2019 - 2023
- Historic Market Size - Data Table on Global Tin Market 2019 - 2023 ($ million)
- 5.2 Application segment analysis 2019 - 2023
- Historic Market Size - Application Segment 2019 - 2023 ($ million)
- 5.3 End-user segment analysis 2019 - 2023
- Historic Market Size - End-user Segment 2019 - 2023 ($ million)
- 5.4 Product Type segment analysis 2019 - 2023
- Historic Market Size - Product Type Segment 2019 - 2023 ($ million)
- 5.5 Geography segment analysis 2019 - 2023
- Historic Market Size - Geography Segment 2019 - 2023 ($ million)
- 5.6 Country segment analysis 2019 - 2023
- Historic Market Size - Country Segment 2019 - 2023 ($ million)
6 Qualitative Analysis
- 6.1 The impact of AI in the global tin market
7 Five Forces Analysis
- 7.1 Five forces summary
- Five forces analysis - Comparison between 2024 and 2029
- 7.2 Bargaining power of buyers
- Bargaining power of buyers - Impact of key factors 2024 and 2029
- 7.3 Bargaining power of suppliers
- Bargaining power of suppliers - Impact of key factors in 2024 and 2029
- 7.4 Threat of new entrants
- Threat of new entrants - Impact of key factors in 2024 and 2029
- 7.5 Threat of substitutes
- Threat of substitutes - Impact of key factors in 2024 and 2029
- 7.6 Threat of rivalry
- Threat of rivalry - Impact of key factors in 2024 and 2029
- 7.7 Market condition
- Chart on Market condition - Five forces 2024 and 2029
8 Market Segmentation by Application
- 8.1 Market segments
- Chart on Application - Market share 2024-2029 (%)
- Data Table on Application - Market share 2024-2029 (%)
- 8.2 Comparison by Application
- Chart on Comparison by Application
- Data Table on Comparison by Application
- 8.3 Soldering - Market size and forecast 2024-2029
- Chart on Soldering - Market size and forecast 2024-2029 ($ million)
- Data Table on Soldering - Market size and forecast 2024-2029 ($ million)
- Chart on Soldering - Year-over-year growth 2024-2029 (%)
- Data Table on Soldering - Year-over-year growth 2024-2029 (%)
- 8.4 Tin chemical - Market size and forecast 2024-2029
- Chart on Tin chemical - Market size and forecast 2024-2029 ($ million)
- Data Table on Tin chemical - Market size and forecast 2024-2029 ($ million)
- Chart on Tin chemical - Year-over-year growth 2024-2029 (%)
- Data Table on Tin chemical - Year-over-year growth 2024-2029 (%)
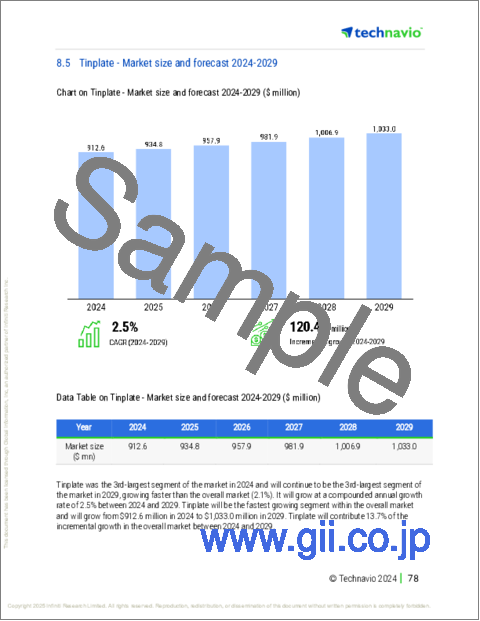
- 8.5 Tinplate - Market size and forecast 2024-2029
- Chart on Tinplate - Market size and forecast 2024-2029 ($ million)
- Data Table on Tinplate - Market size and forecast 2024-2029 ($ million)
- Chart on Tinplate - Year-over-year growth 2024-2029 (%)
- Data Table on Tinplate - Year-over-year growth 2024-2029 (%)
- 8.6 Lead acid battery - Market size and forecast 2024-2029
- Chart on Lead acid battery - Market size and forecast 2024-2029 ($ million)
- Data Table on Lead acid battery - Market size and forecast 2024-2029 ($ million)
- Chart on Lead acid battery - Year-over-year growth 2024-2029 (%)
- Data Table on Lead acid battery - Year-over-year growth 2024-2029 (%)
- 8.7 Others - Market size and forecast 2024-2029
- Chart on Others - Market size and forecast 2024-2029 ($ million)
- Data Table on Others - Market size and forecast 2024-2029 ($ million)
- Chart on Others - Year-over-year growth 2024-2029 (%)
- Data Table on Others - Year-over-year growth 2024-2029 (%)
- 8.8 Market opportunity by Application
- Market opportunity by Application ($ million)
- Data Table on Market opportunity by Application ($ million)
9 Market Segmentation by End-user
- 9.1 Market segments
- Chart on End-user - Market share 2024-2029 (%)
- Data Table on End-user - Market share 2024-2029 (%)
- 9.2 Comparison by End-user
- Chart on Comparison by End-user
- Data Table on Comparison by End-user
- 9.3 Electronics - Market size and forecast 2024-2029
- Chart on Electronics - Market size and forecast 2024-2029 ($ million)
- Data Table on Electronics - Market size and forecast 2024-2029 ($ million)
- Chart on Electronics - Year-over-year growth 2024-2029 (%)
- Data Table on Electronics - Year-over-year growth 2024-2029 (%)
- 9.4 Automotive - Market size and forecast 2024-2029
- Chart on Automotive - Market size and forecast 2024-2029 ($ million)
- Data Table on Automotive - Market size and forecast 2024-2029 ($ million)
- Chart on Automotive - Year-over-year growth 2024-2029 (%)
- Data Table on Automotive - Year-over-year growth 2024-2029 (%)
- 9.5 Packaging - Market size and forecast 2024-2029
- Chart on Packaging - Market size and forecast 2024-2029 ($ million)
- Data Table on Packaging - Market size and forecast 2024-2029 ($ million)
- Chart on Packaging - Year-over-year growth 2024-2029 (%)
- Data Table on Packaging - Year-over-year growth 2024-2029 (%)
- 9.6 Glass - Market size and forecast 2024-2029
- Chart on Glass - Market size and forecast 2024-2029 ($ million)
- Data Table on Glass - Market size and forecast 2024-2029 ($ million)
- Chart on Glass - Year-over-year growth 2024-2029 (%)
- Data Table on Glass - Year-over-year growth 2024-2029 (%)
- 9.7 Others - Market size and forecast 2024-2029
- Chart on Others - Market size and forecast 2024-2029 ($ million)
- Data Table on Others - Market size and forecast 2024-2029 ($ million)
- Chart on Others - Year-over-year growth 2024-2029 (%)
- Data Table on Others - Year-over-year growth 2024-2029 (%)
- 9.8 Market opportunity by End-user
- Market opportunity by End-user ($ million)
- Data Table on Market opportunity by End-user ($ million)
10 Market Segmentation by Product Type
- 10.1 Market segments
- Chart on Product Type - Market share 2024-2029 (%)
- Data Table on Product Type - Market share 2024-2029 (%)
- 10.2 Comparison by Product Type
- Chart on Comparison by Product Type
- Data Table on Comparison by Product Type
- 10.3 Metal - Market size and forecast 2024-2029
- Chart on Metal - Market size and forecast 2024-2029 ($ million)
- Data Table on Metal - Market size and forecast 2024-2029 ($ million)
- Chart on Metal - Year-over-year growth 2024-2029 (%)
- Data Table on Metal - Year-over-year growth 2024-2029 (%)
- 10.4 Alloy - Market size and forecast 2024-2029
- Chart on Alloy - Market size and forecast 2024-2029 ($ million)
- Data Table on Alloy - Market size and forecast 2024-2029 ($ million)
- Chart on Alloy - Year-over-year growth 2024-2029 (%)
- Data Table on Alloy - Year-over-year growth 2024-2029 (%)
- 10.5 Compounds - Market size and forecast 2024-2029
- Chart on Compounds - Market size and forecast 2024-2029 ($ million)
- Data Table on Compounds - Market size and forecast 2024-2029 ($ million)
- Chart on Compounds - Year-over-year growth 2024-2029 (%)
- Data Table on Compounds - Year-over-year growth 2024-2029 (%)
- 10.6 Market opportunity by Product Type
- Market opportunity by Product Type ($ million)
- Data Table on Market opportunity by Product Type ($ million)
11 Customer Landscape
- 11.1 Customer landscape overview
- Analysis of price sensitivity, lifecycle, customer purchase basket, adoption rates, and purchase criteria
12 Geographic Landscape
- 12.1 Geographic segmentation
- Chart on Market share By Geographical Landscape 2024-2029 (%)
- Data Table on Market share By Geographical Landscape 2024-2029 (%)
- 12.2 Geographic comparison
- Chart on Geographic comparison
- Data Table on Geographic comparison
- 12.3 APAC - Market size and forecast 2024-2029
- Chart on APAC - Market size and forecast 2024-2029 ($ million)
- Data Table on APAC - Market size and forecast 2024-2029 ($ million)
- Chart on APAC - Year-over-year growth 2024-2029 (%)
- Data Table on APAC - Year-over-year growth 2024-2029 (%)
- 12.4 Europe - Market size and forecast 2024-2029
- Chart on Europe - Market size and forecast 2024-2029 ($ million)
- Data Table on Europe - Market size and forecast 2024-2029 ($ million)
- Chart on Europe - Year-over-year growth 2024-2029 (%)
- Data Table on Europe - Year-over-year growth 2024-2029 (%)
- 12.5 North America - Market size and forecast 2024-2029
- Chart on North America - Market size and forecast 2024-2029 ($ million)
- Data Table on North America - Market size and forecast 2024-2029 ($ million)
- Chart on North America - Year-over-year growth 2024-2029 (%)
- Data Table on North America - Year-over-year growth 2024-2029 (%)
- 12.6 Middle East and Africa - Market size and forecast 2024-2029
- Chart on Middle East and Africa - Market size and forecast 2024-2029 ($ million)
- Data Table on Middle East and Africa - Market size and forecast 2024-2029 ($ million)
- Chart on Middle East and Africa - Year-over-year growth 2024-2029 (%)
- Data Table on Middle East and Africa - Year-over-year growth 2024-2029 (%)
- 12.7 South America - Market size and forecast 2024-2029
- Chart on South America - Market size and forecast 2024-2029 ($ million)
- Data Table on South America - Market size and forecast 2024-2029 ($ million)
- Chart on South America - Year-over-year growth 2024-2029 (%)
- Data Table on South America - Year-over-year growth 2024-2029 (%)
- 12.8 China - Market size and forecast 2024-2029
- Chart on China - Market size and forecast 2024-2029 ($ million)
- Data Table on China - Market size and forecast 2024-2029 ($ million)
- Chart on China - Year-over-year growth 2024-2029 (%)
- Data Table on China - Year-over-year growth 2024-2029 (%)
- 12.9 US - Market size and forecast 2024-2029
- Chart on US - Market size and forecast 2024-2029 ($ million)
- Data Table on US - Market size and forecast 2024-2029 ($ million)
- Chart on US - Year-over-year growth 2024-2029 (%)
- Data Table on US - Year-over-year growth 2024-2029 (%)
- 12.10 India - Market size and forecast 2024-2029
- Chart on India - Market size and forecast 2024-2029 ($ million)
- Data Table on India - Market size and forecast 2024-2029 ($ million)
- Chart on India - Year-over-year growth 2024-2029 (%)
- Data Table on India - Year-over-year growth 2024-2029 (%)
- 12.11 Japan - Market size and forecast 2024-2029
- Chart on Japan - Market size and forecast 2024-2029 ($ million)
- Data Table on Japan - Market size and forecast 2024-2029 ($ million)
- Chart on Japan - Year-over-year growth 2024-2029 (%)
- Data Table on Japan - Year-over-year growth 2024-2029 (%)
- 12.12 South Korea - Market size and forecast 2024-2029
- Chart on South Korea - Market size and forecast 2024-2029 ($ million)
- Data Table on South Korea - Market size and forecast 2024-2029 ($ million)
- Chart on South Korea - Year-over-year growth 2024-2029 (%)
- Data Table on South Korea - Year-over-year growth 2024-2029 (%)
- 12.13 Germany - Market size and forecast 2024-2029
- Chart on Germany - Market size and forecast 2024-2029 ($ million)
- Data Table on Germany - Market size and forecast 2024-2029 ($ million)
- Chart on Germany - Year-over-year growth 2024-2029 (%)
- Data Table on Germany - Year-over-year growth 2024-2029 (%)
- 12.14 UK - Market size and forecast 2024-2029
- Chart on UK - Market size and forecast 2024-2029 ($ million)
- Data Table on UK - Market size and forecast 2024-2029 ($ million)
- Chart on UK - Year-over-year growth 2024-2029 (%)
- Data Table on UK - Year-over-year growth 2024-2029 (%)
- 12.15 Australia - Market size and forecast 2024-2029
- Chart on Australia - Market size and forecast 2024-2029 ($ million)
- Data Table on Australia - Market size and forecast 2024-2029 ($ million)
- Chart on Australia - Year-over-year growth 2024-2029 (%)
- Data Table on Australia - Year-over-year growth 2024-2029 (%)
- 12.16 France - Market size and forecast 2024-2029
- Chart on France - Market size and forecast 2024-2029 ($ million)
- Data Table on France - Market size and forecast 2024-2029 ($ million)
- Chart on France - Year-over-year growth 2024-2029 (%)
- Data Table on France - Year-over-year growth 2024-2029 (%)
- 12.17 Canada - Market size and forecast 2024-2029
- Chart on Canada - Market size and forecast 2024-2029 ($ million)
- Data Table on Canada - Market size and forecast 2024-2029 ($ million)
- Chart on Canada - Year-over-year growth 2024-2029 (%)
- Data Table on Canada - Year-over-year growth 2024-2029 (%)
- 12.18 Market opportunity By Geographical Landscape
- Market opportunity By Geographical Landscape ($ million)
- Data Tables on Market opportunity By Geographical Landscape ($ million)
13 Drivers, Challenges, and Opportunity/Restraints
- 13.1 Market drivers
- 13.2 Market challenges
- 13.3 Impact of drivers and challenges
- Impact of drivers and challenges in 2024 and 2029
- 13.4 Market opportunities/restraints
14 Competitive Landscape
- 14.1 Overview
- 14.2 Competitive Landscape
- Overview on criticality of inputs and factors of differentiation
- 14.3 Landscape disruption
- Overview on factors of disruption
- 14.4 Industry risks
- Impact of key risks on business
15 Competitive Analysis
- 15.1 Companies profiled
- Companies covered
- 15.2 Company ranking index
- Company ranking index
- 15.3 Market positioning of companies
- Matrix on companies position and classification
- 15.4 ABM Metal Tech
- ABM Metal Tech - Overview
- ABM Metal Tech - Product / Service
- ABM Metal Tech - Key offerings
- SWOT
- 15.5 ArcelorMittal
- ArcelorMittal - Overview
- ArcelorMittal - Business segments
- ArcelorMittal - Key offerings
- ArcelorMittal - Segment focus
- SWOT
- 15.6 Aurubis AG
- Aurubis AG - Overview
- Aurubis AG - Business segments
- Aurubis AG - Key news
- Aurubis AG - Key offerings
- Aurubis AG - Segment focus
- SWOT
- 15.7 Bharat Tin Works
- Bharat Tin Works - Overview
- Bharat Tin Works - Product / Service
- Bharat Tin Works - Key offerings
- SWOT
- 15.8 Bharat Ultimate Packaging Pvt. Ltd.
- Bharat Ultimate Packaging Pvt. Ltd. - Overview
- Bharat Ultimate Packaging Pvt. Ltd. - Product / Service
- Bharat Ultimate Packaging Pvt. Ltd. - Key offerings
- SWOT
- 15.9 DuPont de Nemours Inc.
- DuPont de Nemours Inc. - Overview
- DuPont de Nemours Inc. - Business segments
- DuPont de Nemours Inc. - Key news
- DuPont de Nemours Inc. - Key offerings
- DuPont de Nemours Inc. - Segment focus
- SWOT
- 15.10 Hindustan Tin Works Ltd.
- Hindustan Tin Works Ltd. - Overview
- Hindustan Tin Works Ltd. - Product / Service
- Hindustan Tin Works Ltd. - Key offerings
- SWOT
- 15.11 Indium Corp.
- Indium Corp. - Overview
- Indium Corp. - Product / Service
- Indium Corp. - Key news
- Indium Corp. - Key offerings
- SWOT
- 15.12 Malaysia Smelting Corp. Berhad
- Malaysia Smelting Corp. Berhad - Overview
- Malaysia Smelting Corp. Berhad - Product / Service
- Malaysia Smelting Corp. Berhad - Key offerings
- SWOT
- 15.13 Minsur SA
- Minsur SA - Overview
- Minsur SA - Product / Service
- Minsur SA - Key offerings
- SWOT
- 15.14 PT TIMAH Persero Tbk
- PT TIMAH Persero Tbk - Overview
- PT TIMAH Persero Tbk - Product / Service
- PT TIMAH Persero Tbk - Key offerings
- SWOT
- 15.15 Swastik Tins Pvt. Ltd.
- Swastik Tins Pvt. Ltd. - Overview
- Swastik Tins Pvt. Ltd. - Product / Service
- Swastik Tins Pvt. Ltd. - Key offerings
- SWOT
- 15.16 Thailand Smelting and Refining Co. Ltd.
- Thailand Smelting and Refining Co. Ltd. - Overview
- Thailand Smelting and Refining Co. Ltd. - Product / Service
- Thailand Smelting and Refining Co. Ltd. - Key offerings
- SWOT
- 15.17 Yunnan Tin Group Holding Co. Ltd.
- Yunnan Tin Group Holding Co. Ltd. - Overview
- Yunnan Tin Group Holding Co. Ltd. - Product / Service
- Yunnan Tin Group Holding Co. Ltd. - Key offerings
- SWOT
- 15.18 Zenith Tins Pvt. Ltd.
- Zenith Tins Pvt. Ltd. - Overview
- Zenith Tins Pvt. Ltd. - Product / Service
- Zenith Tins Pvt. Ltd. - Key offerings
- SWOT
16 Appendix
- 16.1 Scope of the report
- 16.2 Inclusions and exclusions checklist
- Inclusions checklist
- Exclusions checklist
- 16.3 Currency conversion rates for US$
- Currency conversion rates for US$
- 16.4 Research methodology
- Research methodology
- 16.5 Data procurement
- Information sources
- 16.6 Data validation
- Data validation
- 16.7 Validation techniques employed for market sizing
- Validation techniques employed for market sizing
- 16.8 Data synthesis
- Data synthesis
- 16.9 360 degree market analysis
- 360 degree market analysis
- 16.10 List of abbreviations
- List of abbreviations

