|
|
市場調査レポート
商品コード
1626801
医療機器洗浄の世界市場 2025-2029年Global Medical Device Cleaning Market 2025-2029 |
||||||

|
|||||||
カスタマイズ可能
|
|||||||


| 医療機器洗浄の世界市場 2025-2029年 |
|
出版日: 2024年12月18日
発行: TechNavio
ページ情報: 英文 206 Pages
納期: 即納可能
|

全表示
- 概要
- 図表
- 目次
医療機器洗浄市場 2025-2029年
医療機器洗浄市場は2024-2029年に7億5,040万米ドル、予測期間中のCAGRは5.6%と予測されています。当レポートでは、医療機器洗浄市場の全体的な分析、市場規模・予測、動向、成長促進要因、課題、約25のベンダーを網羅したベンダー分析などを掲載しています。
現在の市場シナリオ、最新動向と促進要因、市場環境全体に関する最新分析を提供しています。市場は、感染症の増加と感染対策の必要性、医療機器の滅菌と連動した外科手術の増加、ヘルスケアインフラの拡大によって牽引されています。
| 市場範囲 | |
|---|---|
| 基準年 | 2025 |
| 終了年 | 2029 |
| 予測期間 | 2025-2029 |
| 成長モメンタム | 加速 |
| 前年比2025年 | 5.3% |
| CAGR | 5.6% |
| 増分額 | 7億5,040万米ドル |
本調査では、環境に優しく持続可能な洗浄ソリューションへの嗜好の高まりが、今後数年間の医療機器洗浄市場成長を牽引する主要因の1つであるとしています。また、洗浄・殺菌方法の技術的進歩や紫外線除菌装置の出現は、市場の大きな需要につながります。
目次
第1章 エグゼクティブサマリー
- 市場概要
第2章 Technavio別分析
- 価格・ライフサイクル・顧客購入バスケット・採用率・購入基準の分析
- インプットの重要性と差別化の要因
- 混乱の要因
- 促進要因と課題の影響
第3章 市場情勢
- 市場エコシステム
- 市場の特徴
- バリューチェーン分析
第4章 市場規模
- 市場の定義
- 市場セグメント分析
- 市場規模 2024
- 市場の見通し 2024-2029
第5章 市場規模実績
- 医療機器洗浄の世界市場 2019-2023
- デバイス別セグメント分析 2019-2023
- 技術別セグメント分析 2019-2023
- 地域別セグメント分析 2019-2023
- 国別セグメント分析 2019-2023
第6章 定性分析
- AIの影響:医療機器洗浄の世界市場
第7章 ファイブフォース分析
- ファイブフォースの要約
- 買い手の交渉力
- 供給企業の交渉力
- 新規参入業者の脅威
- 代替品の脅威
- 競争の脅威
- 市況
第8章 市場セグメンテーション:デバイス別
- 市場セグメント
- 比較:デバイス別
- 高水準消毒:市場規模と予測 2024-2029
- 滅菌:市場規模と予測 2024-2029
- 洗浄:市場規模と予測 2024-2029
- 市場機会:デバイス別
第9章 市場セグメンテーション:技術別
- 市場セグメント
- 比較:技術別
- 消毒:市場規模と予測 2024-2029
- 殺菌:市場規模と予測 2024-2029
- 洗浄:市場規模と予測 2024-2029
- その他:市場規模と予測 2024-2029
- 市場機会:技術別
第10章 顧客情勢
- 顧客情勢の概要
第11章 地域別情勢
- 地域別セグメンテーション
- 地域別比較
- 北米:市場規模と予測 2024-2029
- アジア:市場規模と予測 2024-2029
- 欧州:市場規模と予測 2024-2029
- 世界のその他の地域:市場規模と予測 2024-2029
- 米国:市場規模と予測 2024-2029
- 中国:市場規模と予測 2024-2029
- ドイツ:市場規模と予測 2024-2029
- インド:市場規模と予測 2024-2029
- 日本:市場規模と予測 2024-2029
- カナダ:市場規模と予測 2024-2029
- 韓国:市場規模と予測 2024-2029
- 英国:市場規模と予測 2024-2029
- フランス:市場規模と予測 2024-2029
- イタリア:市場規模と予測 2024-2029
- 市場機会:地域情勢別
第12章 促進要因・課題・機会・抑制要因
- 市場促進要因
- 市場の課題
- 促進要因と課題の影響
- 市場の機会・抑制要因
第13章 競合情勢
- 概要
- 競合情勢
- 混乱の状況
- 業界のリスク
第14章 競合分析
- 企業プロファイル
- 企業ランキング指数
- 企業の市場ポジショニング
- Alconox Inc.
- ASP Global Manufacturing GmbH
- B.Braun SE
- Ecolab Inc.
- Envista Holdings Corp.
- GAMA Healthcare Ltd.
- Getinge AB
- Integra LifeSciences Holdings Corp.
- Metall Zug AG
- Mindflow Design
- Olympus Corp.
- Paul Hartmann AG
- Ruhof Corp.
- STERIS Plc.
第15章 付録
Exhibits:
- Exhibits1: Executive Summary - Chart on Market Overview
- Exhibits2: Executive Summary - Data Table on Market Overview
- Exhibits3: Executive Summary - Chart on Global Market Characteristics
- Exhibits4: Executive Summary - Chart on Market By Geographical Landscape
- Exhibits5: Executive Summary - Chart on Market Segmentation by Device
- Exhibits6: Executive Summary - Chart on Market Segmentation by Technique
- Exhibits7: Executive Summary - Chart on Incremental Growth
- Exhibits8: Executive Summary - Data Table on Incremental Growth
- Exhibits9: Executive Summary - Chart on Company Market Positioning
- Exhibits10: Analysis of price sensitivity, lifecycle, customer purchase basket, adoption rates, and purchase criteria
- Exhibits11: Overview on criticality of inputs and factors of differentiation
- Exhibits12: Overview on factors of disruption
- Exhibits13: Impact of drivers and challenges in 2024 and 2029
- Exhibits14: Parent Market
- Exhibits15: Data Table on - Parent Market
- Exhibits16: Market characteristics analysis
- Exhibits17: Value chain analysis
- Exhibits18: Offerings of companies included in the market definition
- Exhibits19: Market segments
- Exhibits20: Chart on Global - Market size and forecast 2024-2029 ($ million)
- Exhibits21: Data Table on Global - Market size and forecast 2024-2029 ($ million)
- Exhibits22: Chart on Global Market: Year-over-year growth 2024-2029 (%)
- Exhibits23: Data Table on Global Market: Year-over-year growth 2024-2029 (%)
- Exhibits24: Historic Market Size - Data Table on Global Medical Device Cleaning Market 2019 - 2023 ($ million)
- Exhibits25: Historic Market Size - Device Segment 2019 - 2023 ($ million)
- Exhibits26: Historic Market Size - Technique Segment 2019 - 2023 ($ million)
- Exhibits27: Historic Market Size - Geography Segment 2019 - 2023 ($ million)
- Exhibits28: Historic Market Size - Country Segment 2019 - 2023 ($ million)
- Exhibits29: Five forces analysis - Comparison between 2024 and 2029
- Exhibits30: Bargaining power of buyers - Impact of key factors 2024 and 2029
- Exhibits31: Bargaining power of suppliers - Impact of key factors in 2024 and 2029
- Exhibits32: Threat of new entrants - Impact of key factors in 2024 and 2029
- Exhibits33: Threat of substitutes - Impact of key factors in 2024 and 2029
- Exhibits34: Threat of rivalry - Impact of key factors in 2024 and 2029
- Exhibits35: Chart on Market condition - Five forces 2024 and 2029
- Exhibits36: Chart on Device - Market share 2024-2029 (%)
- Exhibits37: Data Table on Device - Market share 2024-2029 (%)
- Exhibits38: Chart on Comparison by Device
- Exhibits39: Data Table on Comparison by Device
- Exhibits40: Chart on Semi-critical - Market size and forecast 2024-2029 ($ million)
- Exhibits41: Data Table on Semi-critical - Market size and forecast 2024-2029 ($ million)
- Exhibits42: Chart on Semi-critical - Year-over-year growth 2024-2029 (%)
- Exhibits43: Data Table on Semi-critical - Year-over-year growth 2024-2029 (%)
- Exhibits44: Chart on Critical - Market size and forecast 2024-2029 ($ million)
- Exhibits45: Data Table on Critical - Market size and forecast 2024-2029 ($ million)
- Exhibits46: Chart on Critical - Year-over-year growth 2024-2029 (%)
- Exhibits47: Data Table on Critical - Year-over-year growth 2024-2029 (%)
- Exhibits48: Chart on Non-critical - Market size and forecast 2024-2029 ($ million)
- Exhibits49: Data Table on Non-critical - Market size and forecast 2024-2029 ($ million)
- Exhibits50: Chart on Non-critical - Year-over-year growth 2024-2029 (%)
- Exhibits51: Data Table on Non-critical - Year-over-year growth 2024-2029 (%)
- Exhibits52: Market opportunity by Device ($ million)
- Exhibits53: Data Table on Market opportunity by Device ($ million)
- Exhibits54: Chart on Technique - Market share 2024-2029 (%)
- Exhibits55: Data Table on Technique - Market share 2024-2029 (%)
- Exhibits56: Chart on Comparison by Technique
- Exhibits57: Data Table on Comparison by Technique
- Exhibits58: Chart on Disinfection - Market size and forecast 2024-2029 ($ million)
- Exhibits59: Data Table on Disinfection - Market size and forecast 2024-2029 ($ million)
- Exhibits60: Chart on Disinfection - Year-over-year growth 2024-2029 (%)
- Exhibits61: Data Table on Disinfection - Year-over-year growth 2024-2029 (%)
- Exhibits62: Chart on Sterilization - Market size and forecast 2024-2029 ($ million)
- Exhibits63: Data Table on Sterilization - Market size and forecast 2024-2029 ($ million)
- Exhibits64: Chart on Sterilization - Year-over-year growth 2024-2029 (%)
- Exhibits65: Data Table on Sterilization - Year-over-year growth 2024-2029 (%)
- Exhibits66: Chart on Cleaning - Market size and forecast 2024-2029 ($ million)
- Exhibits67: Data Table on Cleaning - Market size and forecast 2024-2029 ($ million)
- Exhibits68: Chart on Cleaning - Year-over-year growth 2024-2029 (%)
- Exhibits69: Data Table on Cleaning - Year-over-year growth 2024-2029 (%)
- Exhibits70: Chart on Others - Market size and forecast 2024-2029 ($ million)
- Exhibits71: Data Table on Others - Market size and forecast 2024-2029 ($ million)
- Exhibits72: Chart on Others - Year-over-year growth 2024-2029 (%)
- Exhibits73: Data Table on Others - Year-over-year growth 2024-2029 (%)
- Exhibits74: Market opportunity by Technique ($ million)
- Exhibits75: Data Table on Market opportunity by Technique ($ million)
- Exhibits76: Analysis of price sensitivity, lifecycle, customer purchase basket, adoption rates, and purchase criteria
- Exhibits77: Chart on Market share By Geographical Landscape 2024-2029 (%)
- Exhibits78: Data Table on Market share By Geographical Landscape 2024-2029 (%)
- Exhibits79: Chart on Geographic comparison
- Exhibits80: Data Table on Geographic comparison
- Exhibits81: Chart on North America - Market size and forecast 2024-2029 ($ million)
- Exhibits82: Data Table on North America - Market size and forecast 2024-2029 ($ million)
- Exhibits83: Chart on North America - Year-over-year growth 2024-2029 (%)
- Exhibits84: Data Table on North America - Year-over-year growth 2024-2029 (%)
- Exhibits85: Chart on Asia - Market size and forecast 2024-2029 ($ million)
- Exhibits86: Data Table on Asia - Market size and forecast 2024-2029 ($ million)
- Exhibits87: Chart on Asia - Year-over-year growth 2024-2029 (%)
- Exhibits88: Data Table on Asia - Year-over-year growth 2024-2029 (%)
- Exhibits89: Chart on Europe - Market size and forecast 2024-2029 ($ million)
- Exhibits90: Data Table on Europe - Market size and forecast 2024-2029 ($ million)
- Exhibits91: Chart on Europe - Year-over-year growth 2024-2029 (%)
- Exhibits92: Data Table on Europe - Year-over-year growth 2024-2029 (%)
- Exhibits93: Chart on Rest of World (ROW) - Market size and forecast 2024-2029 ($ million)
- Exhibits94: Data Table on Rest of World (ROW) - Market size and forecast 2024-2029 ($ million)
- Exhibits95: Chart on Rest of World (ROW) - Year-over-year growth 2024-2029 (%)
- Exhibits96: Data Table on Rest of World (ROW) - Year-over-year growth 2024-2029 (%)
- Exhibits97: Chart on US - Market size and forecast 2024-2029 ($ million)
- Exhibits98: Data Table on US - Market size and forecast 2024-2029 ($ million)
- Exhibits99: Chart on US - Year-over-year growth 2024-2029 (%)
- Exhibits100: Data Table on US - Year-over-year growth 2024-2029 (%)
- Exhibits101: Chart on China - Market size and forecast 2024-2029 ($ million)
- Exhibits102: Data Table on China - Market size and forecast 2024-2029 ($ million)
- Exhibits103: Chart on China - Year-over-year growth 2024-2029 (%)
- Exhibits104: Data Table on China - Year-over-year growth 2024-2029 (%)
- Exhibits105: Chart on Germany - Market size and forecast 2024-2029 ($ million)
- Exhibits106: Data Table on Germany - Market size and forecast 2024-2029 ($ million)
- Exhibits107: Chart on Germany - Year-over-year growth 2024-2029 (%)
- Exhibits108: Data Table on Germany - Year-over-year growth 2024-2029 (%)
- Exhibits109: Chart on India - Market size and forecast 2024-2029 ($ million)
- Exhibits110: Data Table on India - Market size and forecast 2024-2029 ($ million)
- Exhibits111: Chart on India - Year-over-year growth 2024-2029 (%)
- Exhibits112: Data Table on India - Year-over-year growth 2024-2029 (%)
- Exhibits113: Chart on Japan - Market size and forecast 2024-2029 ($ million)
- Exhibits114: Data Table on Japan - Market size and forecast 2024-2029 ($ million)
- Exhibits115: Chart on Japan - Year-over-year growth 2024-2029 (%)
- Exhibits116: Data Table on Japan - Year-over-year growth 2024-2029 (%)
- Exhibits117: Chart on Canada - Market size and forecast 2024-2029 ($ million)
- Exhibits118: Data Table on Canada - Market size and forecast 2024-2029 ($ million)
- Exhibits119: Chart on Canada - Year-over-year growth 2024-2029 (%)
- Exhibits120: Data Table on Canada - Year-over-year growth 2024-2029 (%)
- Exhibits121: Chart on South Korea - Market size and forecast 2024-2029 ($ million)
- Exhibits122: Data Table on South Korea - Market size and forecast 2024-2029 ($ million)
- Exhibits123: Chart on South Korea - Year-over-year growth 2024-2029 (%)
- Exhibits124: Data Table on South Korea - Year-over-year growth 2024-2029 (%)
- Exhibits125: Chart on UK - Market size and forecast 2024-2029 ($ million)
- Exhibits126: Data Table on UK - Market size and forecast 2024-2029 ($ million)
- Exhibits127: Chart on UK - Year-over-year growth 2024-2029 (%)
- Exhibits128: Data Table on UK - Year-over-year growth 2024-2029 (%)
- Exhibits129: Chart on France - Market size and forecast 2024-2029 ($ million)
- Exhibits130: Data Table on France - Market size and forecast 2024-2029 ($ million)
- Exhibits131: Chart on France - Year-over-year growth 2024-2029 (%)
- Exhibits132: Data Table on France - Year-over-year growth 2024-2029 (%)
- Exhibits133: Chart on Italy - Market size and forecast 2024-2029 ($ million)
- Exhibits134: Data Table on Italy - Market size and forecast 2024-2029 ($ million)
- Exhibits135: Chart on Italy - Year-over-year growth 2024-2029 (%)
- Exhibits136: Data Table on Italy - Year-over-year growth 2024-2029 (%)
- Exhibits137: Market opportunity By Geographical Landscape ($ million)
- Exhibits138: Data Tables on Market opportunity By Geographical Landscape ($ million)
- Exhibits139: Impact of drivers and challenges in 2024 and 2029
- Exhibits140: Overview on criticality of inputs and factors of differentiation
- Exhibits141: Overview on factors of disruption
- Exhibits142: Impact of key risks on business
- Exhibits143: Companies covered
- Exhibits144: Company ranking index
- Exhibits145: Matrix on companies position and classification
- Exhibits146: 3M Co. - Overview
- Exhibits147: 3M Co. - Business segments
- Exhibits148: 3M Co. - Key news
- Exhibits149: 3M Co. - Key offerings
- Exhibits150: 3M Co. - Segment focus
- Exhibits151: SWOT
- Exhibits152: Alconox Inc. - Overview
- Exhibits153: Alconox Inc. - Product / Service
- Exhibits154: Alconox Inc. - Key offerings
- Exhibits155: SWOT
- Exhibits156: ASP Global Manufacturing GmbH - Overview
- Exhibits157: ASP Global Manufacturing GmbH - Product / Service
- Exhibits158: ASP Global Manufacturing GmbH - Key offerings
- Exhibits159: SWOT
- Exhibits160: B.Braun SE - Overview
- Exhibits161: B.Braun SE - Product / Service
- Exhibits162: B.Braun SE - Key news
- Exhibits163: B.Braun SE - Key offerings
- Exhibits164: SWOT
- Exhibits165: Ecolab Inc. - Overview
- Exhibits166: Ecolab Inc. - Business segments
- Exhibits167: Ecolab Inc. - Key news
- Exhibits168: Ecolab Inc. - Key offerings
- Exhibits169: Ecolab Inc. - Segment focus
- Exhibits170: SWOT
- Exhibits171: Envista Holdings Corp. - Overview
- Exhibits172: Envista Holdings Corp. - Business segments
- Exhibits173: Envista Holdings Corp. - Key news
- Exhibits174: Envista Holdings Corp. - Key offerings
- Exhibits175: Envista Holdings Corp. - Segment focus
- Exhibits176: SWOT
- Exhibits177: GAMA Healthcare Ltd. - Overview
- Exhibits178: GAMA Healthcare Ltd. - Product / Service
- Exhibits179: GAMA Healthcare Ltd. - Key offerings
- Exhibits180: SWOT
- Exhibits181: Getinge AB - Overview
- Exhibits182: Getinge AB - Business segments
- Exhibits183: Getinge AB - Key news
- Exhibits184: Getinge AB - Key offerings
- Exhibits185: Getinge AB - Segment focus
- Exhibits186: SWOT
- Exhibits187: Integra LifeSciences Holdings Corp. - Overview
- Exhibits188: Integra LifeSciences Holdings Corp. - Business segments
- Exhibits189: Integra LifeSciences Holdings Corp. - Key news
- Exhibits190: Integra LifeSciences Holdings Corp. - Key offerings
- Exhibits191: Integra LifeSciences Holdings Corp. - Segment focus
- Exhibits192: SWOT
- Exhibits193: Metall Zug AG - Overview
- Exhibits194: Metall Zug AG - Business segments
- Exhibits195: Metall Zug AG - Key offerings
- Exhibits196: Metall Zug AG - Segment focus
- Exhibits197: SWOT
- Exhibits198: Mindflow Design - Overview
- Exhibits199: Mindflow Design - Product / Service
- Exhibits200: Mindflow Design - Key offerings
- Exhibits201: SWOT
- Exhibits202: Olympus Corp. - Overview
- Exhibits203: Olympus Corp. - Business segments
- Exhibits204: Olympus Corp. - Key news
- Exhibits205: Olympus Corp. - Key offerings
- Exhibits206: Olympus Corp. - Segment focus
- Exhibits207: SWOT
- Exhibits208: Paul Hartmann AG - Overview
- Exhibits209: Paul Hartmann AG - Business segments
- Exhibits210: Paul Hartmann AG - Key offerings
- Exhibits211: Paul Hartmann AG - Segment focus
- Exhibits212: SWOT
- Exhibits213: Ruhof Corp. - Overview
- Exhibits214: Ruhof Corp. - Product / Service
- Exhibits215: Ruhof Corp. - Key offerings
- Exhibits216: SWOT
- Exhibits217: STERIS Plc. - Overview
- Exhibits218: STERIS Plc. - Business segments
- Exhibits219: STERIS Plc. - Key offerings
- Exhibits220: STERIS Plc. - Segment focus
- Exhibits221: SWOT
- Exhibits222: Inclusions checklist
- Exhibits223: Exclusions checklist
- Exhibits224: Currency conversion rates for US$
- Exhibits225: Research methodology
- Exhibits226: Information sources
- Exhibits227: Data validation
- Exhibits228: Validation techniques employed for market sizing
- Exhibits229: Data synthesis
- Exhibits230: 360 degree market analysis
- Exhibits231: List of abbreviations
Medical Device Cleaning Market 2025-2029
The medical device cleaning market is forecasted to grow by USD 750.4 mn during 2024-2029, accelerating at a CAGR of 5.6% during the forecast period. The report on the medical device cleaning market provides a holistic analysis, market size and forecast, trends, growth drivers, and challenges, as well as vendor analysis covering around 25 vendors.
The report offers an up-to-date analysis regarding the current market scenario, the latest trends and drivers, and the overall market environment. The market is driven by increasing prevalence of hais and need for infection control measures, growing surgical procedures coupled with sterilization of medical devices, and expansion in healthcare infrastructure.
| Market Scope | |
|---|---|
| Base Year | 2025 |
| End Year | 2029 |
| Series Year | 2025-2029 |
| Growth Momentum | Accelerate |
| YOY 2025 | 5.3% |
| CAGR | 5.6% |
| Incremental Value | $750.4 mn |
Technavio's medical device cleaning market is segmented as below:
By Device
- Semi-critical
- Critical
- Non-critical
By Technique
- Disinfection
- Sterilization
- Cleaning
- Others
By Geographical Landscape
- North America
- Asia
- Europe
- Rest of World (ROW)
This study identifies the growing preference for environmentally friendly and sustainable cleaning solutions as one of the prime reasons driving the medical device cleaning market growth during the next few years. Also, technological advancements in cleaning and sterilization methods and emergence of uv sanitizer devices will lead to sizable demand in the market.
The report on the medical device cleaning market covers the following areas:
- Medical Device Cleaning Market sizing
- Medical Device Cleaning Market forecast
- Medical Device Cleaning Market industry analysis
The robust vendor analysis is designed to help clients improve their market position, and in line with this, this report provides a detailed analysis of several leading medical device cleaning market vendors that include 3M Co., Alconox Inc., ASP Global Manufacturing GmbH, B.Braun SE, Berchtold Medical GmbH and Co.KG, Ecolab Inc., Envista Holdings Corp., GAMA Healthcare Ltd., Getinge AB, Integra LifeSciences Holdings Corp., Metall Zug AG, Micropoint Bioscience Inc., Mindflow Design, Olympus Corp., Paul Hartmann AG, Ruhof Corp., Sklar Surgical Instruments, Solvay SA, STERIS Plc., and Young Innovations Inc.. Also, the medical device cleaning market analysis report includes information on upcoming trends and challenges that will influence market growth. This is to help companies strategize and leverage all forthcoming growth opportunities.
The study was conducted using an objective combination of primary and secondary information including inputs from key participants in the industry. The report contains a comprehensive market and vendor landscape in addition to an analysis of the key vendors.
The publisher presents a detailed picture of the market by the way of study, synthesis, and summation of data from multiple sources by an analysis of key parameters such as profit, pricing, competition, and promotions. It presents various market facets by identifying the key industry influencers. The data presented is comprehensive, reliable, and a result of extensive primary and secondary research. The market research reports provide a complete competitive landscape and an in-depth vendor selection methodology and analysis using qualitative and quantitative research to forecast accurate market growth.
Table of Contents
1 Executive Summary
- 1.1 Market overview
- Executive Summary - Chart on Market Overview
- Executive Summary - Data Table on Market Overview
- Executive Summary - Chart on Global Market Characteristics
- Executive Summary - Chart on Market By Geographical Landscape
- Executive Summary - Chart on Market Segmentation by Device
- Executive Summary - Chart on Market Segmentation by Technique
- Executive Summary - Chart on Incremental Growth
- Executive Summary - Data Table on Incremental Growth
- Executive Summary - Chart on Company Market Positioning
2 Technavio Analysis
- 2.1 Analysis of price sensitivity, lifecycle, customer purchase basket, adoption rates, and purchase criteria
- Analysis of price sensitivity, lifecycle, customer purchase basket, adoption rates, and purchase criteria
- 2.2 Criticality of inputs and Factors of differentiation
- Overview on criticality of inputs and factors of differentiation
- 2.3 Factors of disruption
- Overview on factors of disruption
- 2.4 Impact of drivers and challenges
- Impact of drivers and challenges in 2024 and 2029
3 Market Landscape
- 3.1 Market ecosystem
- Parent Market
- Data Table on - Parent Market
- 3.2 Market characteristics
- Market characteristics analysis
- 3.3 Value chain analysis
- Value chain analysis
4 Market Sizing
- 4.1 Market definition
- Offerings of companies included in the market definition
- 4.2 Market segment analysis
- Market segments
- 4.3 Market size 2024
- 4.4 Market outlook: Forecast for 2024-2029
- Chart on Global - Market size and forecast 2024-2029 ($ million)
- Data Table on Global - Market size and forecast 2024-2029 ($ million)
- Chart on Global Market: Year-over-year growth 2024-2029 (%)
- Data Table on Global Market: Year-over-year growth 2024-2029 (%)
5 Historic Market Size
- 5.1 Global Medical Device Cleaning Market 2019 - 2023
- Historic Market Size - Data Table on Global Medical Device Cleaning Market 2019 - 2023 ($ million)
- 5.2 Device segment analysis 2019 - 2023
- Historic Market Size - Device Segment 2019 - 2023 ($ million)
- 5.3 Technique segment analysis 2019 - 2023
- Historic Market Size - Technique Segment 2019 - 2023 ($ million)
- 5.4 Geography segment analysis 2019 - 2023
- Historic Market Size - Geography Segment 2019 - 2023 ($ million)
- 5.5 Country segment analysis 2019 - 2023
- Historic Market Size - Country Segment 2019 - 2023 ($ million)
6 Qualitative Analysis
- 6.1 The impact of AI in Global Medical Device Cleaning Market
7 Five Forces Analysis
- 7.1 Five forces summary
- Five forces analysis - Comparison between 2024 and 2029
- 7.2 Bargaining power of buyers
- Bargaining power of buyers - Impact of key factors 2024 and 2029
- 7.3 Bargaining power of suppliers
- Bargaining power of suppliers - Impact of key factors in 2024 and 2029
- 7.4 Threat of new entrants
- Threat of new entrants - Impact of key factors in 2024 and 2029
- 7.5 Threat of substitutes
- Threat of substitutes - Impact of key factors in 2024 and 2029
- 7.6 Threat of rivalry
- Threat of rivalry - Impact of key factors in 2024 and 2029
- 7.7 Market condition
- Chart on Market condition - Five forces 2024 and 2029
8 Market Segmentation by Device
- 8.1 Market segments
- Chart on Device - Market share 2024-2029 (%)
- Data Table on Device - Market share 2024-2029 (%)
- 8.2 Comparison by Device
- Chart on Comparison by Device
- Data Table on Comparison by Device
- 8.3 Semi-critical - Market size and forecast 2024-2029
- Chart on Semi-critical - Market size and forecast 2024-2029 ($ million)
- Data Table on Semi-critical - Market size and forecast 2024-2029 ($ million)
- Chart on Semi-critical - Year-over-year growth 2024-2029 (%)
- Data Table on Semi-critical - Year-over-year growth 2024-2029 (%)
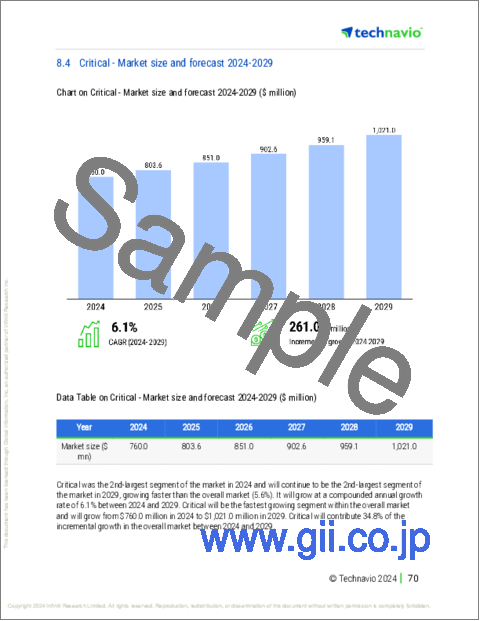
- 8.4 Critical - Market size and forecast 2024-2029
- Chart on Critical - Market size and forecast 2024-2029 ($ million)
- Data Table on Critical - Market size and forecast 2024-2029 ($ million)
- Chart on Critical - Year-over-year growth 2024-2029 (%)
- Data Table on Critical - Year-over-year growth 2024-2029 (%)
- 8.5 Non-critical - Market size and forecast 2024-2029
- Chart on Non-critical - Market size and forecast 2024-2029 ($ million)
- Data Table on Non-critical - Market size and forecast 2024-2029 ($ million)
- Chart on Non-critical - Year-over-year growth 2024-2029 (%)
- Data Table on Non-critical - Year-over-year growth 2024-2029 (%)
- 8.6 Market opportunity by Device
- Market opportunity by Device ($ million)
- Data Table on Market opportunity by Device ($ million)
9 Market Segmentation by Technique
- 9.1 Market segments
- Chart on Technique - Market share 2024-2029 (%)
- Data Table on Technique - Market share 2024-2029 (%)
- 9.2 Comparison by Technique
- Chart on Comparison by Technique
- Data Table on Comparison by Technique
- 9.3 Disinfection - Market size and forecast 2024-2029
- Chart on Disinfection - Market size and forecast 2024-2029 ($ million)
- Data Table on Disinfection - Market size and forecast 2024-2029 ($ million)
- Chart on Disinfection - Year-over-year growth 2024-2029 (%)
- Data Table on Disinfection - Year-over-year growth 2024-2029 (%)
- 9.4 Sterilization - Market size and forecast 2024-2029
- Chart on Sterilization - Market size and forecast 2024-2029 ($ million)
- Data Table on Sterilization - Market size and forecast 2024-2029 ($ million)
- Chart on Sterilization - Year-over-year growth 2024-2029 (%)
- Data Table on Sterilization - Year-over-year growth 2024-2029 (%)
- 9.5 Cleaning - Market size and forecast 2024-2029
- Chart on Cleaning - Market size and forecast 2024-2029 ($ million)
- Data Table on Cleaning - Market size and forecast 2024-2029 ($ million)
- Chart on Cleaning - Year-over-year growth 2024-2029 (%)
- Data Table on Cleaning - Year-over-year growth 2024-2029 (%)
- 9.6 Others - Market size and forecast 2024-2029
- Chart on Others - Market size and forecast 2024-2029 ($ million)
- Data Table on Others - Market size and forecast 2024-2029 ($ million)
- Chart on Others - Year-over-year growth 2024-2029 (%)
- Data Table on Others - Year-over-year growth 2024-2029 (%)
- 9.7 Market opportunity by Technique
- Market opportunity by Technique ($ million)
- Data Table on Market opportunity by Technique ($ million)
10 Customer Landscape
- 10.1 Customer landscape overview
- Analysis of price sensitivity, lifecycle, customer purchase basket, adoption rates, and purchase criteria
11 Geographic Landscape
- 11.1 Geographic segmentation
- Chart on Market share By Geographical Landscape 2024-2029 (%)
- Data Table on Market share By Geographical Landscape 2024-2029 (%)
- 11.2 Geographic comparison
- Chart on Geographic comparison
- Data Table on Geographic comparison
- 11.3 North America - Market size and forecast 2024-2029
- Chart on North America - Market size and forecast 2024-2029 ($ million)
- Data Table on North America - Market size and forecast 2024-2029 ($ million)
- Chart on North America - Year-over-year growth 2024-2029 (%)
- Data Table on North America - Year-over-year growth 2024-2029 (%)
- 11.4 Asia - Market size and forecast 2024-2029
- Chart on Asia - Market size and forecast 2024-2029 ($ million)
- Data Table on Asia - Market size and forecast 2024-2029 ($ million)
- Chart on Asia - Year-over-year growth 2024-2029 (%)
- Data Table on Asia - Year-over-year growth 2024-2029 (%)
- 11.5 Europe - Market size and forecast 2024-2029
- Chart on Europe - Market size and forecast 2024-2029 ($ million)
- Data Table on Europe - Market size and forecast 2024-2029 ($ million)
- Chart on Europe - Year-over-year growth 2024-2029 (%)
- Data Table on Europe - Year-over-year growth 2024-2029 (%)
- 11.6 Rest of World (ROW) - Market size and forecast 2024-2029
- Chart on Rest of World (ROW) - Market size and forecast 2024-2029 ($ million)
- Data Table on Rest of World (ROW) - Market size and forecast 2024-2029 ($ million)
- Chart on Rest of World (ROW) - Year-over-year growth 2024-2029 (%)
- Data Table on Rest of World (ROW) - Year-over-year growth 2024-2029 (%)
- 11.7 US - Market size and forecast 2024-2029
- Chart on US - Market size and forecast 2024-2029 ($ million)
- Data Table on US - Market size and forecast 2024-2029 ($ million)
- Chart on US - Year-over-year growth 2024-2029 (%)
- Data Table on US - Year-over-year growth 2024-2029 (%)
- 11.8 China - Market size and forecast 2024-2029
- Chart on China - Market size and forecast 2024-2029 ($ million)
- Data Table on China - Market size and forecast 2024-2029 ($ million)
- Chart on China - Year-over-year growth 2024-2029 (%)
- Data Table on China - Year-over-year growth 2024-2029 (%)
- 11.9 Germany - Market size and forecast 2024-2029
- Chart on Germany - Market size and forecast 2024-2029 ($ million)
- Data Table on Germany - Market size and forecast 2024-2029 ($ million)
- Chart on Germany - Year-over-year growth 2024-2029 (%)
- Data Table on Germany - Year-over-year growth 2024-2029 (%)
- 11.10 India - Market size and forecast 2024-2029
- Chart on India - Market size and forecast 2024-2029 ($ million)
- Data Table on India - Market size and forecast 2024-2029 ($ million)
- Chart on India - Year-over-year growth 2024-2029 (%)
- Data Table on India - Year-over-year growth 2024-2029 (%)
- 11.11 Japan - Market size and forecast 2024-2029
- Chart on Japan - Market size and forecast 2024-2029 ($ million)
- Data Table on Japan - Market size and forecast 2024-2029 ($ million)
- Chart on Japan - Year-over-year growth 2024-2029 (%)
- Data Table on Japan - Year-over-year growth 2024-2029 (%)
- 11.12 Canada - Market size and forecast 2024-2029
- Chart on Canada - Market size and forecast 2024-2029 ($ million)
- Data Table on Canada - Market size and forecast 2024-2029 ($ million)
- Chart on Canada - Year-over-year growth 2024-2029 (%)
- Data Table on Canada - Year-over-year growth 2024-2029 (%)
- 11.13 South Korea - Market size and forecast 2024-2029
- Chart on South Korea - Market size and forecast 2024-2029 ($ million)
- Data Table on South Korea - Market size and forecast 2024-2029 ($ million)
- Chart on South Korea - Year-over-year growth 2024-2029 (%)
- Data Table on South Korea - Year-over-year growth 2024-2029 (%)
- 11.14 UK - Market size and forecast 2024-2029
- Chart on UK - Market size and forecast 2024-2029 ($ million)
- Data Table on UK - Market size and forecast 2024-2029 ($ million)
- Chart on UK - Year-over-year growth 2024-2029 (%)
- Data Table on UK - Year-over-year growth 2024-2029 (%)
- 11.15 France - Market size and forecast 2024-2029
- Chart on France - Market size and forecast 2024-2029 ($ million)
- Data Table on France - Market size and forecast 2024-2029 ($ million)
- Chart on France - Year-over-year growth 2024-2029 (%)
- Data Table on France - Year-over-year growth 2024-2029 (%)
- 11.16 Italy - Market size and forecast 2024-2029
- Chart on Italy - Market size and forecast 2024-2029 ($ million)
- Data Table on Italy - Market size and forecast 2024-2029 ($ million)
- Chart on Italy - Year-over-year growth 2024-2029 (%)
- Data Table on Italy - Year-over-year growth 2024-2029 (%)
- 11.17 Market opportunity By Geographical Landscape
- Market opportunity By Geographical Landscape ($ million)
- Data Tables on Market opportunity By Geographical Landscape ($ million)
12 Drivers, Challenges, and Opportunity/Restraints
- 12.1 Market drivers
- 12.2 Market challenges
- 12.3 Impact of drivers and challenges
- Impact of drivers and challenges in 2024 and 2029
- 12.4 Market opportunities/restraints
13 Competitive Landscape
- 13.1 Overview
- 13.2 Competitive Landscape
- Overview on criticality of inputs and factors of differentiation
- 13.3 Landscape disruption
- Overview on factors of disruption
- 13.4 Industry risks
- Impact of key risks on business
14 Competitive Analysis
- 14.1 Companies profiled
- Companies covered
- 14.2 Company ranking index
- Company ranking index
- 14.3 Market positioning of companies
- Matrix on companies position and classification
- 3M Co.
- 3M Co. - Overview
- 3M Co. - Business segments
- 3M Co. - Key news
- 3M Co. - Key offerings
- 3M Co. - Segment focus
- SWOT
- 14.5 Alconox Inc.
- Alconox Inc. - Overview
- Alconox Inc. - Product / Service
- Alconox Inc. - Key offerings
- SWOT
- 14.6 ASP Global Manufacturing GmbH
- ASP Global Manufacturing GmbH - Overview
- ASP Global Manufacturing GmbH - Product / Service
- ASP Global Manufacturing GmbH - Key offerings
- SWOT
- 14.7 B.Braun SE
- B.Braun SE - Overview
- B.Braun SE - Product / Service
- B.Braun SE - Key news
- B.Braun SE - Key offerings
- SWOT
- 14.8 Ecolab Inc.
- Ecolab Inc. - Overview
- Ecolab Inc. - Business segments
- Ecolab Inc. - Key news
- Ecolab Inc. - Key offerings
- Ecolab Inc. - Segment focus
- SWOT
- 14.9 Envista Holdings Corp.
- Envista Holdings Corp. - Overview
- Envista Holdings Corp. - Business segments
- Envista Holdings Corp. - Key news
- Envista Holdings Corp. - Key offerings
- Envista Holdings Corp. - Segment focus
- SWOT
- 14.10 GAMA Healthcare Ltd.
- GAMA Healthcare Ltd. - Overview
- GAMA Healthcare Ltd. - Product / Service
- GAMA Healthcare Ltd. - Key offerings
- SWOT
- 14.11 Getinge AB
- Getinge AB - Overview
- Getinge AB - Business segments
- Getinge AB - Key news
- Getinge AB - Key offerings
- Getinge AB - Segment focus
- SWOT
- 14.12 Integra LifeSciences Holdings Corp.
- Integra LifeSciences Holdings Corp. - Overview
- Integra LifeSciences Holdings Corp. - Business segments
- Integra LifeSciences Holdings Corp. - Key news
- Integra LifeSciences Holdings Corp. - Key offerings
- Integra LifeSciences Holdings Corp. - Segment focus
- SWOT
- 14.13 Metall Zug AG
- Metall Zug AG - Overview
- Metall Zug AG - Business segments
- Metall Zug AG - Key offerings
- Metall Zug AG - Segment focus
- SWOT
- 14.14 Mindflow Design
- Mindflow Design - Overview
- Mindflow Design - Product / Service
- Mindflow Design - Key offerings
- SWOT
- 14.15 Olympus Corp.
- Olympus Corp. - Overview
- Olympus Corp. - Business segments
- Olympus Corp. - Key news
- Olympus Corp. - Key offerings
- Olympus Corp. - Segment focus
- SWOT
- 14.16 Paul Hartmann AG
- Paul Hartmann AG - Overview
- Paul Hartmann AG - Business segments
- Paul Hartmann AG - Key offerings
- Paul Hartmann AG - Segment focus
- SWOT
- 14.17 Ruhof Corp.
- Ruhof Corp. - Overview
- Ruhof Corp. - Product / Service
- Ruhof Corp. - Key offerings
- SWOT
- 14.18 STERIS Plc.
- STERIS Plc. - Overview
- STERIS Plc. - Business segments
- STERIS Plc. - Key offerings
- STERIS Plc. - Segment focus
- SWOT
15 Appendix
- 15.1 Scope of the report
- 15.2 Inclusions and exclusions checklist
- Inclusions checklist
- Exclusions checklist
- 15.3 Currency conversion rates for US$
- Currency conversion rates for US$
- 15.4 Research methodology
- Research methodology
- 15.5 Data procurement
- Information sources
- 15.6 Data validation
- Data validation
- 15.7 Validation techniques employed for market sizing
- Validation techniques employed for market sizing
- 15.8 Data synthesis
- Data synthesis
- 15.9 360 degree market analysis
- 360 degree market analysis
- 15.10 List of abbreviations
- List of abbreviations
- o Strong financial performance

